direction with a bicrystal structure. It is shown that nanowires are rooted on Fe
I. INTRODUCTION
Tailoring the shape of nanostructures is one of the key challenges in the growth control. It has been shown that the growth morphologies of nanostructures can be changed by various mechanisms, e.g., via epitaxial stress for the growth of lattice-mismatched materials systems such as Ge/Si, InAs/InP, or using small-sized catalysts for the nanowire growth via a vapor–liquid–solid (VLS) mechanism.Reference Dick1–Reference Motta, Sgarlata, Calarco, Nguyen, Cal, Patella, Balzarotti and De Crescenzi9 Whereas VLS is the widely used mechanism for controlled growth of nanowires, the geometrical shapes (i.e., cross sections) of the resulting one-dimensional structure are usually defined by energetics, and shape-dependent thermodynamic models based on a geometric summation of the Gibbs free energies of different crystal facets as a function of total volume and aspect ratio are usually adopted.Reference Fan, Barnard and Zacharias10–Reference Barnard, Xiao and Cai12 The growth of oxide nanowires by thermal oxidation of metals has recently received intensive interest, largely due to its technical simplicity and large-scale growth capabilities.Reference Jiang, Herricks and Xia13–Reference Dong, Kashkarov and Zhang23 However, the precise mechanism underlying the one-dimensional oxide growth is still a matter of debate, and various models are proposed including the evaporation and condensation mechanism, i.e., vapor–solid model,Reference Jiang, Herricks and Xia13, Reference Hsieh, Chen, Lin and Shih24, Reference Huang, Yang, Li, Gu, Du, Lu and Shi25 short circuit diffusion mechanism (i.e., diffusion along a tunnel centered along the core of a screw dislocation),Reference Rapp26–Reference Kofstad28 and stress-driven diffusion.Reference Goncalves, Campos, Ferlauto and Lacerda29–Reference Chen, Zhang, Wang, Zhang, Miao, Fan, Yan and Yan31 Even less is known about the control in the growth morphologies of oxide nanowires during the oxidation process. This complexity is largely due to the convolution and coupling of different processes involved in the oxidation leading to the oxide nanowire formation, including layered oxide growth, interfacial reactions, mass transport, and stress generation and relaxation.
Hematite (α-Fe2O3) is the most stable iron oxide. One-dimensional α-Fe2O3 is a promising nanomaterial for advanced applications in catalysis, gas sensors, water splitting, dye solar cells, magnetic storage media, environmental protection, pigment, and controlled drug delivery.Reference Chen, Xu, Li and Gou32–Reference Hsu, Li and Hsiao37 α-Fe2O3 nanowires have been obtained by various methods including templates,Reference Peng, Zhang, Pan and Li38 sol-gel-mediated reaction,Reference Wang, Zhang, Liu, Zhao, Li, Huang and Du39, Reference Zhong, Hu, Liang, Cao, Song and Wan40 solvothermal conditions,Reference Jin, Ohkoshi and Hashimoto41 and gas decomposition.Reference Wu, Lee, Chiang and Wong42 Although much effort is being given to develop nanoscale hematite by oxidation of iron,Reference Wen, Wang, Ding, Wang and Yang20, Reference Cvelbar, Chen, Sunkara and Mozetic43–Reference Wang, Chen, Fu, Zhang and Kisielowski48 the growth processes critical to the control in the growth morphology of nanoscale hematite during the thermal oxidation are still far from established. In this work, we show that the growth of either α-Fe2O3 nanobelts or nanowires can be tuned via control of the oxygen gas pressure during the oxidation of iron. In contrast to the thermodynamically controlled growth shapes of one-dimensional nanostructures,Reference Fan, Barnard and Zacharias10–Reference Barnard, Xiao and Cai12 we find that the growth morphologies of hematite, i.e., nanowires and nanobelts, are defined by the geometry and shape of the locations at which the nucleation and growth of nanowires and nanobelts occur. The results provide fundamental insight into understanding the interplay between the generation/relaxation of internal stresses, mass transport, and oxide growth morphologies during multiphase layered oxide scale growth.
II. EXPERIMENT
The oxidation experiment consists of a substrate heater located in the center of a vacuum chamber and a gas handling system. The temperature of the samples can be monitored by a K-type thermocouple connected with the heater. Fresh iron foils with 99.99% purity (Sigma-Aldrich, Missouri, MO) were used as the substrate for oxidation. The iron foils were first cleaned in deionized water followed by ultrasonication in ethanol for 5 min before putting on the substrate heater. Before oxidation, the system was sealed and pumped to a base pressure of 2 × 10⁻⁶ Torr. High purity oxygen gas (>99.99%) was introduced into the vacuum chamber to desired oxygen pressures (pO2), and the samples were then heated at the rate of 20 °C/min to 600 °C. The oxygen gas pressure in the chamber was kept constant during the oxidation. After the oxidation at 600 °C, the samples were cooled down naturally (about 10 °C/min) to room temperature (∼25 °C) under the same oxygen atmosphere. The oxidized samples were examined by field emission scanning electron microscopy (FE-SEM) (FEI Supra 55VP, Hillsboro, OR) and x-ray diffraction (XRD) (PANalytical, Westborough, MA). The growth morphology and atomic structure of individual nanowires and nanobelts were analyzed by transmission electron microscopy (TEM) using a JEOL JEM-2010-HT (Tokyo, Japan) operated at 200 kV.
III. RESULTS
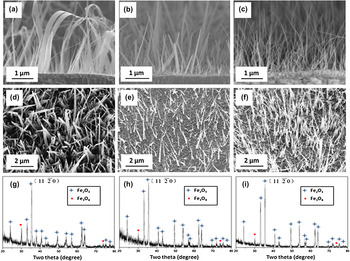
Our SEM observations reveal that the oxidized Fe surface is dominated by the growth of nanobelts for oxygen pressures around 0.1 Torr and by nanowire formation for oxygen pressures around 200 Torr. The growth of both nanowires and nanobelts occurs for the oxygen pressure values between the two oxygen pressure limits as above. Figure 1 shows representative SEM images of the Fe substrates oxidized for 1 h at T = 600 °C for the different oxygen gas pressures. Figure 1(a)–1(c) and Fig. 1(d)–1(f) are side view and top view SEM images, respectively, of the Fe substrates oxidized at pO2 = 0.1, 50, and 200 Torr, respectively. For the oxidation at pO2 = 0.1 Torr, it can be seen that the oxidized surface is covered by a high density of nanobelts with the width varying from 100 to 300 nm and length up to ∼5 μm. It is also noted that the width of nanobelts decreases along their length direction from the root to the tip. For the oxidation at pO2 = 200 Torr, the oxidized surface is covered by a high density of nanowires with the diameter ranging from 50 to 150 nm and length up to 6 μm. Nanowires show relatively uniform diameter along the length direction with a tapered shape at the tip. For the oxidation at pO2 = 50 Torr, the substrate surface is covered by a mixture of nanobelts and nanowires, as shown in Fig. 1(b) and 1(e). The side view SEM images show that both nanobelts and nanowires are perpendicular to the substrate surfaces at their roots. No significant differences in lengths are found for nanowires and nanobelts formed under the different oxygen gas pressures. Figure 1(g)–1(i) shows the XRD results of the Fe substrates under the corresponding oxygen gas pressures. These XRD patterns match well with rhombohedral α-Fe2O3. The comparison to the standard polycrystalline α-Fe2O3 XRD pattern shows that the diffraction peak  exhibits much stronger intensity in these patterns, suggesting that both nanobelts and nanowires grow preferentially along
 direction.
SEM micrographs of the surface morphology of Fe foils oxidized at 600 °C for 1h under different oxygen gas pressures: Upper panel: side-view SEM images of Fe foils oxidized at (a) pO2 = 0.1 Torr, (b) pO2 = 50 Torr (b), and (c) pO2 = 200 Torr; Middle panel: top-view SEM images (d, e, and f) of the Fe foils oxidized at the corresponding oxygen pressures; Lower panel: X-ray diffraction from the oxidized Fe foils for the different oxygen gas pressure [(g): pO2 = 0.1 Torr, (h): pO2 = 50 Torr, (i): pO2 = 200 Torr].

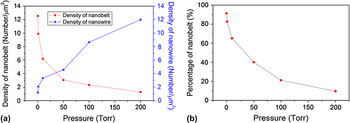
To obtain more quantitative information regarding the effect of oxygen pressure on the different oxide growth morphologies, more samples were oxidized at different oxygen pressures. Figure 2(a) shows the evolution of surface density of nanobelts and nanowires obtained from oxidation under different oxygen gas pressures, which reveals clearly that the surface density of nanobelts decreases with increasing oxygen gas pressure, whereas the surface density of nanowires increases with increasing the oxygen pressure. Figure 2(b) shows the evolution of proportion of nanobelts to nanowires as related to change in oxygen pressure. As can be seen, the oxygen gas pressure can tune efficiently the percentage of nanowires and nanobelts on the oxidized surface. In addition, we also examined the effect of oxidation temperatures ranging from 350 to 700 °C at the oxygen pressure of 200 Torr and noted that only nanowires are formed for these temperatures, suggesting relatively insignificant effect of the oxidation temperature on the oxide growth morphologies at constant oxygen gas pressure.
(a) The surface density of the nanobelts and nanowires as a function of oxygen gas pressure; (b) the percentage of nanowires in the mixture of nanowires and nanobelts as a function of oxygen gas pressure.

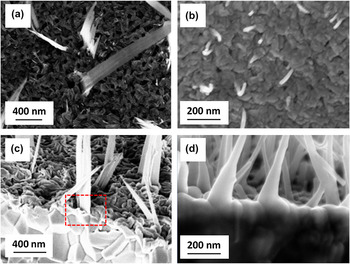
The effect of oxidation time on the oxide growth was also examined. We find that increasing the oxidation time results in longer and denser nanowires or nanobelts but no noticeable changes occur to the oxide morphologies under the particular oxygen gas pressure. This suggests that the shape of nanobelts or nanowires is defined in their initial formation stages and the shape is retained during the subsequent growth stages. Figure 3(a) and 3(b) are SEM images showing the initially formed nanowires and nanobelts on Fe substrates oxidized for only 30 min with pO2 = 0.1 Torr and 10 min with pO2 = 200 Torr, respectively. The SEM images reveal that both surfaces are covered with a layer of α-Fe2O3 oxide grains, and it can be seen that nanobelts and nanowires originate from different surface regions, i.e., nanobelts are associated with the grain boundary areas, whereas nanowires are formed directly on top of grains. Side view SEM images [Fig. 3(c) and 3(d)] obtained from the oxidized samples confirm these growth features. It becomes clear from these observations that nanobelts grow out of grain boundaries, and the resulting morphology (wide in width but thin in thickness) is defined by the geometry of grain boundaries, i.e., wide and thin along the boundary, and nanowires grow on the top of grains and the resulting shape is correlated with the shape of grains.
The initial growth morphologies of nanobelts and nanowires: Upper panel: top views of Fe foils oxidized for 30 min at pO2 = 0.1 Torr (a) and oxidized for 10 min at pO2 = 200 Torr (b); lower panel: side-view SEM micrographs showing the root regions of nanobelts and nanowires obtained from the oxygen pressures of 0.1 Torr (c) and 200 Torr (d), the area indicated by the dashed box in (c) shows clearly that the nanobelt is grown out of the grain boundary.

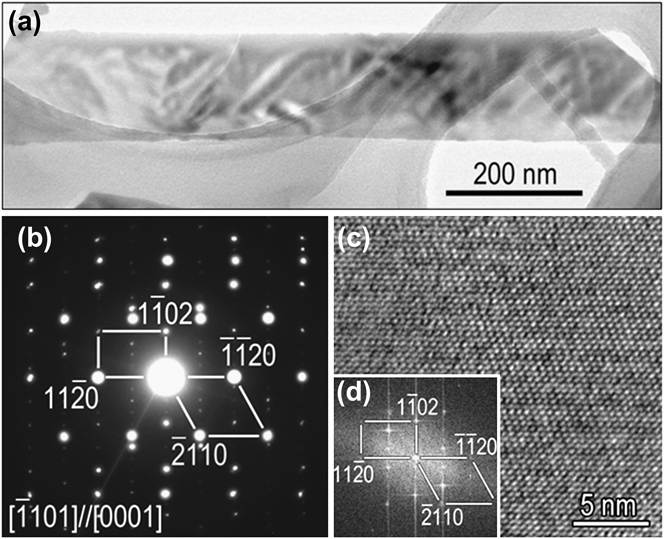
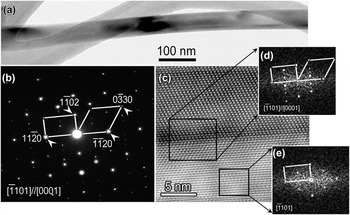
The microstructures of nanobelts and nanowires were further examined by TEM. Figure 4(a) shows a bright-field (BF) TEM image of a typical nanobelt with a width of ∼200 nm. Figure 4(b) is a selected area electron diffraction (SAED) pattern from the nanobelt. The diffraction pattern can be indexed with two sets of diffraction spots, one refers to an incident electron beam parallel to the [0001] zone axis and the other is the  zone axis with [0001]//
 . The appearance of the two sets of diffraction patterns from the same area suggests that the nanobelt has a bicrystal structure. In addition, by combining the morphology image and diffraction pattern in Fig. 4(a) and 4(b), we can find that the length direction of the nanobelt is along
 . Figure 4(c) and 4(d) displays a high-resolution transmission electron microscopy (HRTEM) image of the nanobelt and the corresponding Fourier transform pattern, which can be indexed in the same way as the diffraction pattern in Fig. 4(b), further confirming the bicrystal structure of the nanobelt. Note that the bicrystal boundary is not visible in the HRTEM image because the bicrystal plane is perpendicular to the incident electron beam.
(a) Bright-field (BF) TEM image of an α-Fe2O3 nanobelt obtained from oxidation at pO2 = 0.1 Torr; (b) SAED pattern from the nanobelt in (a); (c) HRTEM image of the nanobelt in (a); (d) a Fourier transform pattern of the HRTEM image.
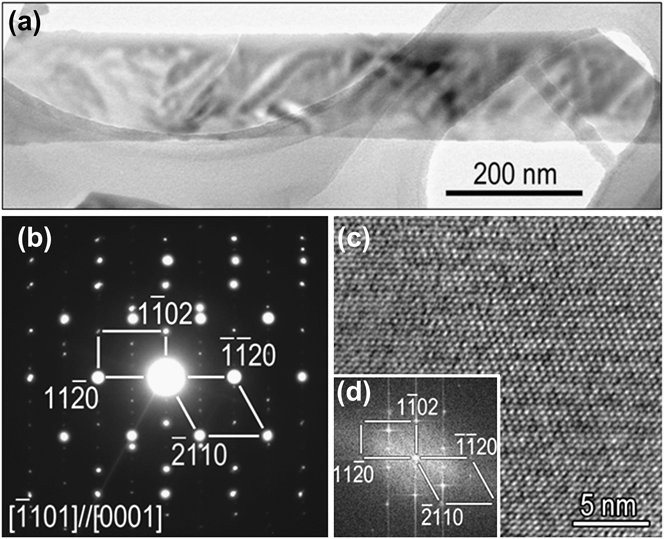
Figure 5(a) shows a BF TEM image of a nanowire obtained from the oxidation at pO2 = 200 Torr and Fig. 5(b) is a SAED pattern from the nanowire. Similar to the case of nanobelts, the diffraction pattern also contains two sets of diffraction spots with the zone axis of  and [0001], respectively, suggesting a bicrystal structure. Figure 5(c) is a high-resolution electron microscopy image of the nanowire, which shows clearly the presence of a bicrystal boundary at middle of the nanowire. The Fourier transform patterns in Fig. 5(d) and 5(e) from the bicrystal boundary region give the same pattern as shown in Fig. 5(b), confirming the nature of the bicrystal structure of the nanowire. The length direction of the nanowire is along
 as known from the electron diffraction pattern. The preferred growth direction of
 for both the nanowires and nanobelts as revealed by TEM results is consistent with the XRD data, which shows that the intensity of the
 peak is much stronger than other peaks (Fig. 1).
(a) BF TEM image of an α-Fe2O3 nanowire obtained from the oxidation at pO2 = 200 Torr; (b) SAED pattern of the nanowire in (a); (c) HRTEM image of the nanowire in (a); (d, e) Fourier transform patterns from the regions indicated by the dashed boxes in the HRTEM image.

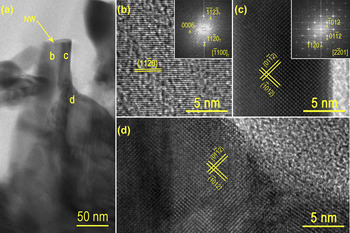
Cross-sectional TEM specimen was also made to examine the root region of nanowires formed from the oxidation at pO2 = 200 Torr. Figure 6(a) is a BF TEM image obtained from the interface region between the nanowire root and the underlying Fe2O3 oxide grain. It can be seen obviously that the Fe2O3 nanowire is formed on top of the underlying Fe2O3 grain, consistent with the SEM observations. Figure 6(b)–6(d) shows HRTEM images from the different regions of the nanowire and the underlying Fe2O3 grain as indicated in Fig. 6(a). Both the crystal lattices and Fourier transform patterns reveal that the two sides of the nanowire have different crystal orientations due to its bicrystal structure. However, the HRTEM image [Fig. 6(d)] from the underlying Fe2O3 grain indicates that the bicrystal structure does not occur in the grain, suggesting that the formation of bicrystal structure in the nanowire is not simply a replication of the grain structure, although the bicrystal boundary in the nanowire is started from the nanowire root and then continued into the nanowire along the length direction.
(a) Cross-sectional BF TEM image showing the interface region between the nanowire root and the underlying Fe2O3 grain; (b) HRTEM image from the region b marked in (a), inset is its Fourier transform pattern showing the zone axis of ; (c) HRTEM image from the region c of the nanowire and the corresponding Fourier transform pattern reveals the zone axis of ; (d) HRTEM image from the region d of the underlying Fe2O3 grain.

IV. DISCUSSION
Iron forms three thermodynamically stable oxides, FeO, Fe3O4, and Fe2O3. Fe can be oxidized at 600 °C to form Fe2O3/Fe3O4/FeO/Fe layered structure with FeO layer next to the metal substrate and Fe2O3 layer on the top.Reference Birks, Meier and Pettit49, Reference Young50 This behavior of oxide layering is consistent with our experimental observations. The oxide layering is governed by the Fe and oxygen gas equilibrium conditions, whereas the growth kinetics of the multiple oxide layers is controlled by outward diffusion of Fe cations driven by chemical potential due to the many orders of magnitude in oxygen gas pressure between Fe/FeO and Fe2O3/O2 interfaces. The oxide growth obeys a parabolic rate law, i.e.,  , where x is the oxide thickness, k the rate constant, and t the oxidation time.Reference Birks, Meier and Pettit49 Here, the rate constant k is

where  is the diffusion coefficient for metal cation vacancies,
 is the molar volume of the oxide, and
 and
 are the cation vacancy concentrations at the oxide–metal and oxide–gas interfaces, respectively.Reference Birks, Meier and Pettit49 The cation vacancy concentration is related to oxygen partial pressure by the equation

where n is a constant depending on the charge state of the cation vacancy.Reference Birks, Meier and Pettit49, Reference Young50 Therefore, the rate constant k is proportional to 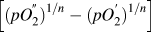 , where
 and
 are the oxygen gas pressure at the oxide–gas interface and metal–oxide interface, respectively.Reference Birks, Meier and Pettit49 Since
 is usually negligible compared with
 , the k is proportional to
 only. Accordingly, increasing the oxygen pressure leads to larger flux of Fe cations for enhanced oxide formation, whereas a lower oxygen gas pressure results in a reduced rate of oxide formation.
We have shown previously that the driving force leading to oxide nanowire formation is related to the interfacial stresses generated by volume change accompanying the solid–solid phase transformation between the different oxide layers.Reference Yuan, Wang, Mema and Zhou51, Reference Mema, Yuan, Du, Wang and Zhou52 Both the formation of nanowires and nanobelts on the Fe2O3 layer can be attributed to the relaxation of the compressive stresses generated by the volume shrinkage owning to the continuous Fe3O4 forming reaction at the Fe2O3/Fe3O4 during the oxidation of Fe. The negative stress gradient  from the Fe3O4/Fe2O3 interface to the free surface (i.e., Fe2O3/O2 interface) results in the flux of the outward grain boundary diffusion of Fe cations through the Fe2O3 layer by
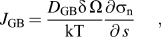
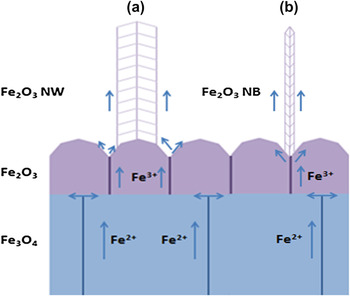
where D GB is the grain boundary (GB) diffusion coefficient, δ the GB width, k Boltzmann’s constant, T the absolute temperature, and s is the local spatial coordinate along the diffusion path. As discussed above, increasing the oxygen gas pressure leads to enhanced Fe3O4/Fe2O3 interfacial reaction and thereby resulting in a faster rate of the generation and accumulation of compressive stress at the Fe3O4/Fe2O3 interface. This increases the stress gradient for Fe outward diffusion and promotes the delivery of Fe cations onto the top of Fe2O3 grains via combined grain boundary followed by surface diffusion, where the surface of Fe2O3 grains serves as the structure template for the nucleation of Fe2O3 nanowires. Since grains typically show different surface facets, the crystals nucleated on the grain facets grow and merge at the grain top to form a bicrystal or a multicrystal. Such a process of the nanowire formation is schematically shown in Fig. 7(a). For the lower oxygen gas pressure, the oxidation rate is reduced and the stress generation at the Fe3O4/Fe2O3 interface is correspondingly slowed, resulting in a smaller stress gradient across the Fe2O3 layer. Therefore, Fe cations are delivered only onto the grain boundary region by grain boundary diffusion and deposit on the grain surfaces near the grain boundary nadir by reacting surrounding oxygen gas. The oxide nucleated on the surface of adjacent Fe2O3 grains grows and merges along the grain boundary to form a bicrystal, resulting in the morphology of nanobelts, which is correlated with the geometry of the grain boundary. The process of nanobelt formation is shown schematically in Fig. 7(b).
Mass transport mechanisms of iron ions for the growth of α-Fe2O2 nanowire (a) and nanobelt (b).

The mechanism discussed above explains the basis why the selective formation of Fe2O3 nanowires or nanobelts can be achieved via tuning the oxygen gas pressure during the oxidation; however, it is still a challenge to develop a quantitative model to predict the dependence of the percentage of nanowires or nanobelts on the oxygen gas pressure. This is largely due to the convolution of the aforementioned kinetic and thermodynamic processes involved in the oxide nanowire/nanobelt formation including the mass transport mechanisms, interfacial reactions during the layered oxide growth, and generation/relaxation of interfacial stresses. Developing an analytic model of the nanowire/ nanobelt formation relies on the validity of some basic assumptions linking the kinetic and thermodynamic parameters and the microstructure evolution of the oxide scales to the oxygen gas pressure, which are beyond the current reach of the theories for the oxidation of metals or crystal growth.
V. CONCLUSIONS
We have shown that the selective growth of α-Fe2O3 nanowires and nanobelts can be achieved by simply varying oxygen gas pressure during the thermal oxidation of Fe. It is found that nanowires form on the top of underlying Fe2O3 grains, whereas nanobelts originate from the grain boundary regions of Fe2O3 grains. Our results indicate that increasing the oxygen gas pressure promotes nanowire formation while suppressing nanobelt formation. These effects are attributed to the effect of oxygen pressure on the Fe3O4/Fe2O3 interfacial reaction rate and the resulting stress-driven diffusion of Fe cations, which leads to the different surface sites for the nucleation and growth of oxide nanowires and nanobelts on the underlying Fe2O3 layer.
ACKNOWLEDGMENT
The research was supported by the National Science Foundation under the Grant No. CMMI-0825737.