Introduction
Electrochromic materials have attracted many attentions due to their wide application in smart windows, reflective mirrors, and stealth clothing [Reference Wang, Wang, Xia, Yao, Zhong and Tu1, Reference Song, Jian, Ma and Jia2, Reference WU, Chang, Yang, Gung and Yang3]. Among them, inorganic electrochromic materials are widely used because of their fast response speed and high color contrast, but they are expensive and have poor stability of repeated circulation materials. By contrast, the conductive polymer (CP) matrix is an electromechanical chromogenic material with low price, higher optical contrast, fast switching speed, rich color, and good processing [Reference Honma, Takeda and Bae4, Reference Du, Shen, Yang, Donelson, Cai and Casey5]. Polyaniline (PANI) is a CP electrochromic material, and it has attracted considerable attention due to its convenient synthesis, controllable conductivity, high specific capacitance, unique color changing mechanism, and obvious color change [Reference Pahal, Deepa, Bhandari, Sood and Srivastava6, Reference Fei, Xu, Zhang, Jiang, Yan and Gu7, Reference Dinh, Oanh, Long, Bernard and Goffb8]. Numerous researchers have dedicated their efforts to prepare PANI and its composite with good electrochromic behaviors. Chu et al. [Reference Chu, Lu, Wu, Wang, Gong, Zhang and Xiong9] prepared PANI membrane on fluorine-doped tin oxide substrate by one-step hydrothermal polymerization method. The result reveals that the PANI membrane showing a good electrochromic performance can be used as electrochromic layer in an electrochromic device. Zhang et al. [Reference Zhang, Sun, He, Fu, Gu and Chen10] prepared rod-like PANI/nanocellulose composites with a core–shell structure by in situ polymerization. The result shows that the nanocomposites have superior membrane-forming properties, and the prepared nanocomposite membranes demonstrate excellent electrochemical and electrochromic properties in electrolyte solution, when compared with the pure PANI. Li et al. [Reference Li, Zhao, Ma and Zeng11] prepared PANI/carbon nanotube (PANI/CNT) composite membranes doped with dodecylbenzene sulfonic acid (DBSA) by cyclic voltammetry (CV) on an indium tin oxide (ITO)-coated glass substrate. The conductivity and crystallinity of PANI/CNT composites can be improved with the increasing CNT content, and the membrane shows better electrochromic behaviors due to the interaction between CNT and the PANI backbones.
However, as a widely used CP, PANI has disadvantages of low charge transfer ability and short duty cycle; this limits the application of PANI in fabricating electrochromic devices [Reference Jesús, Alberto, Eduardo, JoséM, Isabel, Humberto, Luis, Pedro and Miquel12, Reference Sheng, Bai, Sun, Li and Shi13, Reference Gordana14, Reference Baker, Huang, Nelson and Kaner15]. To solve this problem, the method that combining PANI and conductive nanometer materials is proposed, and it is useful for the fabrication of high conductive electrochromic textile products. In more recent years, graphene nanomaterials have attracted considerable attentions due to their characteristics, such as large specific surface area, excellent mechanical behavior, and flexible structure [Reference Lu, Dou, Yang, Hao, Zhang and Shen16, Reference Bhadra, Al-Thani, Madi and Al-Maadeed17, Reference Zhang, Park and Choi18]. Moreover, the graphene also has high transparency and thermal stability, especially good electron mobility; these provides the possibility to improve the voltammetric response of the polymer that combined with graphene [Reference Jia, Wang, Zhao, Xiao, Lu and Fan19, Reference Laith, Koo, Kourosh, Plessis, Han, Kojima, Kaner, Li, Gou, Ippolito and Wlodarski20].
In this study, PANI/reduced graphene oxide (PANI/RGO) solution was prepared by in situ polymerization method, and the PANI/RGO electrochromic membrane was prepared by spin coating method. The surface morphology, crystallization behavior, chemical structure, electrical conductivity, and electrochromic property of the PANI/RGO membrane are systematically investigated.
Results and discussion
Surface morphology
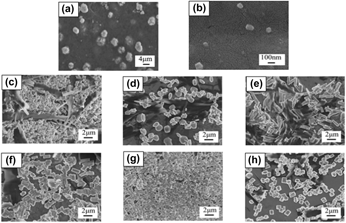
Scanning electron microscopy (SEM) images of PANI and PANI/RGO membranes are shown in Fig. 1. PANI in a particle form with a wide range of particle size (0.1–4 μm) was observed. The morphology of PANI was changed obviously after the addition of RGO. As shown in Figs. 1(c)–1(e), the microstructure of PANI is in a mixed form of slender rod-like and granular shape when the RGO concentration is at 0.1–0.2 wt%. The PANI changes to short rod-like shape as the RGO concentration further increased from 0.2 to 0.35 wt%. The different morphology of PANI can be ascribed to the chemical oxidation polymerization process of aniline when mixed with various RGO concentrations, resulting in two possible nucleation sites (bulky solution and solid substrate) for aniline, and these two sites would compete with each other in the reaction system. Aniline blending with a low RGO concentration cannot reach a supersaturation state and heterogeneous nucleation site can be generated on the RGO surface, while the homogeneous nucleation will take place on the RGO surface when the RGO concentration is high, then leading to a rod-like shape of PANI [Reference Yan, Kanaththage, Short, Gibson and Zou21, Reference Kai, Hou, Zaman, Bao and Duan22]. This result is similar to the earlier work by Balik et al. that polyoxymethylene can form a rod-like structure on the basal plane of graphite substrate with a certain degree [Reference Balik, Tripathy and Hopfinger23]. Cheng et al. also observed small rod-like crystals of polyethylene on the surface of RGO nanosheets [Reference Cheng, Chen, Hsuan and Christopher24].
SEM images of PANI at different magnifications: (a) 2000× and (b) 80,000×. PANI/RGO with different concentrations of RGO at 5000×: (c) 0.1 wt%, (d) 0.15 wt%, (e) 0.2 wt%, (f) 0.25 wt%, (g) 0.3 wt%, and (h) 0.35 wt%.

Crystallization behavior
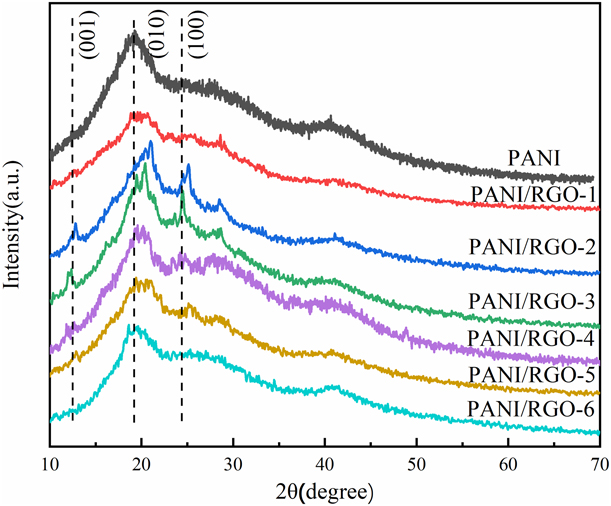
Figure 2 shows the X-ray diffraction (XRD) patterns of PANI and PANI/RGO membranes with various concentration of RGO. For pure PANI, the typical diffraction peaks at 19.95° and 24.9° correspond to the crystal faces of (010) and (100), respectively [Reference Rose, Guru Prasad, Sakthivel, Gunasekaran, Maiyalagan and Vijayakumar25]. For the PANI/RGO membranes, two additional diffraction peaks at 12.3° and 24.9° were observed when the RGO concentration is at 0.15–0.30 wt%. This result can be attributed to two reasons: one is that RGO can induce polymer crystallization when its concentration is low [Reference Cheng, Chen, Hsuan and Christopher24], and in this case, well crystallization of PANI can be formed; another is that the diffraction peak at 24.9° is attributed to the graph-like structure of RGO.
XRD patterns of PANI and PANI/RGO membranes.

Chemical structure
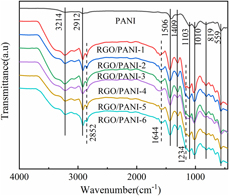
Fourier transform infrared (FTIR) spectra of PANI and PANI/RGO membranes are shown in Fig. 3. In the FTIR spectrum of PANI, the peak at 3214 cm−1 is assigned to N–H bond stretching vibration of the emeraldine base and O–H group of polyvinyl alcohol (PVA) [Reference Lee, Choi, Jeong, Rhyu, Chi and Yoon26]. The peak at 2912 cm−1 is designated as the stretching vibration of aromatic C–H group of PANI and aliphatic C–H group of PVA. In addition, the peaks at 1496 and 1409 cm−1 are the absorption of quinoid and benzene rings of PANI, respectively. The peaks at 1010 and 1103 cm−1 are the C–H bending of the quinoid ring and in-plane ring deformation C–H bending of the quinoid ring. The peaks at 559 and 819 cm−1 indicate the bending vibration absorption near the 1,4-substituted benzene C–H plane [Reference Yao, Xu, Wang, He and Wu27]. All the characteristic peaks of PANI were found in the FTIR spectra of PANI/RGO. The absorption peaks at 1010, 1409, and 1496 cm−1 of the stretching vibration of C–H, C–N, and C=C groups, respectively, were slightly changed after the addition of RGO, which is mainly due to the formation of hydrogen bonds between C–H and N–H [Reference Chen, Mao, Su and Fahn28]. Meanwhile, two extra peaks occurred at 1644 and 2852 cm−1 in the FTIR spectra of PANI/RGO due to the C=C skeletal vibration of the unoxidized graphitic domain [Reference Salimikia, Heydari and Yazdankhah29] and the C–H vibration-evapotranspiration, respectively [Reference Lu, Zhao, Xu, Qiu, Zhi and Shi30]. Based on these results, it can be confirmed that PANI was present in PANI/RGO and the PANI/RGO composites were successfully obtained.
FTIR spectra of PANI and PANI/RGO membranes.

Electrochemical properties
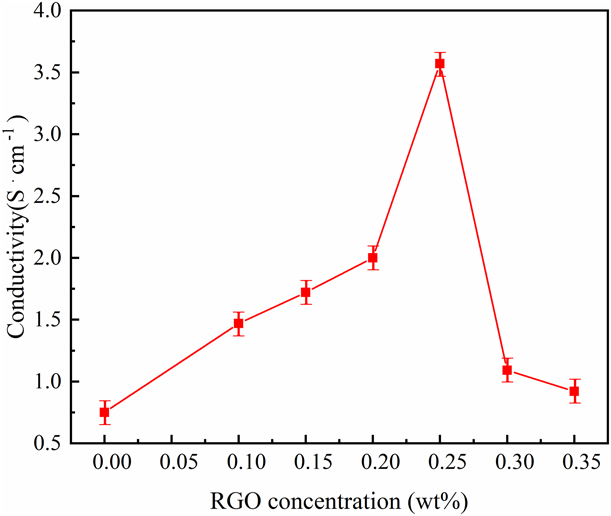
Figure 4 shows the electrical conductivity of PANI and PANI/RGO membranes with various RGO concentrations. Generally, RGO is a good electron acceptor, and it can serve as a conductive bridge in the composite to increase the charge transfer because of its large aspect ratio and surface area. As illustrated in the figure, the conductivity of PANI can be improved after the addition of RGO. The conductivity increased as the increasing RGO concentration from 0 to 0.25 wt% and then decreased as the RGO concentration further increased from 0.25 to 0.35 wt%. The improving electrical conductivity of PANI/RGO is due to the addition of RGO, and then, a complete conducting network can be formed to provide conductive paths and result in a high electrical conductivity. However, agglomeration of RGO would generate when its content is high and lead to a poor conducting network.
The conductivity of PANI and PANI/RGO membranes.

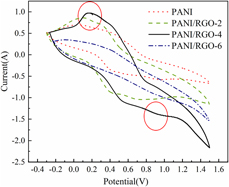
Figure 5 shows the CV curves of PANI and PANI/RGO membranes. The CV curve can demonstrate the dynamic electrochromic response process [Reference Tian, Zhang, Dou, Zhang, Zhang, Lv, Wang, Zhao and Li31, Reference Chotsuwan, Asawapirom, Shimoi, Akiyama, Ngamaroonchote, Jiemsakul and Jiramitmongkonal32]. All the samples show a typical CV curve with two characteristic peaks: one is at near 0.2 V and another is at near 0.9 V. The peaks indicate the change and conversion at the cyclic potential of green salt (LES), emeraldine salt (ES), and pernigraniline salt (PS). Compared with PANI, the redox peak of PANI/RGO and the current density increase significantly at 0.2 and 0.9 V nearly, which means that PANI/RGO membranes have higher electrical activity. Among them, the redox peak of PANI/RGO-4 is most obvious at 0.2 and 0.9 V and has highest electrical activity (as marked in Fig. 5). The redox peak intensity of PANI/RGO increases as the RGO concentration increased from 0.1 to 0.25 wt%, which can be represented by the increasing current density at 0.2 and 0.9 V. However, the redox peak intensity decreases as the RGO concentration further increased from 0.3 to 0.35 wt%. In the CV curves, the electron transition in the long chain of PANI can be found as the change of applied voltage when the absorption peak shifts to the long-wave direction and then migrates to the visible region of the spectrum. In this case, the color change circulates can be observed from pale yellow, yellow–green, green, to dark green. The CV curve results are consistent with the conductivity results in Fig. 4.
CV curves of PANI and PANI/RGO membranes.

Optical and electrochromic properties
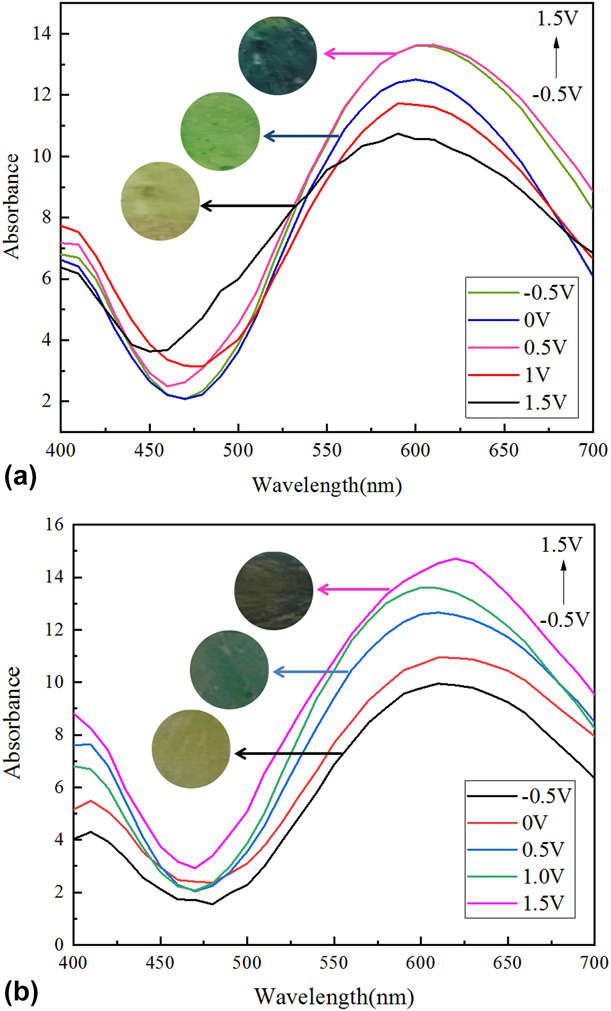
The electrochromic behavior of PANI and PANI/RGO-4 is determined by optically transparent thin electrodes. The absorption spectra of PANI and PANI/RGO-4 are shown in Fig. 6. In the figure, p–p transition of PANI/RGO can be found at 400 nm, revealed that the composite membrane has a strong absorption when voltage is between 0 and 1.0 V [Reference Kulesza, Miecznikowski, Chojak, Malik, Zamponi and Marassi33]. The absorption peak intensity is gradually decreased with the increase in wavelength, and the second strong absorption peak appears at 610 nm; this shows that the structure of PANI/RGO composite membrane is transformed into quinoid structure [Reference Firat and Peksoz34]. The absorption changes of the membranes observed at different potentials are reversible, and the color is also a reversible transformation from reduction to oxidation. As illustrated in Fig. 6, PANI and PANI/RGO show different absorption values, revealed that RGO plays an important role in controlling the absorption rate of the composite.
Electrochromic behavior from −0.5–1.5 V of (a) PANI and (b) PANI/RGO-4.

Summary
PANI/RGO composite membranes with different RGO concentrations were prepared by using in situ emulsion polymerization followed by spin coating method. PANI/RGO shows a more stable electrochromic characteristic and electrochemical cycle stability when compared with PANI, and a fast conversion between light green and black from −0.5 to 1.5 V was observed in PANI/RGO. Moreover, the PANI/RGO composite membrane shows a higher conductivity and electrochromic efficiency as well as electrochromic stability than the PANI due to the interaction between RGO and PANI backbones. The prepared PANI/RGO composite membranes can be used in the fabrication of flexible solid electrochromic devices.
Experimental
Materials
Aniline (≥99 wt%), ammonium persulfate [APS, (NH4)2S2O8, 98 wt%], DBSA (90 wt%), and hydrochloric acid (HCl, mass fraction: 36 wt%) were purchased from Sinopharm Chemical Reagent Co., Ltd. PVA (MW ∼ 1799 g/mol) and hydrazine hydrate (N2H4·H2O, mass fraction: 80 wt%) were purchased from Aladdin Reagent Co., Ltd., (China). Graphite oxide (GO, SE2430W, mass fraction: 42.78 wt%) was supplied by the Sixth Element (Changzhou) Materials Technology Co., Ltd.; 2.0 × 2.0 cm transparent ITO glass with a resistivity of 6–8 Ω/sq used as a substrate was provided by Foshan Meijingyuan Glass Technology Co., Ltd., (China). Deionized water was used throughout the experiment. All chemicals were analytical reagents and used as received unless otherwise specified.
Reduction of graphene oxide
0.1 g GO was dissolved in a mixture of 1 mL N2H4·H2O and 100 mL deionized water with constant sonication for 1 h to get a yellow–brown solution and then kept the solution in a water bath at 90 °C for 1 h. The RGO particles can be obtained after centrifugal treatment on the above solution, followed by washing with deionized water and then washing with ethanol, and drying in an oven at 100 °C for 12 h.
Preparation of PANI and PANI/RGO emulsions
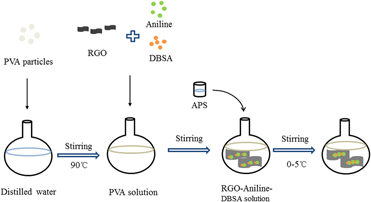
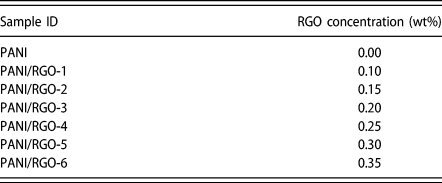
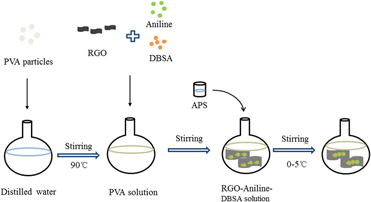
The preparation of PANI and PANI/RGO emulsions is illustrated in Fig. 7. PVA particles were dispersed in 30 mL deionized water and ultrasonic stirred at 90 °C until dissolved completely. After cooling to room temperature, RGO with different concentrations (Table I) was added into the above solution and treated by a high-speed shearing for 30 min. The obtained dispersion was then mixed with DBSA at 0 °C in an ice water bath and stirred at 1500 rmp/min. The solution changed into milky white floc as the stirring speed increased to 2000 rmp/min. APS solution (10 mL) preparing by dissolving the oxidant APS into deionized water was added into the white emulsion at a rate of 6 drops/5 min, followed by stirring for 6 h to obtain a dark green solution.
Schematic illustration of the preparation of PANI/RGO emulsion.

Samples with various RGO concentrations.

Preparation of PANI and PANI/RGO membranes
The composite membrane was prepared by using spin coating method (KW-4A sizing machine). The quantity of the emulsion was controlled by a pipette and titrated to a substrate on the suction cup. The membranes were obtained after the emulsion was slowly spread with a low-speed rotation of 600 rmp/min for 15 s and then spun at a high speed of 2000 rmp/min for 1 s. Then the membranes were dried in oven at 80 °C for 4 h.
Characterization
SEM images were obtained on a scanning electron microscope (SEM; JEOL JSM-840, Japan). FTIR spectra were recorded on an FTIR (FTIR; Spectrum Two). XRD patterns were obtained on a D2 PHASER X-ray diffractometer (Bruker AXS, Germany). Electrochemical measurements were performed in 1 mol/L HCl solution. Electrochemical measurements were obtained on a CHI660E electrochemical work station (CHI, Shanghai, China), which was three-electrode cell with the composite membranes as the work electrode, a calomel electrode as the reference electrode, and a platinum plate as the counter electrode in 1.0 mol/L HCl electrolyte. CV measurements were performed on the PANI/RGO membrane using an ITO glass as a substrate, and the data were recorded at a potential ranging from −0.5 to +1.5 V, with a scanning rate of 50 mV/s. Visible absorption spectra were recorded by an X-rite SP60 [X-Rite (Shanghai) Color Technology Co., Ltd., China]. Electrical conductivity of the samples was measured using a four-point probe system with a linear probe head (SZT-2C). The measurements of each sample were conducted for five times on both the vertical and horizontal directions of the samples, and the average was used for evaluation.
Acknowledgment
The authors gratefully acknowledge the financial support by Preparation and Properties of High Conductivity Flexible Graphene Composite Fabrics (Grant No. CS1809004); Research Initiation Funds of Shanghai University of Engineering Science (Grant No. 2016-27); Shanghai University of Engineering and Technology City-level University Students Research Innovation Training Program (Grant No. cs1809004); Training Scheme of Young Teachers in Shanghai Universities (Grant No. ZZGCD16028); and 2017 Talents Action Program of Shanghai University of Engineering Science (Grant No. 2017RC432017).