INTRODUCTION
Pacific salmon (most Oncorhynchus sp.), being anadromous and semelparous, provide a large transfer of nutrients from the marine environment to freshwater and terrestrial environments (Bilby et al., Reference Bilby, Fransen and Bisson1996; Schindler et al., Reference Schindler, Scheuerell, Moore, Gende, Francis and Palen2003). Marine-derived nutrients (MDN) provide important subsidies to aquatic and riparian ecosystems (Schindler and Smits, Reference Schindler and Smits2017), and their long-term influence on such ecosystems is poorly understood. Paleolimnological biogeochemical methods may potentially reconstruct the abundance of anadromous fish over millennia (Gregory-Eaves et al., Reference Gregory-Eaves, Smol, Douglas and Finney2003). Such studies may help distinguish the environmental factors that influence salmon abundance over time (Finney et al., Reference Finney, Gregory-Eaves, Sweetman, Douglas and Smol2000; Gregory-Eaves et al., Reference Gregory-Eaves, Selbie, Sweetman, Finney and Smol2009). For example, several reconstructions of sockeye salmon (O. nerka) abundance have been developed by analyzing the isotopic signature of nitrogen in conjunction with other sediment characteristics from nursery lakes in Alaska (Finney et al., Reference Finney, Gregory-Eaves, Douglas and Smol2002; Gregory-Eaves et al., Reference Gregory-Eaves, Smol, Douglas and Finney2003; Rogers et al., Reference Rogers, Schindler, Lisi, Holtgrieve, Leavitt, Bunting and Finney2013), showing the importance of climatic controls of marine productivity on salmon abundance. South of Alaska, however, studies have identified that paleolimnological reconstructions of anadromous salmon are hindered by high flushing rates, high nutrient contributions from the terrestrial environment, and low salmon-densities relative to Alaskan lakes (Hobbs and Wolfe, Reference Hobbs and Wolfe2007; Selbie et al., Reference Selbie, Finney, Barto, Bunting, Chen, Leavitt, MacIsaac, Schindler, Shapley and Gregory-Eavesa2009).
Paleolimnological approaches to salmon reconstruction have not yet been attempted in watersheds with dominant species other than sockeye salmon, such as coho salmon (O. kisutch). However, the historical declines of salmon have been most prominent at the southern range of sockeye salmon and for species occurring south of the sockeye salmon range (Lichatowich, Reference Lichatowich2001; Schindler et al., Reference Schindler, Scheuerell, Moore, Gende, Francis and Palen2003; Selbie et al., Reference Selbie, Lewis, Smol and Finney2007). We speculate that environmental setting, rather than the species per se, may be more important for the success of a paleolimnological approach to salmon population reconstruction. Although some behaviors and habitat preferences are different (e.g., the use of nursery lakes), all anadromous salmon species gain >95% of their biomass in the ocean (Brock et al., Reference Brock, Leavitt, Schindler and Quay2007) and therefore should contribute measurable isotopic signatures to lake sediments if environmental conditions are suitable. Reconstructions are likely possible if MDN from spawning salmon comprise a significant portion of the nutrient budget (affecting nitrogen stable isotopes) and hydrologic retention rates are high (>1 yr, allowing for nutrients to persist through the growing season; Holtham et al., Reference Holtham, Gregory-Eaves, Pellatt, Selbie, Stewart, Finney and Smol2004).
Our understanding of long-term salmon population dynamics in the Oregon Coast Range (OCR) has been limited to ethnographies and historical archives (e.g., cannery and escapement records; Lichatowich, Reference Lichatowich2001; Meengs and Lackey, Reference Meengs and Lackey2005). Reliable harvest records of coho salmon in Oregon, which only extend back to AD 1923, reflect a large range of annual catches (ca. 150,000–4,000,000; Lichatowich, Reference Lichatowich2001). A 250-yr dendrochronology reconstruction of Chinook salmon (O. tschwatcha) from the Umpqua River showed decadal-scale fluctuations in salmon returns, including some earlier periods with potentially more than an order of magnitude greater return than those of the last century (Drake and Naiman, Reference Drake and Naiman2007). The general lack of data provides little context for the variability in salmon abundance prior to widespread anthropogenic impacts. Since the early twentieth century, salmon have declined dramatically, resulting in numerous laws and policies to protect existing populations and to restore degraded salmon habitat (Lawson, Reference Lawson1993; Schindler et al., Reference Schindler, Augerot, Fleishman, Mantua, Riddell, Ruckelshaus, Seeb and Webster2008).
In addition to habitat loss and exploitation, climate has been identified as an important control on salmon abundance (e.g., Mantua et al., Reference Mantua, Hare, Zhang, Wallace and Francis1997; Schindler et al., Reference Schindler, Scheuerell, Moore, Gende, Francis and Palen2003). In particular, decadal-scale modes of variability of sea-surface temperatures (SST) in the northern Pacific (i.e., the Pacific Decadal Oscillation) are manifested as major changes in salmon abundance (Mantua et al., Reference Mantua, Hare, Zhang, Wallace and Francis1997; Drake and Naiman, Reference Drake and Naiman2007). When the Aleutian Low is strong, SSTs tend to be relatively warm, upwelling is reduced, and stratification of coastal waters is more pronounced (Mueter et al., Reference Mueter, Peterman and Pyper2002). In the southern Pacific Northwest (PNW), these conditions lead to reduced coastal nutrient availability and primary productivity, thus reducing forage for salmon. Conversely, in the Gulf of Alaska, these conditions lead to increased coastal nutrient flux and stratification, which in this region increases primary productivity and, thereby, forage for salmon (Beamish and Bouillon, Reference Beamish and Bouillon1993; Finney et al., Reference Finney, Gregory-Eaves, Sweetman, Douglas and Smol2000). Whether such variability is strongest on interannual, decadal, centennial, or longer time scales remains unknown, though the long-term perspective over the last ca. 2200 yr suggests strong variability over both multi-decadal and multi-centennial timescales (Finney et al., Reference Finney, Gregory-Eaves, Douglas and Smol2002).
This study is the first to attempt to reconstruct salmon abundance in the Oregon Coast Range (OCR) using paleolimnological methods. Few lakes in the OCR are suitable for paleolimnological salmon reconstruction due to the region’s high precipitation (ca. 200 cm/yr), low lake-water retention rates, and high inputs of terrestrial organic matter to lake sediments. We carefully selected sites to help overcome these issues. We compare sediment records of stable isotopes (δ15N and δ13C), inorganic and organic content (magnetic susceptibility, C:N, LOI, and biogenic silica), and pollen at two lakes: one downstream of coho salmon spawning grounds and, as a control, one upstream of a natural barrier to fish migration. We compare these records to existing Pacific SST reconstructions to assess centennial-to-millennial-scale climatic controls of salmon abundance in the OCR.
STUDY SITES
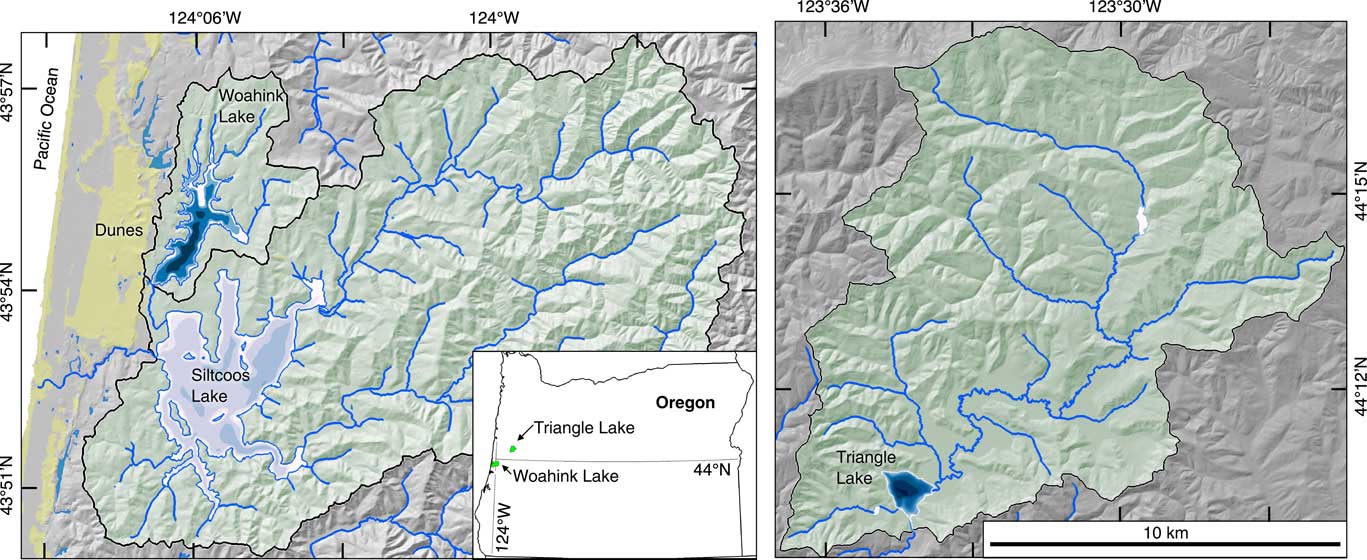
The study site with salmon, Woahink Lake (43°54'33''N, 124°06'10“W; 13 m asl), is an oligotrophic and over-deepened (22.8 m) dune-barrage lake with a dendritic shape, in close proximity to the ocean (ca. 3.2 km, Fig. 1). It is one of the few lakes in the OCR that has a long water retention time (ca. 1.4 yr) due to its large size (302 ha) and volume (3.29×10⁷ m3) and relatively small watershed (1798 ha). The lake is monomictic, with thermal stratification during the summer and mixing during the winter, which may increase biological recycling of nutrients (Johnson, Reference Johnson1985; Pfauth and Sytsma, Reference Pfauth and Sytsma2004). Woahink Lake contains three tributaries that are used by salmon for spawning and rearing. The most common tree species in the watershed are Sitka spruce (Picea sitchensis), red alder (Alnus rubra), western hemlock (Tsuga heterophylla), western redcedar (Thuja plicata), Douglas fir (Pseudotsuga menziesii), and shore pine (Pinus contorta var. contorta).
(color online) Woahink Lake (left) and Triangle Lake (right) and their drainage basins. Maps are at the same scale. Inset map shows locations of the basins in Oregon. The map for Woahink Lake shows the larger associated Siltcoos Lake watershed downstream of Woahink Lake and the location of Holocene dune sheets. The streams mapped in the Woahink and Siltcoos watersheds are classified as coho spawning and rearing habitat (StreamNet Project, 2012). Enlargements of bathymetric maps and coring locations are in the Supplementary Materials.
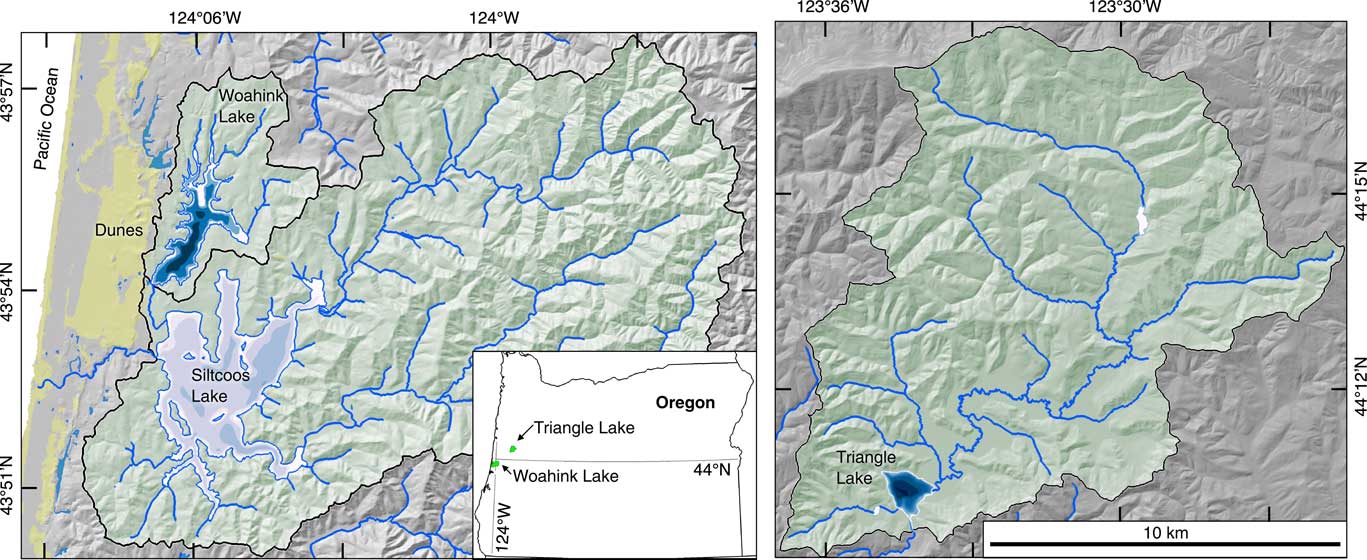
Escapement records are available from Siltcoos Lake, through which salmon must currently pass to access the spawning grounds upstream from Woahink Lake (Fig. 1). Historical coho salmon counts ranged from 555 to 10,212 spawners per year between AD 1960 and 2010 (Buckman, R., personal communication, 2011). The Woahink Lake catchment contains only 7% of the 108 km of upstream spawning and rearing habitat of Siltcoos Lake (Fig. 1). Low densities of salmon can result in low contributions of MDN to nutrient budgets, which is problematic for paleolimnological reconstructions because low MDN levels make it difficult to distinguish signal from noise. However, post-1960 escapement records almost certainly do not represent earlier abundance. Cannery and escapement records (since AD 1860 and AD 1960, respectively) indicate that salmon abundance in the OCR peaked in 1911, and has declined drastically since then (Lichatowich, 2001). Salmon abundance at Woahink Lake is also thought to have declined significantly prior to escapement records due to the introduction of the warm-water game species largemouth bass (Micropterus salmoides), bluegill (Lepomis macrochirus), and yellow perch (Perca flavescens) at ca. AD 1930 (Buckman, R., personal communication, 2011).
The control site, Triangle Lake (44°10'19''N, 123°34'20''W; 212 m asl) is a meso-to-oligotrophic deep (29 m) lake located 50 km from Woahink Lake, and 44 km from the Pacific Ocean (Fig. 1). It was formed by a landslide ca. 44 cal ka BP on Lake Creek in the Siuslaw River watershed (Marshall et al., Reference Marshall, Roering, Gavin and Granger2017). The water retention time of Triangle Lake (1 month) is shorter than that of Woahink Lake (Johnson, Reference Johnson1985). Triangle Lake is likely monomictic, though lake survey data are sparse. Triangle Lake was inaccessible to salmon until a fish ladder was constructed ca. AD 1990, and the lake has intermittently been stocked with salmon and steelhead since ca. AD 1960 (Buckman, R., personal communication, 2011). Modern forests are primarily composed of western hemlock, Douglas fir, red alder, and western redcedar. Multi-millennial reconstructions of forest and fire history have been developed from Little Lake, located ca. 0.4 km west of Triangle Lake (Worona and Whitlock, Reference Worona and Whitlock1995; Long et al., Reference Long, Whitlock, Bartlein and Millspaugh1998, Reference Long, Whitlock and Bartlein2007).
METHODS
Sediment cores were collected from near the deepest locations in both lakes in 2010. Surface cores (<1 m) were recovered from both lakes using a clear acrylic tube attached to drive rods and fitted with a piston. Long cores were collected using a modified Livingstone piston corer guided by rigid steel casing between the raft platform and the sediment surface. A single core was collected from the deepest location (22.5 m) at Woahink Lake, and two cores with overlapping drives were collected from a broad level area (24.7 m depth) at Triangle Lake. The Livingstone cores were extruded in the field, wrapped in plastic wrap, and stored in PVC piping. Short-cores were subsampled at 1-cm intervals at the University of Oregon and stored in polyacrylic vials. Aside from transport, the cores were stored at 4°C at the University of Oregon.
Initial Core Description (ICD) began at the University of Minnesota Limnological Research Center (LacCore). The cores were split and photographed using a high-resolution line-scan camera. Lithologic and biogenic components were identified using smear-slides and scanning electron microscopy (SEM) and described following Schnurrenberger et al. (Reference Schnurrenberger, Russell and Kelts2003). SEM confirmed the presence of vivianite, and contiguous 1 cm3 samples were visually inspected for its presence for Woahink Lake and at ca. 5-cm intervals for Triangle Lake. Magnetic susceptibility (MS) on the Livingstone cores was measured every 0.5 cm using a Bartington MS2E core logging sensor and on the surface cores using a Sapphire Instruments cup meter. MS data were correlated between the surface core and Livingstone core to ensure a gapless transition between the cores. At the University of Oregon, loss-on-ignition (LOI) at 550°C and bulk density (BD) were measured every 1–5 cm on 1 cm3 subsamples (Heiri et al., Reference Heiri, Lotter and Lemcke2001), totaling 438 and 195 subsamples at Woahink and Triangle lakes, respectively.
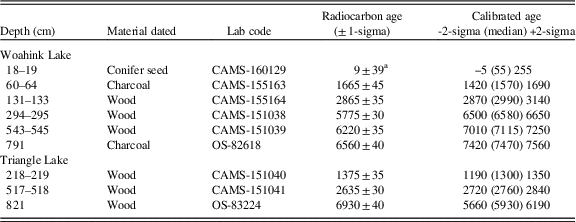
Radiocarbon dates on identifiable plant macrofossils or charcoal were obtained from Woahink (n=6) and Triangle lakes (n=3). An age-depth relationship at each lake was constructed by fitting a curve to calibrated radiocarbon dates using the program CLAM (Blaauw, Reference Blaauw2010) that was modified to use a constrained spline that increases age monotonically with depth. Radiocarbon age calibration was based on the INTCAL13 calibration curve (Reimer et al., Reference Reimer, Bard, Bayliss, Beck, Blackwell, Ramsey and Buck2013).
To assess changes in primary productivity at Woahink Lake, the percent dry weight of amorphous silica, or biogenic silica (BSi), was measured every <10 cm using a modified wet-alkaline extraction method (Mortlock and Froelich, Reference Mortlock and Froelich1989). Each sample consisted of approximately 60 mg of freeze-dried sediment that was digested in a 10% Na2CO3 solution while heated in a water bath at 80°C. Due to the high silt and clay content of the sediment, which may contribute to the measured silica concentration, aliquots were collected at 200, 300, 400, and 500 minutes for the first several batches. Silica concentrations were measured using a molybdate blue reaction followed by an absorbance reading in a GENESYS 8 spectrophotometer. A time-series correction was used to account for the dissolution of mineral silica in the timed extractions (Mortlock and Froelich, Reference Mortlock and Froelich1989).
Stable isotopes, organic carbon and total nitrogen were measured at <5 cm intervals, totaling 156 and 177 subsamples at Woahink and Triangle lakes, respectively. Bulk sediment subsamples were freeze-dried, homogenized, and measured for %C, %N, δ13C, and δ15N using a Costech Elemental Analyzer coupled to a Thermo Delta isotope-ratio mass spectrometer at the Idaho State University Stable Isotope Laboratory. Twenty-eight additional samples from the Woahink surface core were measured at the University of Illinois to increase sampling resolution of the most recent sediment. Bulk samples were used as the focus of this study is on nitrogen, and no carbonates were detected in either lake using the LOI method. Nitrogen and carbon isotopes are reported in standard delta notation relative to atmospheric N2 or Vienna PeeDee Belemnite (VPDB), respectively. Analytical precision was under 0.2‰ and replicate samples were within 0.3‰ within and between laboratories.
Pollen analysis was performed at <10-cm intervals on the Woahink Lake core (increments of <300 yr). Samples were processed according to standard methods, mounted on slides in silicon oil, and scanned at a magnification power of 400× (Faegri and Iversen, Reference Faegri and Iversen2000). A minimum of 350 grains was identified to the lowest taxonomic unit possible. Based on the modern presence of these species, Alnus is attributed to A. rubra, Picea is attributed to P. sitchensis, Pinus is attributed to P. contorta var. contorta, and Pseudotsuga-type pollen is attributed to P. menziesii.
A nitrogen mass balance mixing model was developed to estimate the number of salmon required to produce a given value of δ15N of dissolved inorganic nitrogen (DIN) in Woahink Lake, which subsequently is transferred to the sedimentary record via assimilation by phytoplankton. The δ15N of lake-water DIN should be a major control of lake-sediment δ15N assuming the organic component of the sediment is mainly composed of aquatic biomass, though algal discrimination against the heavy isotope may further alter the relationship between salmon and 15N (Brahney et al., Reference Brahney, Bos, Pellatt, Edwards and Routledge2006). The presence of red alder, a species that has a symbiotic relationship with N-fixing bacteria, can greatly increase soil N and DIN concentration in stream water (Scott et al., Reference Scott, Perakis and Hibbs2008). As a result, the measured δ15N record may affected by the amount of isotopically light N (close to 0‰) fixed by symbionts (Perakis et al., Reference Perakis, Sinkhorn and Compton2011). Thus, the concentration of stream-water DIN and its isotopic composition are affected greatly by red alder cover (Compton et al., Reference Compton, Church, Larned and Hogsett2003). In our mixing model, we used three levels of stream-water DIN (20, 50 and 120 μg/L) typical of this region that correspond to alder cover ranging from 0 to ca. 30% (Compton et al., Reference Compton, Church, Larned and Hogsett2003). These values bracket the observed lake-water DIN measurement of 114 μg/L, which was >99% NO3 - (a measurement that would have included MDN; Vaga et al., Reference Vaga, Peterson and Herlihy2005). Annual terrestrial DIN input to the lake was calculated from stream discharge, which was in turn estimated from mean precipitation (1.76 m/yr, measured at adjacent Honeyman State Park; http://wrcc.dri.edu) minus evapotranspiration (0.5 m/yr, estimated via the Thornthwaite method; Willmott et al., Reference Willmott, Rowe and Mintz1985), over the watershed not including the lake surface (16% of the watershed). The δ15N of terrestrial DIN was assigned to the mean value of Triangle Lake sediments (2‰) where there was no MDN contribution, and is similar to soil organic matter components measured at various locations in the central Oregon Coast Range (which are always less than 3.75‰ and average 2.2‰; Scott et al., Reference Scott, Perakis and Hibbs2008). Annual MDN was estimated assuming adult coho salmon mass of 4.5 kg that is composed of 3% N with a δ15N of 13.5‰ (Bilby et al., Reference Bilby, Fransen and Bisson1996; Johnson and Schindler, Reference Johnson and Schindler2009). We then computed the expected lake-water δ15NO3 - as the mass mixture of terrestrial DIN and salmon spawners.
Correlation between the isotope data and potential correlates of isotopic ratios (i.e., alder pollen, BSi, and independent climate proxies) were calculated. The isotopic values were first interpolated to sample ages of the more sparsely sampled comparison data. Then we assessed significance of the correlation coefficient using a moving block bootstrap (1000 randomizations) to account for autocorrelation in the time series (Efron and Tibshirani, Reference Efron and Tibshirani1993).
RESULTS
Woahink Lake sediment properties
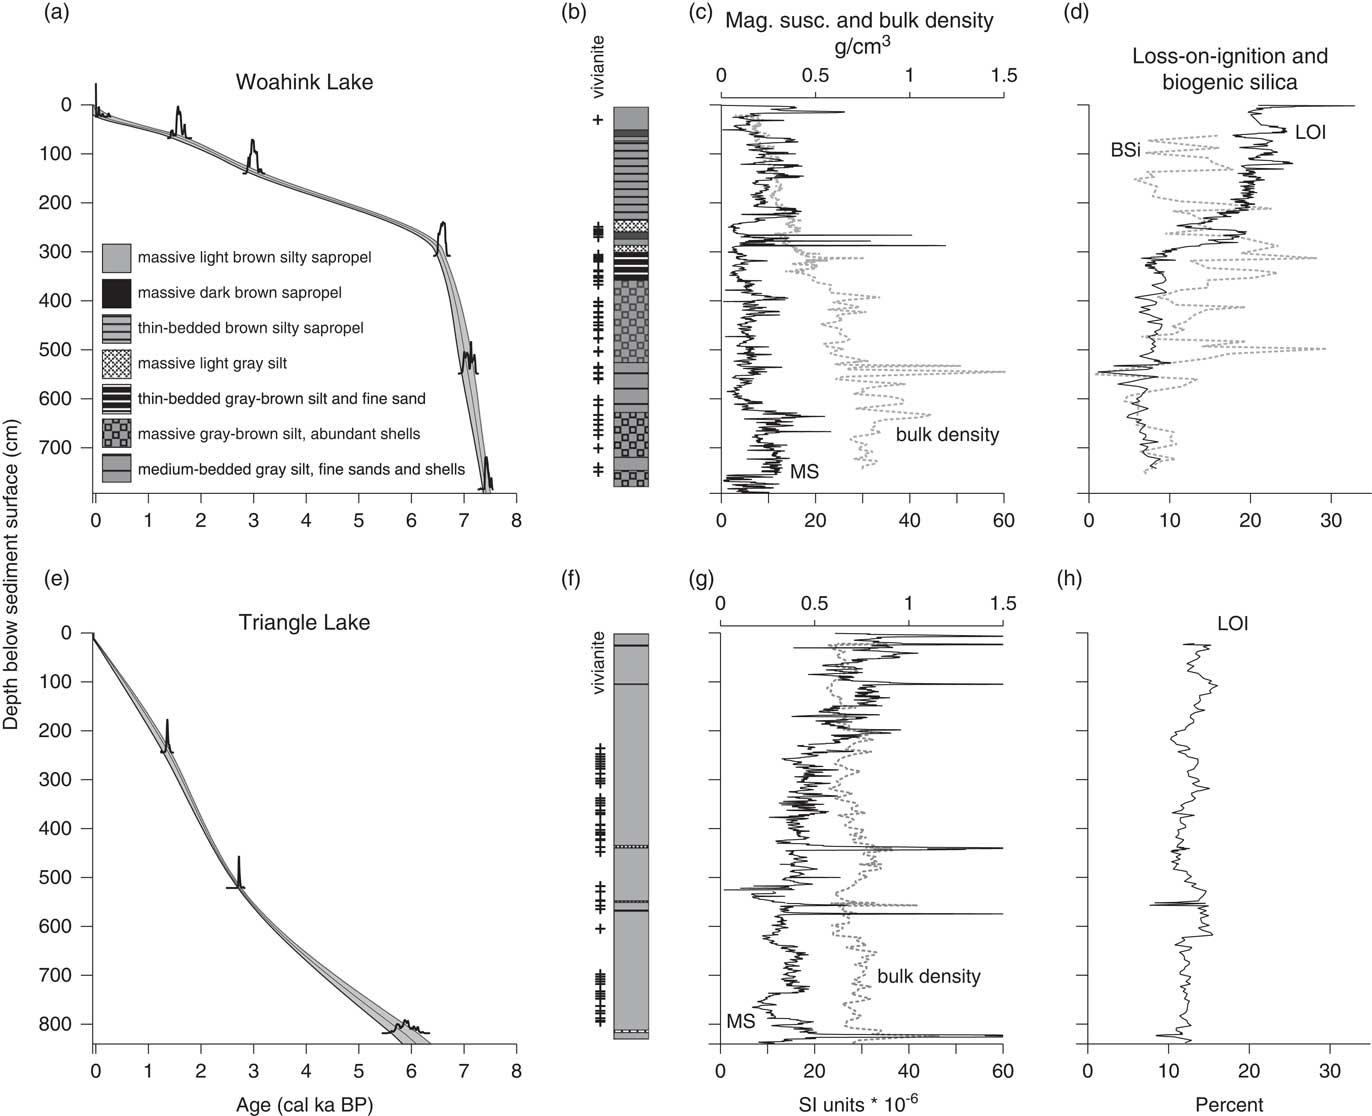
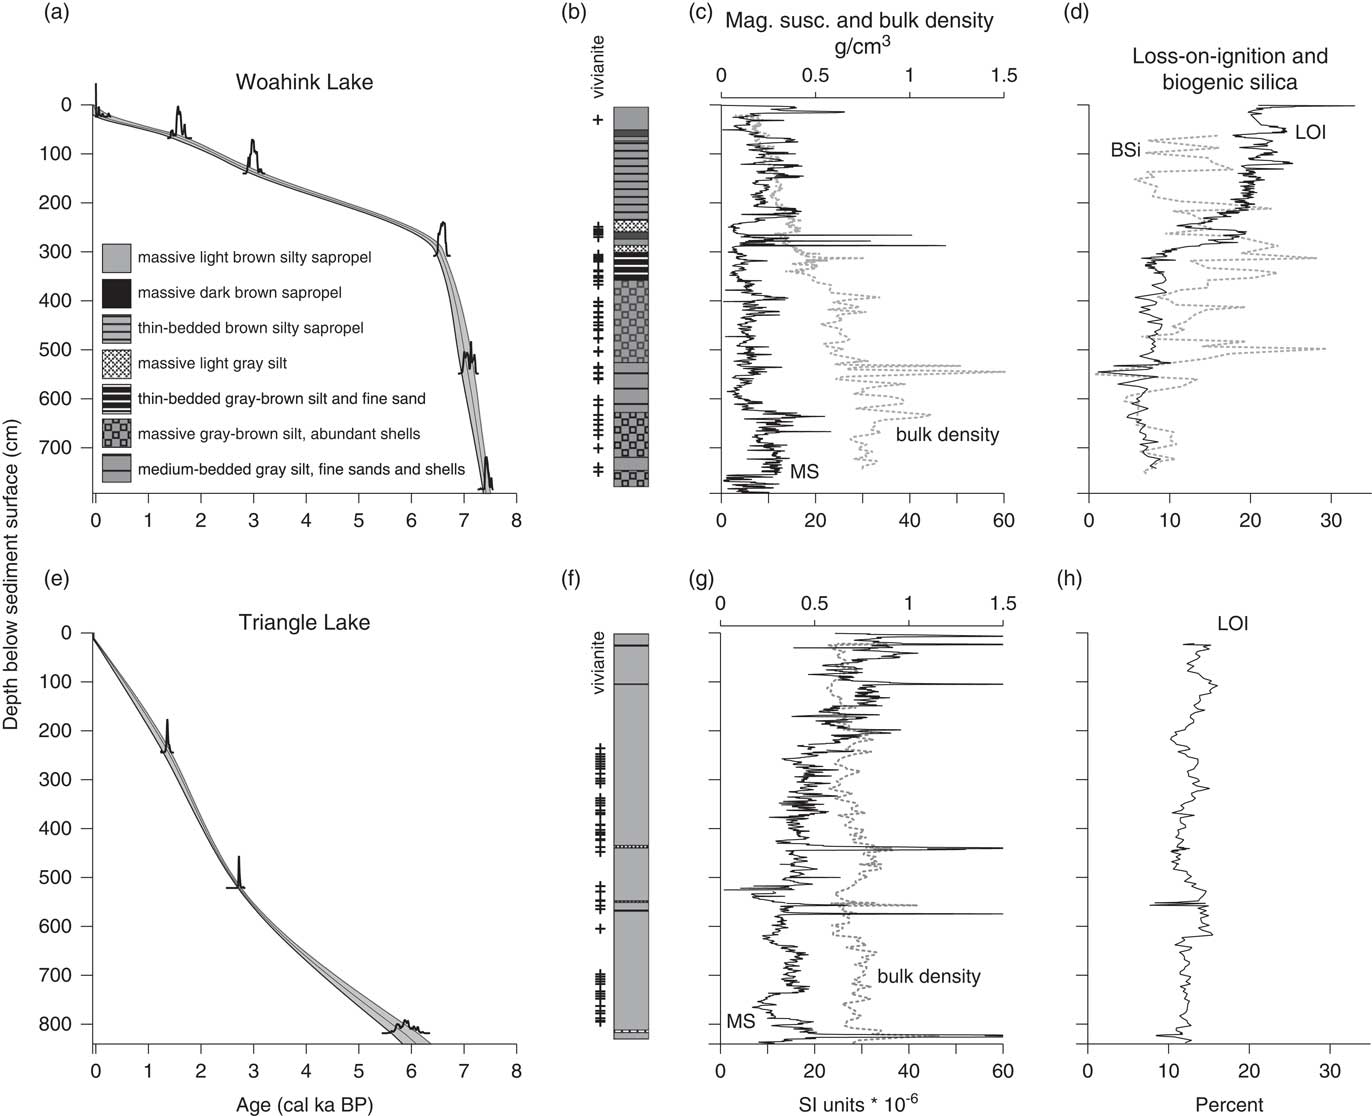
We recovered 790 cm of sediment before reaching an impenetrable layer, which was dated by a basal radiocarbon age to 7.45 cal ka BP (Table 1). From 790 to 304 cm (to 6.6 cal ka BP) the sedimentation rate is quite high (0.56 cm/yr; Fig. 2). The sediment during this period is composed of massive and bedded gray silt with occasional beds >1 cm thick of fine sands and marine shells; visible shells persist up to 362 cm (6.8 cal ka BP); and vivianite is common up to 304 cm. In the lowest 2 m of core, MS is marked by distinct peaks, BD is high (0.8 g/cm3), and LOI is low (<8%). From 362 to 304 cm, BD declines, MS is lower and less variable, LOI increases slightly, and BSi peaks above 30%. From 304 to 289 cm (6.6 cal ka BP), a light gray silt layer is followed by a series of three large MS peaks within a silty and dark brown sapropel. LOI increases to 20% by 250 cm (6.0 cal ka BP). Another 24 cm of light gray silt is marked by a lower LOI (to 10%), which returns at 237 cm (5.7 cal ka BP) to thinly bedded light brown sapropel, with MS varying slowly on a centennial time scale, higher LOI (>20%), and a slow sedimentation rate (0.04 cm/yr) for the remainder of the core.
(a) Age-depth relationship at Woahink Lake. Each radiocarbon date is shown as a probability distribution of the calibrated age. (b) Depths at which vivianite was observed, and the lithology of the sediment core. (c) Magnetic susceptibility and bulk density of the sediments. (d) Biogenic silica (BSi) and loss-on-ignition (LOI; 550°C). (e–h) Data presented for Triangle Lake as for Woahink Lake, though BSi was not measured at Triangle Lake. See Table 1 for details regarding radiocarbon dates.
Accelerator Mass Spectrometry (AMS) radiocarbon dates and calibrated ages (Reimer et al., Reference Reimer, Bard, Bayliss, Beck, Blackwell, Ramsey and Buck2013). Lab codes refer to the Center for Accelerator Mass Spectrometry, Lawrence Livermore National Laboratory (CAMS), or Woods Hole Oceanographic Institute (OS).
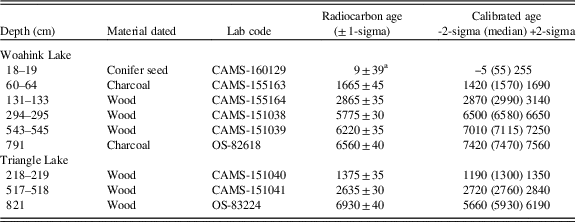
a Age reported as 0.9989 ± 0.0049 fraction modern.
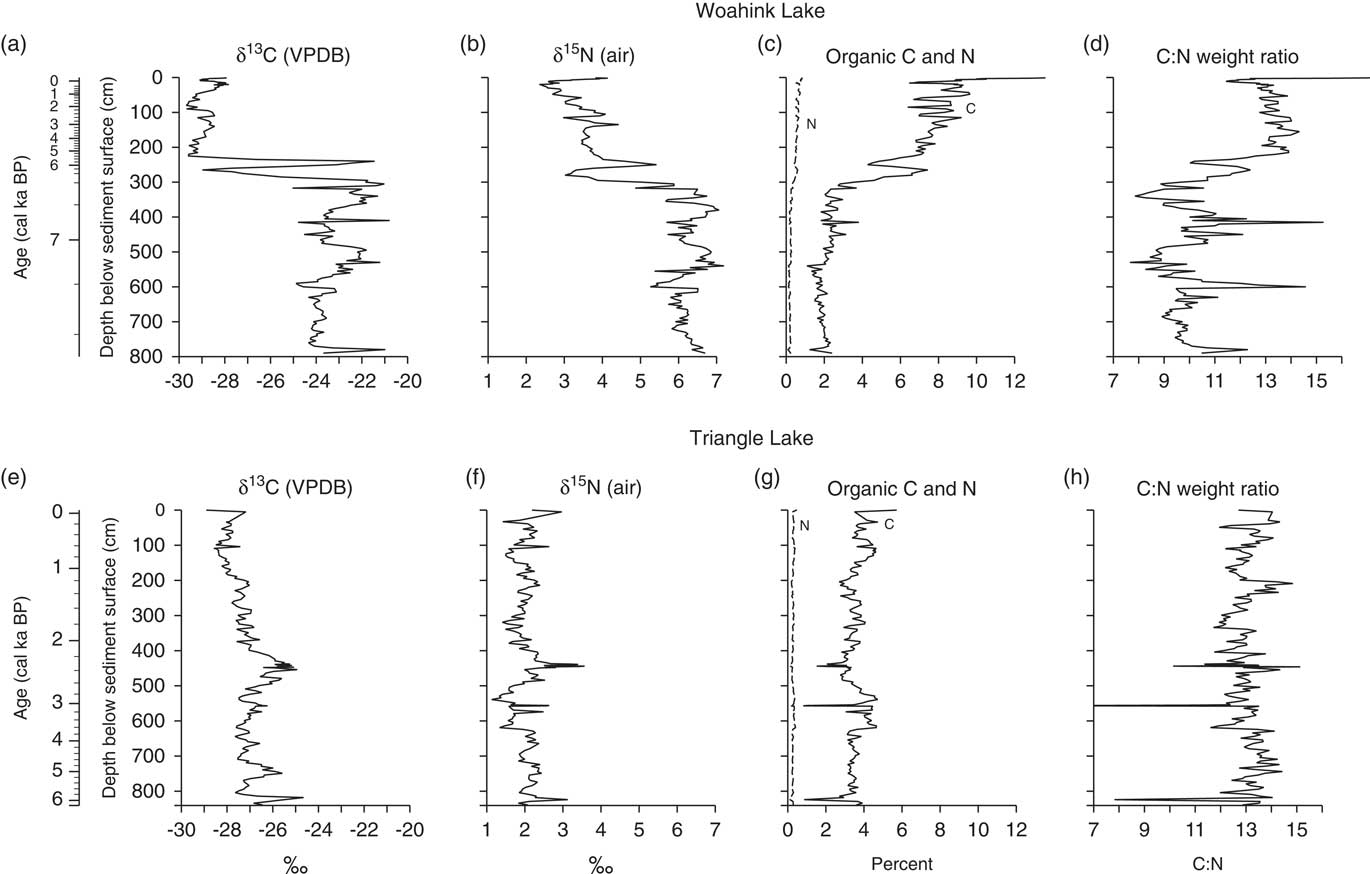
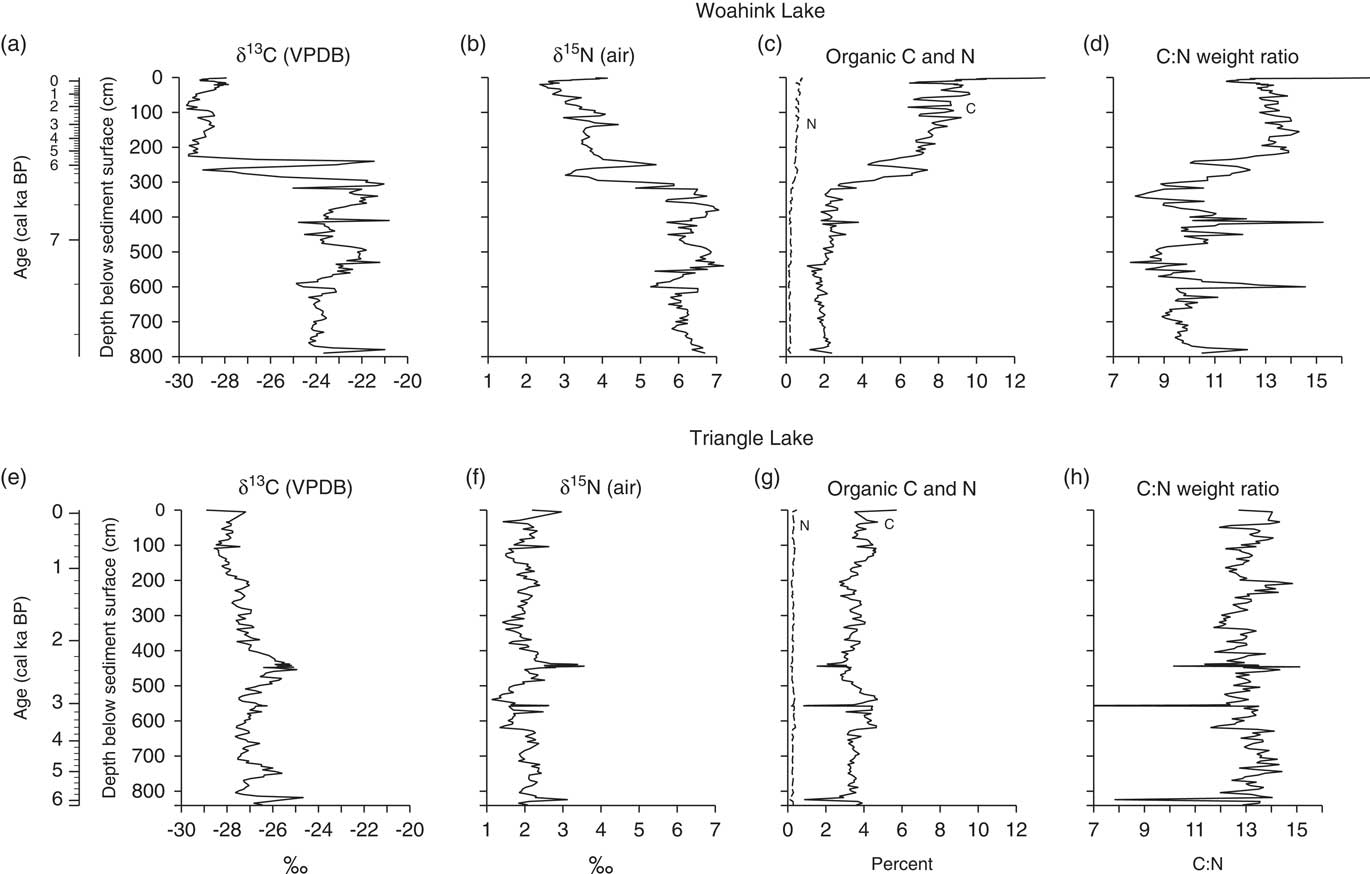
Organic matter characteristics and stable isotopes vary dramatically at Woahink Lake (Fig. 3). Below 304 cm (7.45 to 6.6 cal ka BP), δ13C varies from −21 to −25‰ with several rapid changes but no long-term trend. Similarly, δ15N varies between 5.5 and 7‰. Organic C remains at ca. 2%, while N is very low, resulting in an erratic C:N ratio that is mainly below 11. These low C:N ratios suggest that sampling in this interval did not include appreciable carbonates. If carbonates were present, we would expect a positive correlation between δ13C and C:N. We conclude that carbonates did not significantly affect the organic signatures, and that the relatively heavy δ13C in this interval is consistent with organic matter of marine origin (e.g., Lozhkin et al., Reference Lozhkin, Minyuk, Cherepanova, Anderson and Finney2017). At 304–289 cm (6.6 cal ka BP), within a light gray silt layer, δ13C drops rapidly to −28‰, δ15N drops to 3‰, and organic C increases to 8% with an increase in C:N to 13. These values remain similar within an organic sapropel for ca. 20 cm. Within a second light gray silt (261–237 cm; 6.2–5.7 cal ka BP), the values return to close to the same values from the lower half of the core. Above 237 cm, at a sharp transition to thin-bedded sapropel, δ13C drops from −21 to −29‰, δ15N drops from 5.5 to 3.9‰, organic C increases to 8%, and C:N reaches a high of near 14. This transition is complete by 5.4 cal ka BP. The remainder of the core is characterized by minor variation in δ13C (−28 to −29.5‰). δ15N declines from 3.9 to 2.6‰ before an abrupt increase in the top 6 cm to 4.1‰. Organic C increases gradually from 6 to 9%, while C:N remains close to 13; but C increases to 13% and C:N increases to 17 in the top 6 cm.
(a) δ13C and (b) δ15N of bulk sediment from Woahink Lake. (c) Percent mass of organic C and total N of bulk sediment from Woahink Lake. (d) C:N weight ratio. (e–h) Data presented for Triangle Lake as for Woahink Lake.
Triangle Lake sediment properties
We recovered 824 cm of sediment before limitations arising from the length of the drive rods (31 m) and sediment stiffness that prevented us from coring vertically. The core base dated to 6.2 cal ka BP where sedimentation rates were slow (0.08 cm/yr), after which sedimentation rate increased to 0.23 cm/yr at 370 cm (2 cal ka BP), and then declined to 0.15 cm/yr at the core top (Table 1). The sediments are mainly a massive light brown sapropel with seven distinct light gray silt layers (at ca. 6.0, 3.2, 3.0, 2.3, 0.6, 0.09 cal ka BP and the core top) that correspond to peaks in MS (Fig. 3). Background MS has low variability, but increases at 200 cm (1.2 cal ka BP) shortly after vivianite is last observed in the core (Fig. 2). BD fluctuates around 0.6 g/cm3 and LOI also fluctuates between 10 and 15%.
Organic matter characteristics and stable isotopes at Triangle Lake show few trends. Organic C is consistently between 3 and 4% and C:N between 12 and 14 (Fig. 3). δ13C fluctuated around −27‰ with several peaks close to −26‰ up to 500 cm (2.6 cal ka BP), after which a period of sustained higher δ13C (ca. −25‰) persists until 420 cm (2.3 cal ka BP). Above 400 cm (2.2 cal ka BP) δ13C declines from −27 to −28‰. δ15N fluctuates around 2.2‰ below 610 cm (3.5 cal ka BP) and around 1.8‰ from 610 to 480 cm (2.6 cal ka BP), after which it increases to 3.4‰ until 420 cm (2.3 cal ka BP). δ15N then fluctuates between 1.6 and 2.2‰ for the remainder of the core, until a peak of 3‰ at the core top. Several peaks in δ15N and δ13C, and minima in C:N, correspond to peaks in MS.
Woahink Lake pollen record
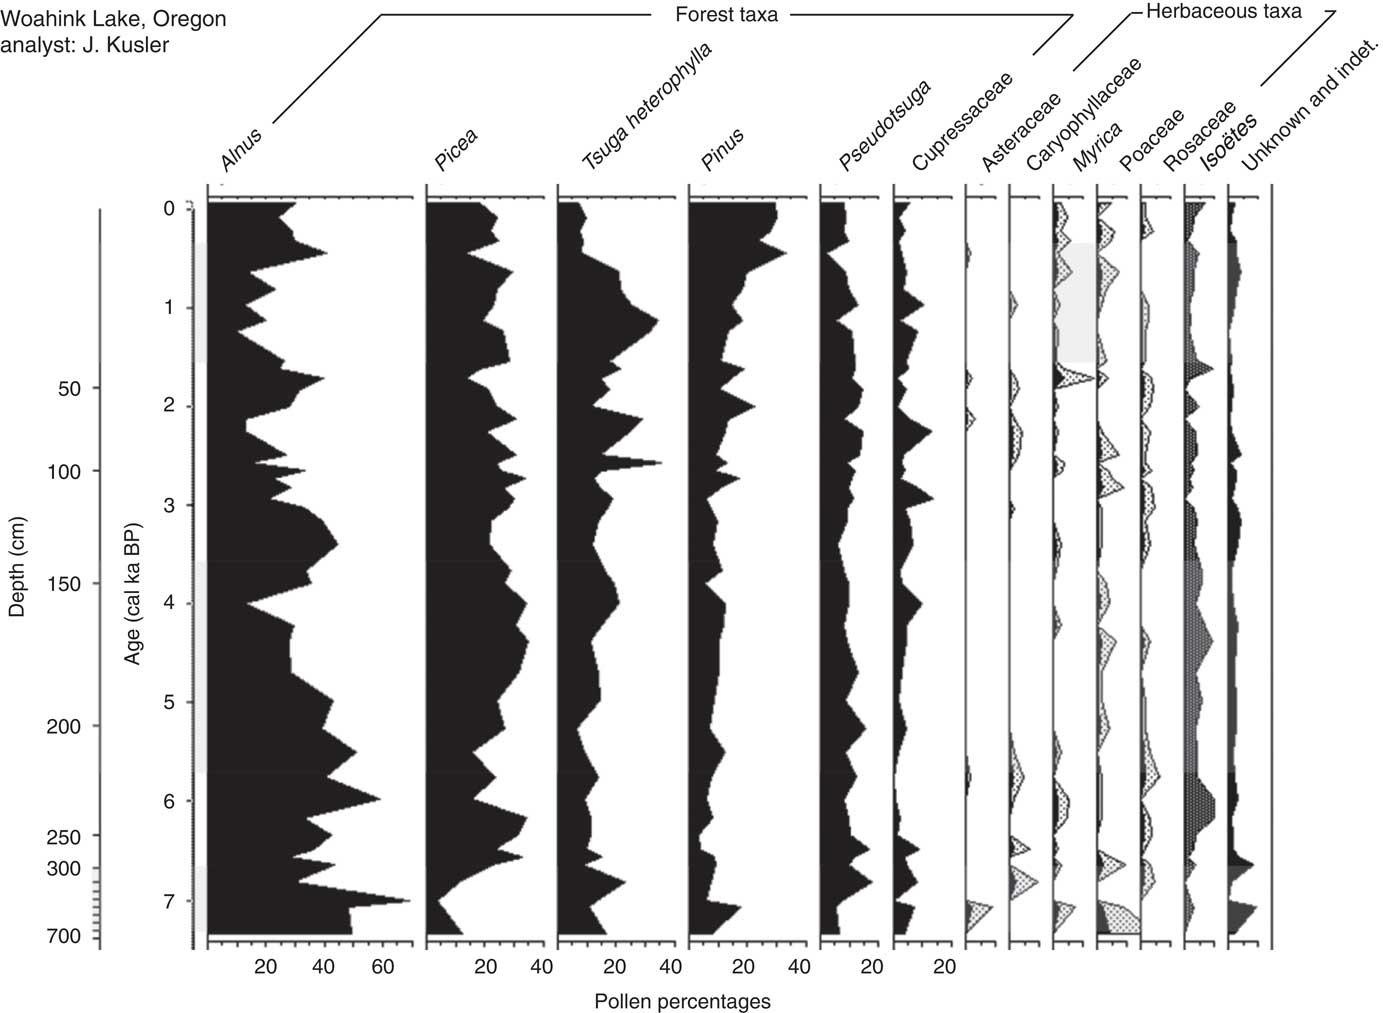
Alder, spruce, and western hemlock are the dominant pollen taxa for most of the record (means=31%, 24%, and 16%, respectively; Fig. 4). Pine, Douglas-fir and western redcedar-type pollen are also present throughout the record (means =13%, 10%, and 4%, respectively). Alder and spruce vary inversely at 7.0, 6.0, 3.5, 1.7 cal ka BP, and AD 1400. Alder has the highest variability (range: 10–69%) and mean values decrease by ~15% over the record. Spruce also decreases (~10%) over the record. At 1.2 cal ka BP, western hemlock reached its highest values (35%) and pine began an increase from 15% to 30% as western hemlock decreased until the core top.
Pollen-percentage diagram for forest, herbaceous, and aquatic taxa at Woahink Lake, Oregon.
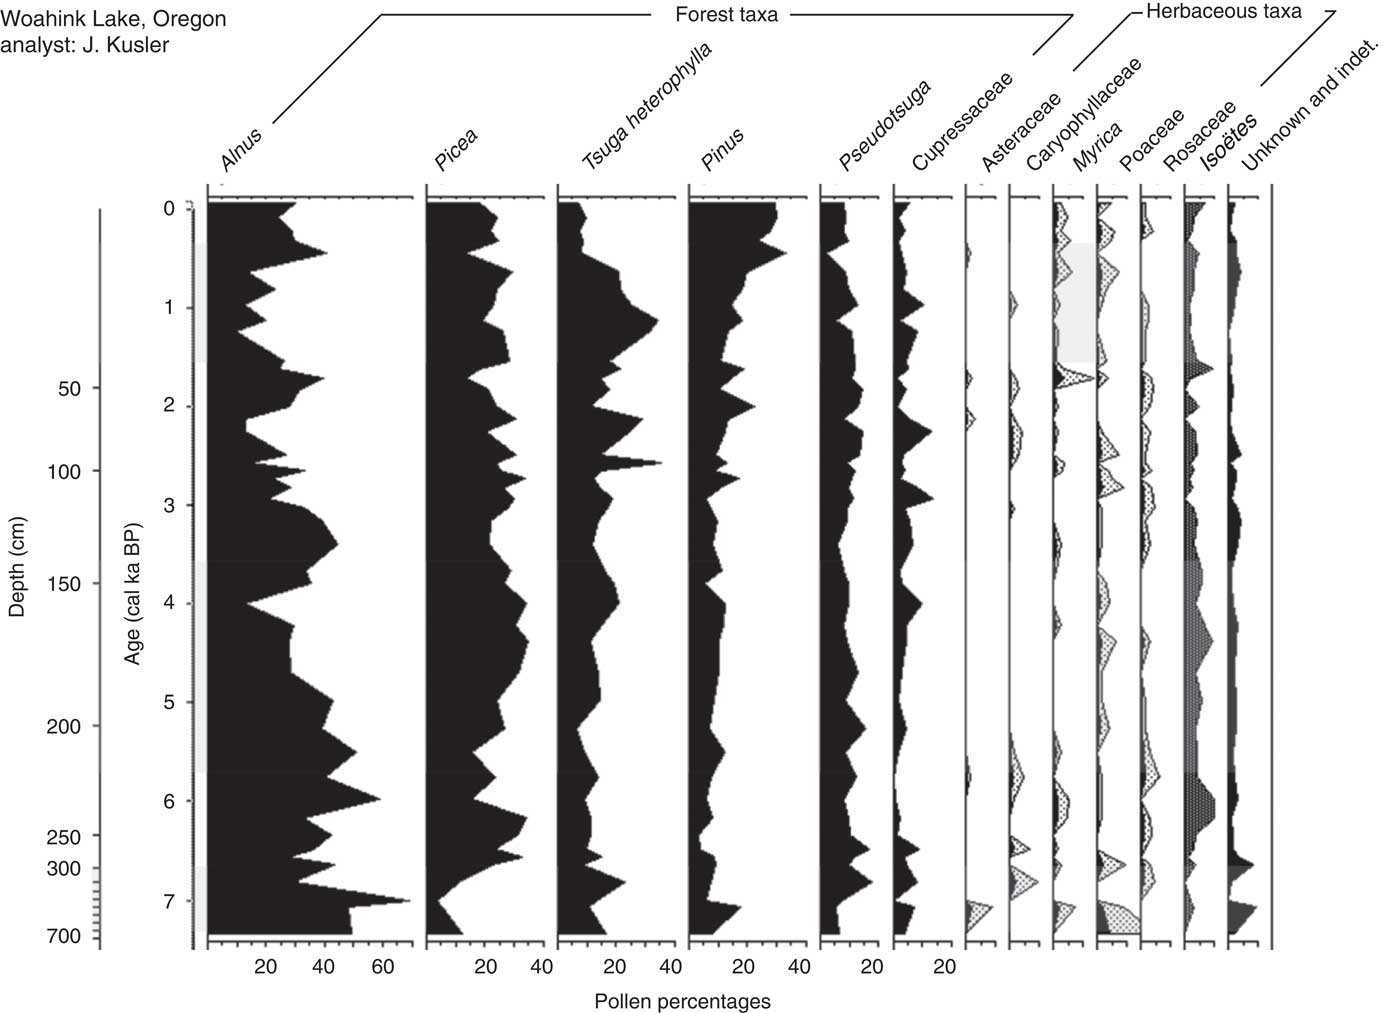
Herbaceous and shrub taxa, including aster family (Asteraceae), pink family (Caryophyllaceae), bayberry (Myrica), grass (Poaceae), and rose family (Rosaceae), were minor components of the pollen record (<1%). Herbaceous taxa are lowest from 5.9–3.5 cal ka BP. Isoetes pollen was found in low percentages (mean = 3.08%) and declined over the record, with peaks at 6.0, 4.5, and 2.5 cal ka BP.
Nitrogen isotope mixing model
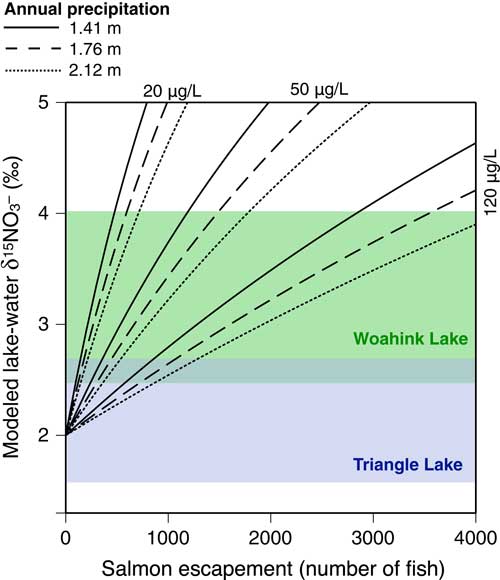
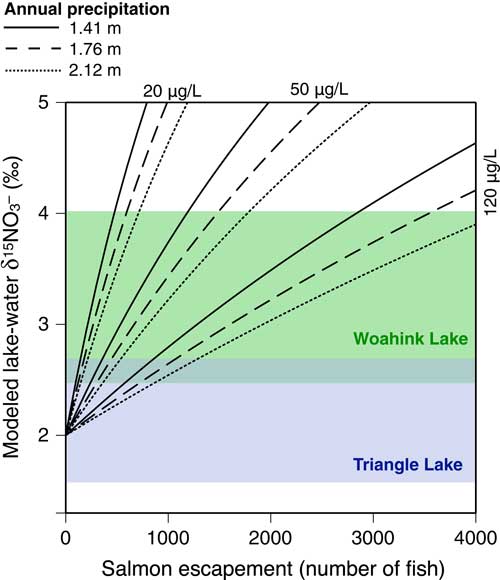
Lake-water δ15N was most sensitive to the concentration of terrestrial (watershed) DIN and to the number of adult salmon per year, especially for low DIN concentrations (20 μg/L) and low numbers of salmon (<2000; Fig. 5). Varying precipitation ± 20% affected δ15N generally less than 1‰ and had larger effects under low DIN and low escapement scenarios. For the low DIN scenario, precipitation variation caused lake-water δ15N to vary by 0.4‰ or 1.1‰ at low (300 fish) or high (3000 fish) escapements, respectively. For the high DIN scenario, precipitation varied lake-water δ15N by 0.1‰ or 0.5‰ for the low and high escapements, respectively. Isotopic values at the mean value for Woahink Lake sediment (3.5‰) could be reached at low watershed DIN with an escapement of only 500 fish, but at high watershed DIN escapement would need to be more than 3000 fish to reach 3.5‰.
(color online) Mixing-model of nitrogen inputs to Woahink Lake. The modeled δ15N of DIN in Woahink Lake was calculated using a mixing model with three levels of watershed nitrogen concentration, three levels of precipitation, and a wide range of salmon spawner returns. The shaded areas, and their overlap, indicate the range of δ15N observed in the Woahink and Triangle lake records, respectively. See the text for details.
DISCUSSION
Transition from estuary to lake (7.5 to 5.4 cal ka BP)
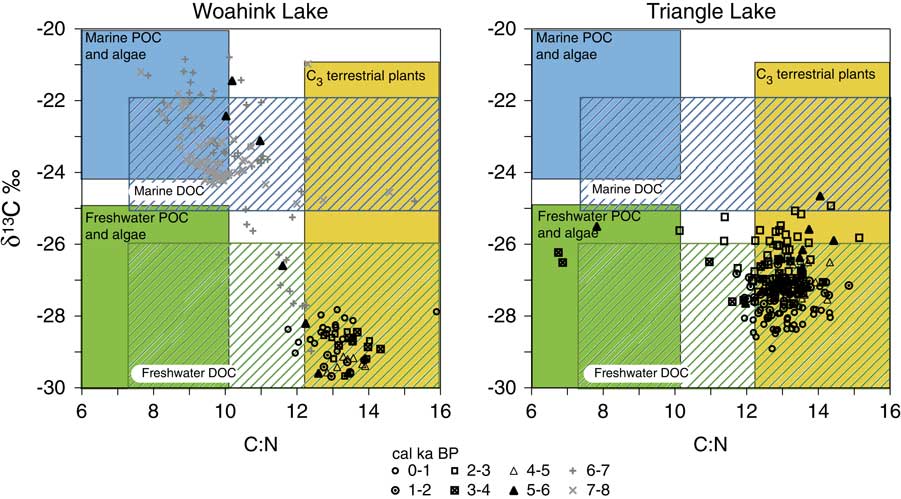
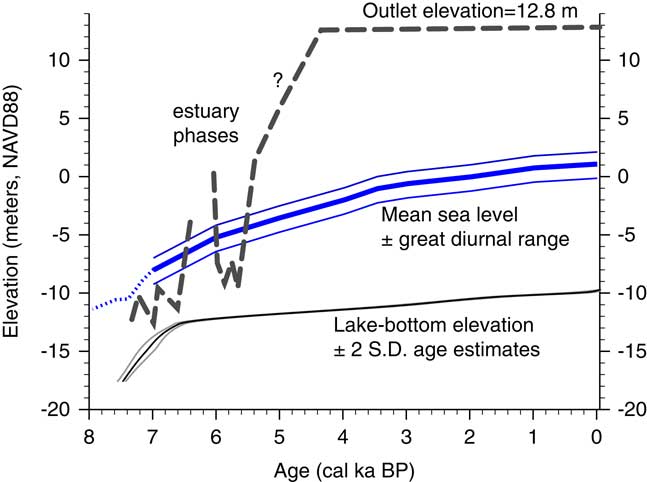
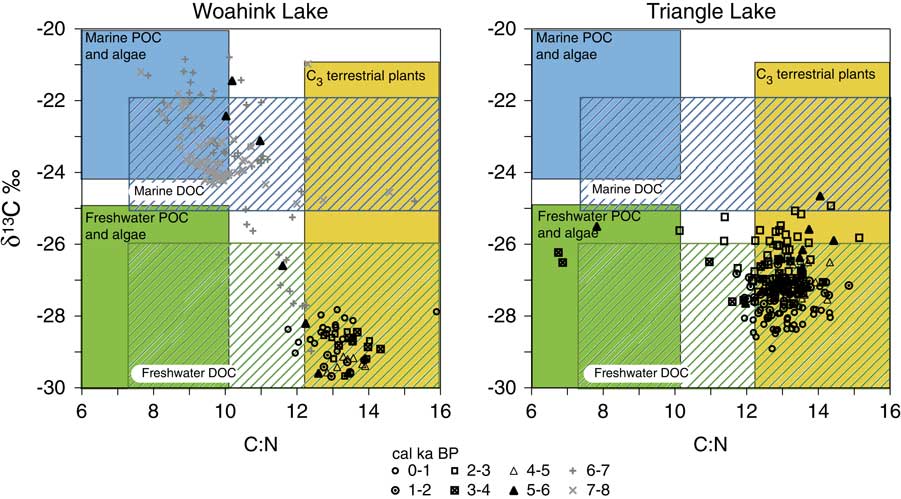
From 7.5 to 5.4 cal ka BP, the Woahink Lake core reveals a transition from a marine estuary to a freshwater lake. Periods of high δ13C (>−25‰) and δ15N (>7‰) and scattered shells are consistent with estuarine sediments (Lamb et al., Reference Lamb, Wilson and Leng2006; Fig. 6). The core base dates to a time of rapid eustatic sea-level rise, and the sediment accumulation rate is nearly equivalent to the rate of sea-level rise (Fig. 7). At this time, increasing eustatic sea level and the latitudinal placement of the northeast Pacific storm track promoted strong onshore winds, causing the transport and deposition of sand along the Oregon coast (Peterson et al., Reference Peterson, Stock, Price, Hart, Reckendorf, Erlandson and Hostetler2007). The basal 1.4 m of the core contains bands of sand, and two MS peaks at 636–667 cm indicate sand lenses that date to 7.3 cal ka BP. Peterson et al. (Reference Peterson, Stock, Price, Hart, Reckendorf, Erlandson and Hostetler2007) documented nearby (<5 km north of Woahink Lake) Holocene dune emplacement at 7.3 cal ka BP. This sand layer is coeval with a tsunami deposit dated to 7.3 cal ka BP at Bradley Lake (Kelsey et al., Reference Kelsey, Nelson, Hemphill-Haley and Witter2005), located 98 km south of Woahink Lake. Sand deposits persist until 6.8 cal ka BP during the period of high sedimentation rate, while C:N indicates pulsed inputs of terrestrial and aquatic organic matter (Fig. 3), which could result from mass-wasting events or the accumulation of material in an enclosing hydrologic system as dunes blocked the outlet of the lake.
(color online) Feature space of C:N and δ13C indicate the origin of organic matter over time in Woahink (left panel) and Triangle (right panel) lakes. Symbols are coded by millennia to show estuary versus freshwater phases at Woahink Lake. The figure shows how C:N values distinguish between terrestrial and aquatic sources, and δ13C distinguishes freshwater and marine sources. POC = particulate organic carbon; DOC = dissolved organic carbon. Based on Lamb et al. (Reference Lamb, Wilson and Leng2006).
(color online) Change over the last 7400 years of mean sea level, elevation of the bottom of Woahink Lake, and estimated elevation of the Woahink Lake outlet. The basin began as an estuary, was dammed by a dune at 6.55 cal ka BP, returned to an estuary at 5.9 cal ka BP, and was dammed again at 5.6 cal ka BP. The mean sea-level curve for western Oregon is from Witter et al. (Reference Witter, Kelsey and Hemphill-Haley2003) that has been extended to 8 cal ka BP (dashed line) by splicing on the reconstruction by Bird et al. (Reference Bird, Austin, Wurster, Fifield, Mojtahid and Sargeant2010). The outlet elevation was placed below mean sea level at times of marine indicators in the sediment record.

Freshwater conditions first appear at Woahink Lake at 6.55 cal ka BP shortly after three peaks in MS that likely resulted from growth of the adjacent sand dune. Freshwater was maintained until ca. 6.1 cal ka BP, and then transitioned back to marine-estuary conditions until 5.6 cal ka BP, as inferred by δ13C (Fig. 3). The breach of the dune dam may have been caused by a tsunami from a large well-documented Cascadia earthquake that occurred at 5.93 cal ka BP (Morey et al., Reference Morey, Goldfinger, Briles, Gavin, Colombaroli and Kusler2013). At Triangle Lake (Fig. 8) and at the adjacent Little Lake (Long et al., Reference Long, Whitlock, Bartlein and Millspaugh1998), silt layers suggest rapid erosion at 5.95 cal ka BP. It is unlikely that fire-related erosion was the causal mechanism, as there is no associated signal in the charcoal record at nearby Little Lake (Long et al., Reference Long, Whitlock, Bartlein and Millspaugh1998). Changes in several proxies, including the disappearance of vivianite, which is common in estuary sediments (Egger et al., Reference Egger, Jilbert, Behrends, Rivard and Slomp2015), indicate that the lake was established by 5.4 cal ka BP. An increase in precipitation in the Pacific Northwest at 5.7 cal ka BP (Starratt, Reference Starratt2012) may have aided in vegetation establishment on dunes that would stabilize the lake outlet.
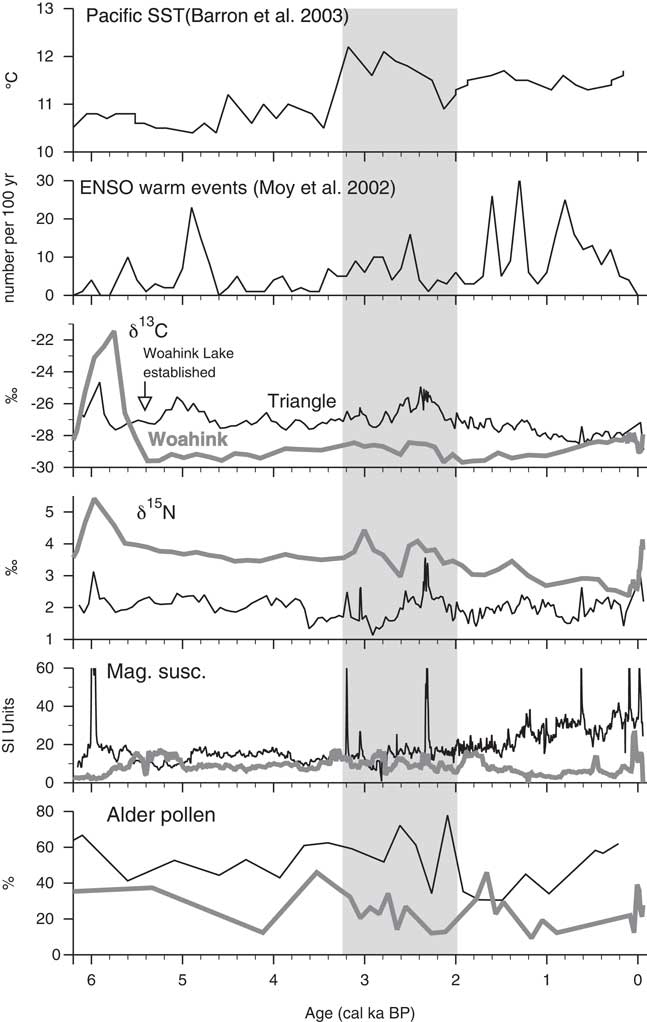
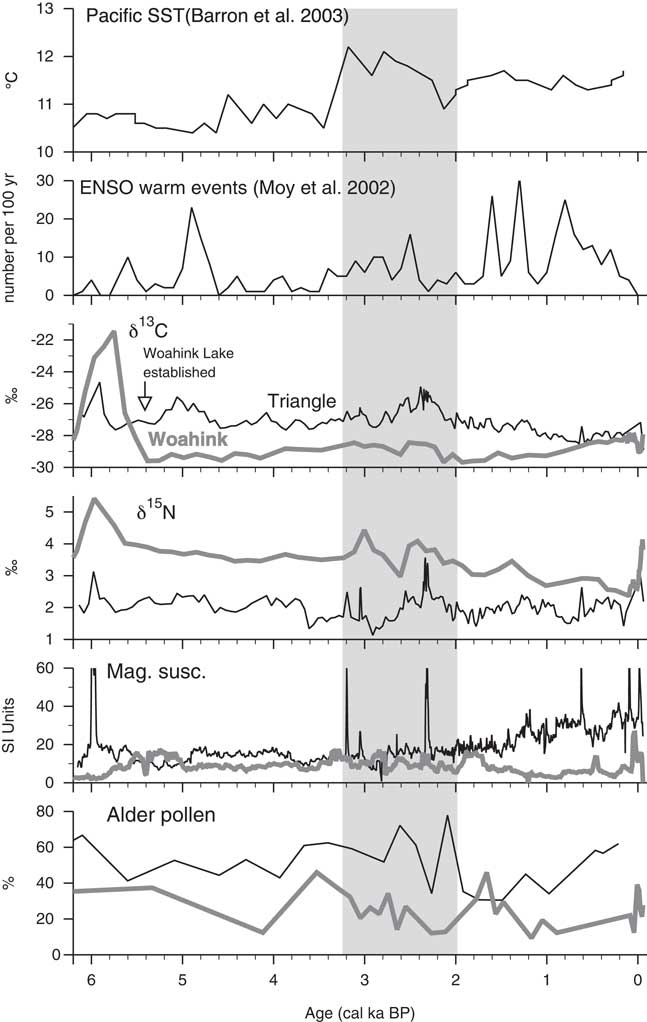
Paleoclimate reconstructions (sea-surface temperatures and El Niño events) compared with isotope ratios, magnetic susceptibility, and alder pollen percentages at Woahink Lake and Triangle Lake. Alder pollen representative of Triangle Lake was taken from adjacent Little Lake (Worona and Whitlock, Reference Worona and Whitlock1995). Gray shading from 3.2 to 2.0 cal ka BP indicates a period of increased SST and increased variability in δ15N.
Disturbance events after 5.4 cal ka BP
Both sites contain additional records of disturbance events, some of which appear to be linked to reconstructed Cascadia earthquakes. At Triangle Lake, silt layers at 3.2, 3.0, 2.3, and 0.6 cal ka BP were identified by a sharp increase in MS, decrease in organic matter (LOI, C, N, and C:N) and corresponding spikes in δ15N. The first two events correspond to tsunami events at Bradley Lake (Kelsey et al., Reference Kelsey, Nelson, Hemphill-Haley and Witter2005) and the events at 3.0 and 2.3 cal ka BP correspond to Cascadia-earthquake induced turbidites in the Hydrate Ridge Basin at 2.96 and 2.2 cal ka BP (Morey et al., Reference Morey, Goldfinger, Briles, Gavin, Colombaroli and Kusler2013). We did not see strong evidence of the well-documented, m-9 earthquake that spanned the entire Cascadia Margin in AD 1700, though we note chronological control is relatively poor in our cores during this time period. Alternatively, large fire events have the potential to greatly increase subsoil erosion (Colombaroli and Gavin, Reference Colombaroli and Gavin2010). Severe fires preferentially volatilize 14N from vegetation and soil, resulting in sediment δ15N peaks following charcoal peaks (Dunnette et al., Reference Dunnette, Higuera, McLauchlan, Derr, Briles and Keefe2014). We note that soil is naturally enriched with 15N due to loss of isotopically depleted N over time, thus erosional inputs of soil should increase δ15N even in the absence of fire (Perakis et al., Reference Perakis, Sinkhorn and Compton2011). In either case, inwash of nutrients with these events likely enhanced algal productivity. These processes may explain the distinct δ15N peaks (ca. 1‰) and muted δ13C peaks (ca. 0.5‰) following the deposition of multiple silt layers at Triangle Lake (Fig. 8).
Both lakes show the effects of logging and development in their uppermost sediment, though the lack of 210Pb dating precludes specific dating of events. At both lakes, increased MS (including two peaks at Triangle Lake) may reflect twentieth century logging and road building. Both lakes also show a sharp increase in δ15N (>1‰) at the core top. Development of the shoreline at both lakes with homes that lacked septic systems would have increased nutrient loading with higher 15N values. At Triangle Lake, a fish ladder installed in 1989 provides passage past waterfalls downstream. The increase in δ15N may also be attributed to spawning Chinook salmon accessing the Triangle Lake watershed for the first time.
Marine-derived nutrients in Woahink Lake
We examined several lines of evidence to assess the possibility that a signature of MDN was recorded in the sediments at Woahink Lake. Low sedimentation rates, low salmon abundance, and anthropogenic influences on δ15N levels precluded the possibility of calibrating the δ15N record against historical trends in salmon escapement. The existing data, however, support the hypothesis that MDN significantly influences the δ15N record at Woahink Lake.
The first line of support is that the δ15N at Woahink Lake (mean = 3.5‰, since 5.4 cal ka BP) is higher than at the control lake (mean = 2.2‰; Fig. 8). Several processes act to affect δ15N in sediment relative to DIN in lake water, including algal discrimination against dissolved inorganic 15N (Teranes and Bernasconi, Reference Teranes and Bernasconi2000) and diagenetic processes that may increase δ15N in residual matter due to metabolic reactions that discriminate against 15N in aerobic conditions (Lehmann et al., Reference Lehmann, Bernasconi, Barbieri and McKenzie2002), though such diagenetic processes are complex and results vary among studies (Gälman et al., Reference Gälman, Rydberg and Bigler2009). Both Triangle and Woahink lakes have similar sedimentary environments (deep oligotrophic lakes) and therefore we expect these processes to be similar at both sites. At Woahink Lake, %N does not decrease with depth near the core top and C:N peaks in the uppermost sediment, which is consistent with an increase in woody material input, rather than the expected pattern of N decreasing with depth due to slow decomposition (Brahney et al., Reference Brahney, Ballantyne, Turner, Spaulding, Otu and Neff2014). Diagenetic processes are also not likely responsible for the 5000-yr decline in δ15N, as diagenetic processes are thought to be very minor once sediment is buried more than a century (Gälman et al., Reference Gälman, Rydberg and Bigler2009; Brahney et al., Reference Brahney, Ballantyne, Turner, Spaulding, Otu and Neff2014).
Second, Woahink Lake is oligotrophic, so even small contributions of MDN are likely to affect the measured sediment δ15N. Low productivity associated with oligotrophic conditions is reflected by low organic matter content with relatively depleted δ13C during the last 5.4 cal ka BP. Importantly, the C:N ratios at Woahink Lake (ca. 13) are consistent with a major contribution from aquatic rather than terrestrial sources, and thus organic δ15N is reflective of lakewater DIN isotope composition. C:N ratios of 4–10 are common for algae and ratios of 20+ are often attributed to vascular land plants (Fig. 6; Meyers and Lallier-vergés, Reference Meyers and Lallier-vergés1999), however C:N may be greater than 13 in nitrogen-deficient lakes (Hecky et al., Reference Hecky, Campbell and Hendzel1993; Brahney et al., Reference Brahney, Bos, Pellatt, Edwards and Routledge2006). We suggest there were very limited inputs of terrestrial organic matter at Woahink Lake because of the small drainage-basin-to-lake-size ratio, low watershed relief, and the location of the coring site, which is in a deep location far from the inlets (Selbie et al., Reference Selbie, Finney, Barto, Bunting, Chen, Leavitt, MacIsaac, Schindler, Shapley and Gregory-Eavesa2009).
Our third line of support is derived from the mixing model of estimated dissolved inorganic N (DIN) and salmon abundance. It indicates that a reasonable salmon spawner population (ca. 2000 fish/yr) can elevate the lake-water δ15N from an estimated 2‰ from the watershed to the observed ca. 3.5‰ (Fig. 5). This estimate is very sensitive to the watershed contribution to lake DIN, however, which may change considerably under earlier climates with a different abundance of alder and stream discharge (Perakis et al, Reference Perakis, Sinkhorn and Compton2011). Though alder pollen follows an overall decreasing trend similar to the δ15N record (r = 0.29, P = 0.2), large century-scale variability in the δ15N record does not match that of the alder pollen record (Fig. 8). We suspect that the geological materials around Woahink Lake (mostly forested Pleistocene sand dunes) are rapidly drained and contribute little N to stream-flow, and thus the lower estimate of watershed DIN levels may be more realistic. Together, these lines of evidence suggest that the addition of MDN to the hydrologic system did measurably affect lake-water δ15N.
Nutrients provided by salmon may be important to biological productivity, particularly given the low availability of nutrients in Woahink Lake. Primary aquatic productivity has been correlated with salmon abundance in several Alaskan sockeye lakes (Gregory-Eaves et al., Reference Gregory-Eaves, Smol, Douglas and Finney2003), and substantial increases of riparian forest growth have also been noted in salmon-spawning watersheds (Helfield and Naiman, Reference Helfield and Naiman2001). At Woahink Lake, however, our model (Fig. 5) suggests that the contribution of marine-derived nitrogen to raise lake-water δ15N to 3.5‰ would increase the lake-water DIN by only 15% regardless of the concentration of input DIN from the watershed. Therefore, we should not expect a strong correlation between indicators of lake productivity and δ15N. Indeed, BSi is not correlated with δ15N at Woahink Lake (r=−0.28, P=0.32; Fig. 2). Alternatively, BSi may not be accurately reflecting total aquatic productivity. Identification of diatom taxa would likely improve our understanding of the BSi record.
A millennial-scale decline in δ15N over the last ~6000 yr
The main signal in the δ15N record at Woahink Lake, following lake formation, is a millennial-scale steady decline from around 4 to below 3‰, with a positive and negative excursion between 3.2 and 2.0 cal ka BP (Fig. 8). As it seems reasonable that the elevated δ15N results from MDN input, our mixing model (Fig. 5) can help evaluate factors that may have caused this long-term trend. One explanation for a decline in δ15N at Woahink Lake over the late Holocene may be an increase in precipitation resulting in increased nutrient (non-MDN) input into the lake. For example, the mixing model indicates that an increase of annual precipitation from 20% below to 20% above modern levels would decrease δ15N by as much as 1.1‰ (see above). However, there is little evidence to support such a large increase in precipitation over the last 6000 yr as inferred from our pollen record, a nearby pollen record at Taylor Lake (Long et al., Reference Long, Whitlock and Bartlein2007), a pollen-based precipitation reconstruction from Vancouver Island (Brown et al., Reference Brown, Fitton, Schoups, Allen, Wahl and Hebda2006), and a δ13C speleothem record from Oregon Caves (Ersek et al., Reference Ersek, Clark, Mix, Cheng and Lawrence Edwards2012). Alternatively, an increase in stream DIN concentrations may also decrease δ15N. However, alder abundance is the main factor related to stream DIN (Compton et al., Reference Compton, Church, Larned and Hogsett2003), and alder pollen decreases during the period of δ15N decline. Temporal changes in the isotopic composition of salmon, a change in salmon species, or a change in watershed DIN could result in changes in sediment δ15N. Limited archeological data on the δ15N composition of Pacific salmon during Holocene does not suggest significant secular changes (Misarti et al., Reference Misarti, Finney, Maschner and Wooller2009). The effects of climatic change on watershed nitrogen availability (e.g., McLauchlan et al., Reference McLauchlan, Williams, Craine and Jeffers2013) or changing alder abundance and subsequent influence of atmospheric N2 on watershed DIN δ15N are difficult to quantify with current understanding. We tentatively conclude that the long-term decline in δ15N is most consistent with decreasing numbers of returning coho salmon.
The trend in declining MDN broadly tracks changes in coastal conditions in the adjacent California Current region off Oregon and northern California. The δ15N is weakly negatively correlated (r = -0.38, P = 0.13) with the SST record of Barron et al. (Reference Barron, Heusser, Herbert and Lyle2003), which is expected from shorter-term observations of the influence of variations in SSTs on salmon production (Mueter et al., Reference Mueter, Peterman and Pyper2002). During the middle Holocene, the southward flow of the California Current strengthened, resulting in strong upwelling and cooler SSTs (Barron et al., Reference Barron, Heusser, Herbert and Lyle2003; Barron and Bukry, Reference Barron and Bukry2007; Diffenbaugh and Ashfaq, Reference Diffenbaugh and Ashfaq2007). These conditions, similar to La Niña or negative phase PDO conditions, would have increased the availability of nutrients and forage for coho salmon along the Oregon coast (Rupp et al., Reference Rupp, Wainwright, Lawson and Peterson2012). A period, from 5.0 to 3.5 cal ka BP, of stable or increasing SST, mostly low ENSO variability (Emile-Geay et al., Reference Emile-Geay, Cobb, Carre, Braconnot, Leloup, Zhou and Harrison2016), and reduced upwelling corresponds to stable δ15N.
Variability in the SST and upwelling system beginning at 3.0 cal ka BP highlights complexities among seasonal climate variables. An increase in SST at this time has been attributed to increased variability in ENSO (Moy et al., Reference Moy, Seltzer, Rodbell and Anderson2002) and the onset of the southern placement and modern regimes of coastal upwelling associated with the California Current (Barron and Bukry, Reference Barron and Bukry2007). The increased variability may have provided sequences of upwelling-enhanced productivity and winter rainfall that promoted migration, spawning, and juvenile survival. Removing four SST data points (>11.8°C) from this period improves the correlation between δ15N and SST for the remainder of the record (r = -0.609, P <0.001). After 2.0 cal ka BP, SSTs remained warm, and diatom evidence indicates warming in the fall and winter in particular (Barron and Anderson, Reference Barron and Anderson2011). Such conditions are negatively correlated with coho survival for both smolt outmigration and adult survivorship (Lawson, Reference Lawson1993; Mueter et al., Reference Mueter, Peterman and Pyper2002; Rupp et al., Reference Rupp, Wainwright, Lawson and Peterson2012), and is therefore consistent with continuing declining δ15N. Our results also are consistent with an opposite (increasing) trend in δ15N at Karluk Lake in south-central Alaska, as expected for a persistent millennial-scale negative correlation in ocean productivity between the Gulf of Alaska and the Pacific Northwest (Finney et al., Reference Finney, Gregory-Eaves, Douglas and Smol2002). In contrast, a recent study by Addison et al. (Reference Addison, Barron, Finney, Kusler, Bukry, Heusser and Alexander2017), where redwood pollen and diatom composition were used to indicate upwelling intensity, suggests a regime change towards greater upwelling after ca. 2.9 cal ka BP. Such a regime change towards greater productivity would suggest that factors other than higher average primary productivity were important in controlling salmon abundance over the last 2000 yr.
The millennial-scale trend in salmon abundance inferred from the Woahink Lake sediment record, the first such record from Oregon, does not necessarily imply a regionally synchronous pattern in salmon abundance, and does not indicate that current declines in salmon populations are the result of this long-term trend. Few millennial-scale salmon reconstructions have been published to assess long-term regional synchroneity. Two records from Kodiak Island, Alaska tracked each other closely on multi-centennial timescales over the last 2200 yr (Finney et al., Reference Finney, Gregory-Eaves, Douglas and Smol2002). However, a synthesis of records from southwest Alaska has shown little regional synchrony at the decade to century scale, citing ecosystem complexity that drove divergent responses to climate change (Rogers et al., Reference Rogers, Schindler, Lisi, Holtgrieve, Leavitt, Bunting and Finney2013). Similarly, variations in local populations of Snake River salmon, prior to the 1980s, showed little synchrony with our results, which may be due to foraging in different ocean habitat (California Current System versus Gulf of Alaska/North Pacific Gyre), which, nonetheless, may buffer variability in regional populations in the Pacific Northwest (Moore et al., Reference Moore, McClure, Rogers and Schindler2010; Schindler et al., Reference Schindler, Hilborn, Chasco, Boatright, Quinn, Rogers and Webster2010). In addition, it is likely that increased anthropogenic nitrogen pollution at Woahink Lake overprinted the natural abundance of δ15N in recent decades and thus precludes comparison of the millennial-scale trend found in this study with recent trends in salmon populations.
It is more difficult to interpret δ15N at shorter timescales due to low temporal resolution and the influence of other factors on the incorporation of MDN into the isotope signal. Adult coho salmon spawn and die in very small streams; ca. 50% of the nutrients may be delivered to adjacent soils (Drake et al., Reference Drake, Smith and Naiman2005). Thus, there may be years to decades of stored MDN in riparian areas before it is leached as DIN. In addition, in N-limited lake water, increasing the DIN concentration from increased MDN will increase the selective fractionation for 14N during algal production, thus muting the sensitivity of δ15N in sediment to escapement size, though this depends on the primacy of N limitation rather than another nutrient (Brahney et al., Reference Brahney, Bos, Pellatt, Edwards and Routledge2006). This process may have contributed to the low variability in δ15N during the late Holocene. We also note that a synthesis of archeological middens indicates great stability in salmon use along the Columbia River (Butler and Campbell, Reference Butler and Campbell2004).
CONCLUSIONS
The nitrogen isotope record from Woahink Lake provides evidence of a millennial-scale decline of salmon abundance over the last 5000 yr, suggesting that this coastal lake system has supported larger coho salmon escapements than occurred prior to twentieth century human impacts. This trend is supported in general with the twentieth-century environmental controls of coho salmon abundance and the millennial-scale trends in coastal upwelling and SST. The oligotrophic status and low flushing rate of the lake aided in the detection of MDN in the isotope values, but these factors also resulted in a low sedimentation rate and a temporally smoothed record. In addition, N pollution precluded the potential to verify the nitrogen isotope record against the last 60 years of recorded escapement size, and thus it is not possible to compare recent trends in salmon abundance with the millennial scale trend. Few lakes in the Oregon Coast Range have similar hydrological properties to Woahink Lake, therefore it remains to be determined whether another lake may confirm that the millennial-scale pattern detected at Woahink Lake is representative of regional trends.
ACKNOWLEDGMENTS
This research was funded by a student travel grant to J. Kusler from the Limnological Research Center, Department of Geology and Geophysics, University of Minnesota-Twin Cities, where most of the initial core descriptions were performed, and a University of Oregon Junior Professorship Grant to D. Gavin. We are grateful to Jesse Ford for aiding with coring and reviewing the manuscript and to W. Andrew Marcus, Patrick Bartlein, Johan Rydberg, and Steven Perakis for feedback during the project. We thank the Marine Geology Repository at Oregon State University for allowing us to use their facilities. We appreciate Tom Brown for supervising the radiocarbon dating. Amanda Orth assisted with BSi processing. We are also thankful for field help from Ross Kusler, Mer Wiren, Aquila Flower, Gretchen Hill, Jill Marshall, Richard Reynolds, and Dave Fisher.