Introduction
Auxological research in Poland and Europe has a rich, long-established tradition. It frequently centres around two key issues. The first issue addresses the inter-generational tendencies that characterize physical development (Brundtland et al., Reference Brundtland, Liestol and Walloe1980; Chinn et al., Reference Chinn, Rona and Price1989; Cernerud, Reference Cernerud1992; Bielicki et al., Reference Bielicki, Szklarska, Welon and Brajczewski1997; Bielicki & Szklarska, Reference Bielicki and Szklarska1999; Lipowicz, Reference Lipowicz1999; Łaska-Mierzejewska, Reference Łaska-Mierzejewska1999; Nowicki, Reference Nowicki2000; Kołodziej & Kozieł, Reference Kołodziej and Kozieł2002; Cole, Reference Cole2003; Przewęda & Dobosz, Reference Przewęda and Dobosz2003; Łaska-Mierzejewska & Olszewska, Reference Łaska-Mierzejewska and Olszewska2006; Garcia & Quintana-Domeque, Reference Garcia and Quintana-Domeque2007; Trzcińska & Olszewska, Reference Trzcińska and Olszewska2007; Hiermeyer, Reference Hiermeyer2009; Popławska & Dmitruk, Reference Popławska, Dmitruk and Popławska2009; Steckel, Reference Steckel2009; Wilczewski et al., Reference Wilczewski, Popławska, Dmitruk and Popławska2009; Zaworski, Reference Zaworski and Popławska2009; Godina, Reference Godina and Tatarczuk2011; Negasheva, Reference Negasheva and Tatarczuk2011; Trzcińska et al., Reference Trzcińska, Tabor and Olszewska2012). The second issue involves analyses of the environmental conditions of somatic development (Charzewski, Reference Charzewski1981; Bielicki et al., Reference Bielicki, Szklarska, Welon and Brajczewski1997; Bielicki & Szklarska, Reference Bielicki and Szklarska1999, Kosińska & Kaliszewska-Drozdowska, Reference Kosińska and Kaliszewska-Drozdowska1999; Lipowicz, Reference Lipowicz1999; Silventoinen et al., Reference Silventoinen, Lahelma, Lundberg and Rahkonen2001; Przewęda & Dobosz, Reference Przewęda and Dobosz2003; Silventoinen, Reference Silventoinen2003; Kozieł et al., Reference Kozieł, Welon, Bielicki, Szklarska and Ulijaszek2004; Trzcińska & Olszewska, Reference Trzcińska and Olszewska2007; Dencikowska & Dencikowska, Reference Dencikowska, Dencikowska and Popławska2009; Markowska & Przychodni, Reference Markowska, Przychodni and Popławska2009; Trzcińska et al., Reference Trzcińska, Olszewska, Tabor and Popławska2009; Wilczewski et al., Reference Wilczewski, Popławska, Dmitruk and Popławska2009).
The aforementioned publications confirm the tendency for body size to have increased among children and youth (Przewęda & Dobosz, Reference Przewęda and Dobosz2003). However, in recent decades, body mass has been increasing more prominently than body height, leading to a constantly increasing rate of overweight and obesity (Popławska & Dmitruk, Reference Popławska, Dmitruk and Popławska2009). Moreover, the aforementioned studies have repeatedly shown that somatic traits depend on cultural (intrafamilial and extrafamilial) conditions of development and that physical parameters are related to shifts in the quality of life in Poland determined by the country's economic situation (Nowicki, Reference Nowicki2000; Łaska-Mierzejewska & Olszewska, Reference Łaska-Mierzejewska and Olszewska2006). The degree of urbanization of the place of residence, number of offspring in the family, and father's and mother's education and material status are the most frequently analysed environmental factors that affect morphological development in children and youth. At the same time, social gradients of physical development indicators have been shown to have gradually diminished. Studies have explained this phenomenon as being the result of society's increasing affluence and, consequently, a general improvement in living and housing conditions (Wilczewski et al., Reference Wilczewski, Popławska, Dmitruk and Popławska2009). In previous decades, a state of ‘biological classlessness’ has been observed in Scandinavian countries. A number of regions of Norway and Sweden had at the time reached a quality of life that allowed for differences in somatic traits between youth from different social layers to decrease (Brundtland et al., Reference Brundtland, Liestol and Walloe1980; Cernerud, Reference Cernerud1992, Reference Cernerud1994; Przewęda & Dobosz, Reference Przewęda and Dobosz2003). Such a decrease was found during earlier research among children aged 6 and 7 years from Warsaw (Trzcińska & Olszewska, Reference Trzcińska and Olszewska2007; Trzcińska et al., Reference Trzcińska, Olszewska, Tabor and Popławska2009). Furthermore, a study of the social environment conducted in Warsaw at the beginning of the 1980s also found symptoms of the same phenomenon (Charzewski, Reference Charzewski1981). The author of the study suggested that due to beneficial socioeconomic and educational conditions for development, children of educated parents from the Śródmieście district of Warsaw were close to achieving their full genetic potential in terms of body height (ibid.).
It can be assumed that the tendencies observed in recent decades among Polish children and youth for social gradients in somatic traits to decrease will progress as a result of intensifying globalization. Poland's joining the European Union in 2004 greatly contributed to this globalization, as did the legislative changes currently being implemented in the education system by which children will begin primary school education earlier. Poland will thus join the majority of European countries in which school education begins at the age of six. The legislative changes, commenced by the Ministry of National Education in 2009, are being introduced gradually over five years (in a step-by-step manner). Their aim is to equalize educational opportunities and to determine the particular talents of each child.
Research described in this paper is a continuation of research on biological growth and intrafamilial conditions of development. Testing the aforementioned opinions on the decrease in biological differences between environments with different socioeconomic and educational statuses seems a worthwhile pursuit. In view of the research concept described in this introduction, the aim of this study was to assess the somatic development of children from an urban agglomeration in Poland at the end of preschool education and the beginning of primary education with respect to selected socioeconomic and educational conditions.
Methods
The study was conducted in two series: in spring 2011 and spring 2012. Data were collected for 742 children from selected Warsaw kindergartens. The children were born in 2005 (the 2011 series) and in 2006 (the 2012 series). Their mean age was 5.84±0.31 years. The sex categories were equal: 371 boys and 371 girls. Kindergartens chosen for the study constituted a representative sample. The proportional number of public and non-public kindergartens was chosen from a list of all Warsaw preschool institutions. After establishing co-operative principles with a headmaster, the study was carried out on the children, whose parents gave written consent for the anthropometric measurements.
The diagnostic survey method (questionnaire technique) was used to assess the selected environmental conditions of development in the participating children. The survey was completed by parents of the participating children and contained six single-choice questions (cafeteria-style checklist) concerning the number of offspring in the family, and mother's and father's education, employment and material status. The respondents' answers provided data on intrafamilial factors that affect physical development.
Body height and the sum of six skin folds (over the biceps, over the triceps, under the scapula, on the abdomen, over the wing of ilium and on the calf) were chosen from the assessed anthropometric parameters for the purposes of determining somatic development of the study participants.
The study took place in the morning before noon. Height measurements were carried out with a tape measure set to the wall and with an angle bar. The skin folds were measured using a skin-fold caliper. These measurements took place only once, mainly due to the fact that children disliked being touched. The study was conducted with the permission of Senate Ethical Committee for Scientific Research of Józef Piłsudski University of Physical Education in Warsaw.
The obtained data were analysed using selected descriptive statistics methods (including cluster analysis), data standardization (normalization by mean values and SD) and the chi-squared test. Cluster analysis was conducted for normalized numerical values of body height and sum of skin folds. This method allowed uniform subsets of the assessed population to be selected in such a manner that the objects qualified for a given number of groups (in this case, five groups in each sex category) were as similar as possible and, at the same time, that the groups differed as much as possible between one another (Stanisz, Reference Stanisz2007). The frequency of each response to survey questions (concerning the number of offspring in the family, mother's and father's education and employment and material status) was analysed in the obtained clusters. The significance of differences between the aforementioned clusters was assessed using the chi-squared test. Typical levels of statistical significance were assumed: p<0.001, p<0.01 and p<0.05. Additionally, the level of statistical tendency of p<0.1 was used (Stupnicki, Reference Stupnicki2011). The analysis was conducted using Statistica 10.0 software.
Results
Most study participants came from families with a small number of offspring. The most typical model of developmental environment was a family with two offspring (56.6%), followed by almost 30% of families that had one offspring and almost 12% that had three offspring. Families with four, five or more offspring constituted less than 2.5% of the population. Parents' educational status shows a clear dominance of master's degree level of education, declared by over 60% of mothers and about 55% of fathers, over other specified categories. This was followed by secondary level education (almost 15% of mothers and over 20% of fathers). Postsecondary and bachelor's degree level education (as well as master's degree level education) was more frequent among mothers, while basic vocational and secondary education was more frequent among fathers. A vast majority of respondents (73% of mothers and almost 95% of fathers) declared full-time employment. Other responses were much less frequent: none of them exceeded a frequency of 11% (part-time employment declared by mothers) and some showed only a marginal frequency. Over half of the respondents (56.1%) declared raising their child in good material conditions, as assessed on a five-point scale. Almost 30% of families declared average material conditions and almost 9% declared very good material status. Bad and very bad material statuses were much less frequent than other categories.
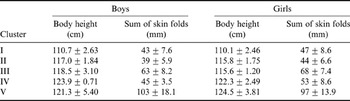
As part of the analysis of the participants' somatic development, five clusters were specified for each sex. These clusters were similar in boys and girls. At the same time, the clusters corresponded to different body height and body adiposity as well as to different relations between these two parameters. Table 1 shows the descriptive statistics of the analysed anthropometrical traits by sex and cluster.
Descriptive statistics (means and SD) of body height and sum of skin folds by sex and cluster, 6-year-old children, Warsaw, 2011 and 2012

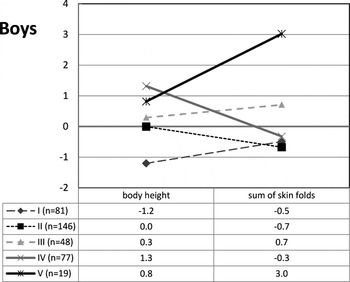
The first cluster for boys (cluster I) showed negative values of normalized height and sum of skin folds, with body height displaying lower values (−1.2 SD) than body adiposity (−0.5 SD). Cluster II was the most numerous and showed body height and sum of skin folds equal to group mean values (−0.7 SD each). In cluster III, both normalized parameters (body height and sum of skin folds) were positive and differed from each other by 0.4 SD. Cluster IV showed a body height of 1.3 SD and a negative normalized value of body adiposity (−0.3 SD). Cluster V was the least numerous. It comprised participants with body height that exceeded the group mean value by about 1 SD and with an especially high body adiposity (3 SD) (Fig. 1).
Normalized values of body height and sum of skin folds in the specified clusters among boys.

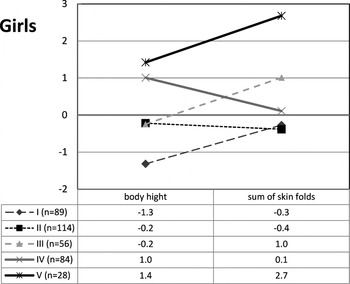
Among girls, cluster I showed negative normalized values of both body height (−1.3 SD) and sum of skin folds (−0.3 SD), as did cluster I among boys. Cluster II was also the most numerous among girls. It showed similar values for both anthropometric parameters that amounted to slightly below 0 (−0.2 SD and −0.4 SD, respectively). In cluster III, body height showed negative normalized values (−0.2 SD), while body adiposity showed positive values (1 SD). In cluster IV, body height amounted to 1 SD and body adiposity was slightly above 0 (0.1 SD). Cluster V was the least numerous one among girls (as was the corresponding cluster among boys) and comprised participants with a normalized sum of skin folds (2.7 SD) that was twice as high as their normalized body height (1.4 SD) (Figs 1 and 2).
Normalized values of body height and sum of skin folds in the specified clusters among girls.

After specifying the aforementioned clusters, the frequency of responses to each survey question about intrafamilial development conditions was assessed (taking into account each participant's membership in a given cluster). An analysis of the obtained numerical data using the chi-squared test indicated differences between the studied parameters of somatic development depending on some social variables (shown in Figs 3–7). Such differences were found among boys in terms of the number of offspring in the family (p<0.01) and mother's education (p<0.05). Similar tendencies were found among girls with respect to mother's education (p<0.05), father's employment (p<0.05), and, to a lesser degree, father's education (p<0.01).
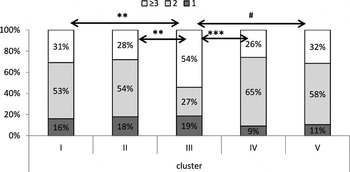
Percentage distribution of responses to the survey question concerning the number of offspring in the family among boys according to membership in a cluster. Significance of differences between clusters: #p≤0.1; **p≤0.01; ***p≤0.001.

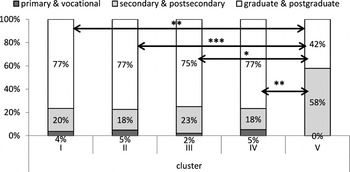
Percentage distribution of responses to the survey question concerning mother's education among boys according to membership in a cluster. Significance of differences between clusters: *p≤0.05; **p≤0.01; ***p≤0.001.

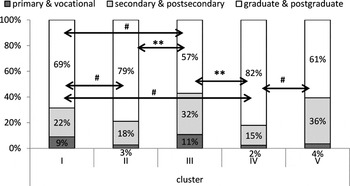
Percentage distribution of responses to the survey question concerning mother's education among girls according to membership in a cluster. Significance of differences between clusters: #p≤0.1; **p≤0.01.

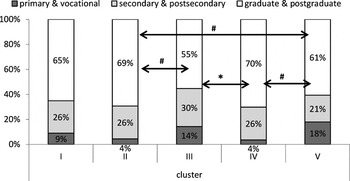
Percentage distribution of responses to the survey question concerning father's education among girls according to membership in a cluster. Significance of differences between clusters: #p≤0.1; *p≤0.05.

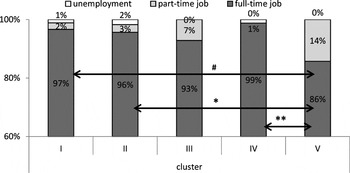
Percentage distribution of responses to the survey question concerning father's employment among girls according to membership in a cluster. Significance of differences between clusters: #p≤0.1; *p≤0.05; **p≤0.01.

A subsequent, more detailed stage of analysis using the chi-squared test enabled an assessment of differences between clusters in terms of those social variables that were found to be significant in the previous stage of calculations. In terms of the number of offspring in the family among boys, cluster III differed from cluster I (p<0.01), cluster II (p<0.01), cluster IV (p<0.001) and cluster V (at the level of statistical tendency: p<0.1) (Fig. 3). An analysis of the percentage share of the individual types of parents' education among boys found differences between cluster V and all the other clusters. The highest differences occurred between clusters V and II (p<0.001), followed by differences between clusters V and I (p<0.01) and between clusters V and IV (p<0.01). The lowest differences occurred between clusters V and III (p<0.05) (Fig. 4).
Among girls, mother's education differed between clusters IV and III (p<0.01), between clusters I and II (tendency: p<0.1), between clusters I and III (tendency: p<0.1), between cluster II and III (p<0.01), between cluster IV and V (p<0.1) and between clusters I and IV (tendency: p<0.1) (Fig. 5). Father's education showed significant differences between clusters IV and III (p<0.05) as well as a tendency towards significance between clusters IV and V, between clusters II and III and between clusters II and V (p<0.1) (Fig. 6). Father's employment differed especially between clusters V and IV (p<0.01), followed by the difference between clusters V and II (p<0.05) and between clusters V and I (tendency: p<0.1) (Fig. 7).
In addition, statistical calculations found no differences in the analysed parameters of somatic development with respect to the remaining social variables (i.e. those not included in Figs 3–7). Such a result was obtained for father's education, mother's employment and material conditions for both sexes, for mother's employment and material conditions among boys, and for the number of offspring in the family among girls. Thus, the number of observed differences was relatively lower than the number of potential differences.
Discussion
The results of this study showed certain relationships between the selected parameters of somatic development and living conditions among the family. These relationships involved differences between individual clusters depending on given living conditions and were most prominent with respect to mother's education, for which variable differences between clusters were found for both sexes. The somatic build of boys (including body height and body adiposity) also differed depending on the number of offspring in the family, while the somatic build of girls differed depending on father's employment and father's education.
A study by Przewęda and Dobosz (Reference Przewęda and Dobosz2003) confirmed the tendencies for youth somatic development to correlate with parent's education and the number of offspring in the family. Polish literature has described such tendencies numerous times. A monograph by the same authors on the physical fitness of Polish youth showed that children from families with a higher socioeconomic and educational status were much taller and had a much greater body mass than their peers from families with a lower socioeconomic and educational status. Przewęda and Dobosz (Reference Przewęda and Dobosz2003) pointed out that the aforementioned correlation has been observed in Poland for about 50 years, i.e. from the time researchers began to include these indicators in the analysis of social stratification. Similar trends have been found in anthropological assessments among rural girls from various parts of Poland. These assessments have confirmed once again that somatic traits among Polish youth continue to display regular monotonic changes depending on the number of offspring in the family and parents' education: the more offspring and the lower parents' education, the lower the height and body mass of children raised in such conditions (Łaska-Mierzejewska & Olszewska, Reference Łaska-Mierzejewska and Olszewska2003, Reference Łaska-Mierzejewska and Olszewska2006). On the other hand, earlier research by the authors of this study conducted among children at the end of preschool and the beginning of primary education found that the degree of urbanization affects somatic development more strongly than sex and intrafamilial factors. This conclusion was based on the fact that no statistically significant differences between mean values of body height and body mass measurements were found between subgroups with a different number of offspring in the family, educational status and material situation (Trzcińska et al., Reference Trzcińska, Olszewska, Tabor and Popławska2009).
This study observed relatively small differences between clusters according to subgroups with a different number of offspring in the family, mother's education, father's education and father's employment for both sexes. However, these relationships may not be considered regular and monotonic. This means that the obtained results do not clearly indicate that a greater number of offspring in the family or lower parent's education coincide with a lower body height and skin fold thickness among the assessed boys and girls, nor that children from families with the opposite social structure display a different morphological build. While this study found certain relationships between living conditions in the family and the values of the selected anthropometric parameters, these relationships were not typical: a ‘change in the value of a trait’ (translated from Polish, Łaska-Mierzejewska & Olszewska, Reference Łaska-Mierzejewska and Olszewska2003, p. 13) was observed, but without the characteristic regularity in the form of an orderly and monotonic direction of change.
The results obtained in this study, especially the lack of direction monotonicity in the observed relationships, may indicate to a certain degree that the importance of intrafamilial conditions of somatic development among children aged 6 year raised in urban agglomerations has decreased. The mother's education was found to be the most important factor due to the repeatability of results for both sexes. As Charzewski (Reference Charzewski1981) stated, the category of parents' education (including mother's education) involves a synthetic opinion on the household conditions in which the child lives, i.e. economic and cultural conditions, including hygienic and educational ones. In view of the extensive anthropological research conducted in recent decades beginning in the 1960s, the mother's educational status seems to be an especially significant factor in terms of satisfying a child's developmental needs. Łaska-Mierzejewska & Olszewska (Reference Łaska-Mierzejewska and Olszewska2003) emphasized the importance of this factor by referring to an extensive monograph by Bielicki et al. (Reference Bielicki, Szklarska, Welon and Brajczewski1997). Łaska-Mierzejewska and Olszewska pointed out that mother's education rose in the importance hierarchy of intrafamilial conditions from third place during the first (1965) and second (1975) series of anthropometric assessments among young men at conscription age to first place in the 1980s and 1990s as a factor responsible for differences in body height. The two authors also note that in three consecutive series of the assessment, father's education had a lower rank than mother's education. Furthermore, Łaska-Mierzejewska & Olszewska (Reference Łaska-Mierzejewska and Olszewska2003) pointed out that the structure of education among mothers changed between 1965 and 1995. At the beginning of the period, as many as 93% of women from rural regions had only primary education. This value decreased to 24% in the mid-1990s. With these considerations in mind, the two authors underline that the factor could not have affected differences in body height in 1965.
This study observed a similar clear dominance of one parameter in the case of father's employment. Almost 95% men who took part in the survey declared working full-time. Despite the observed clear dominance of the most beneficial type of employment, statistically significant differences were observed among girls between cluster V and I, and clusters I, II and IV, in terms of this social variable. This result, while statistically significant, should be considered coincidental due to the small size of cluster V (n=28) and especially due to the fact that girls from families in which the father worked part-time or occasionally or was retired constituted 14% of the sample. With almost 30 participants qualified into cluster V, this percentage value corresponds to only four persons. The conclusion that father's employment is not as important as previously assumed is further substantiated by the low somatic differences that were found between girls from cluster V and girls from clusters I and II (p<0.1) (Fig. 7).
In this study, the percentage distribution of mother's and father's education showed a dominance of master's degree level education (about 62% of mothers and about 55% of fathers) over other education categories, especially over primary or lower education, the frequency of which was only marginal. The percentage shares of other analysed factors confirmed the occurrence of a small number of offspring in the family, satisfactory employment and an usually good material status. All these findings allow the quality of life in the entire sample of 6-year-olds to be considered relatively positive, which leads to the thesis that social stratification of somatic development is gradually diminishing in urban populations and that such populations are becoming more similar in this respect to societies with a high standard of living (Brundtland et al., Reference Brundtland, Liestol and Walloe1980; Cernerud, Reference Cernerud1992, Reference Cernerud1994; Przewęda & Dobosz, Reference Przewęda and Dobosz2003).
It should also be noted that none of the aforementioned social factors affects physical development directly. The factors may only have an indirect effect, which means that each of them affects all conditions related to development or life style. Thus, the family is a complex indicator of conditions that modify the developmental processes of a child either positively or negatively (Przewęda & Dobosz, Reference Przewęda and Dobosz2003). It seems, therefore, that endogenous (genetic and gene-related) factors dominate over cultural factors in the analysed subject area. Wolański (Reference Wolański2005) was well justified in referring to these factors as the determinants and stimulators of development. Further research on the developmental processes in children and youth and further observation of changes in the hierarchy of developmental conditions should be considered an interesting and valuable scientific pursuit.
It is worth emphasizing one point again as part of the conclusions and in reference to the selected publications: mother's education was found to be the leading factor among the analysed conditions for physical development from the perspective of satisfying a child's developmental needs. The importance of mother's education was confirmed by the fact that this study observed its effect on the selected anthropometric parameters in both sexes and that the greatest number of differences between each cluster of study participants was found for this particular criterion. Furthermore, the obtained results lead to the conclusion that the total number of differences between the analysed clusters was relatively low. This observation indicates that the biological effects of social stratification tend to diminish in the environment of an urban agglomeration.
Acknowledgments
This study was conducted under statutory research of the Józef Piłsudski University of Physical Education in Warsaw (No. DS. 139) and was financed by the Ministry of Science and Higher Education.