

INTRODUCTION
The year 2020 saw waves of protests wash over the United States, from nationwide demonstrations of the Black Lives Matter movement, protesting police brutality and systemic racism to protests over the government’s handling of the COVID-19 epidemic, by groups and individuals decrying the economic and social impact of lockdowns and stay-at-home regulations. In Israel too, demonstrations were sparked by the state’s failure to manage the second wave of the coronavirus and grew into anti-government protests in all major cities. While the vast majority of these demonstrations have been peaceful, some have descended into violence. Police have sanctioned the use of a broad range of means for protest dispersal, such as water hosing and pepper and tear gas (BBC News 2020; Haaretz 2020; Hass Reference Hass2020; Hutchinson Reference Hutchinson2020).
Protests are a fundamental aspect of political life in liberal democracies and seen as a core, enabling element for the existence, consolidation, and protection of democratic societies. Citizens in liberal democracies expect the state to actively guard and guarantee this right, while recognizing that this right will be balanced with the state’s need to maintain public order. Despite this understanding, harsh policing of demonstrations is not a unique phenomenon (Office of the Special Rapporteur for the Freedom of Expression and Organization of American States 2019; Council of Europe Commissioner for Human Rights 2020). What might explain the gap between the democratic ideal enshrined in the right to protest and the dire reality in which repressive protest policing is often a rule rather than an exception?
Theoretical and empirical studies have identified a variety of mechanisms explaining the use of excessive force in protest policing: from the macro level, pertaining to socio-ideological factors; through to the meso level, dealing with the structural-organizational aspects relating to the nature of police work; and down to the micro-level analyses that are rooted in the objective circumstances of particular incidents. The explanations offered in the existing scholarship provide significant insights into repressive policing. However, these explanations currently only focus on a single level of explanation—micro, meso, macro, or on a single perspective—either that of the police, the protesters, or the state (Rosland Reference Rosland2008; Hirschfield and Simon Reference Hirschfield and Simon2010; Gerber and Jackson Reference Gerber and Jackson2017). This often leads to linear, binary explanations of causality or blame. It leaves us with a fragmentary analysis that cannot capture the multifaceted dynamics that shape repressive policing as a prevalent phenomenon in our societies.
Our aim in this study is to overcome the fragmentation that characterizes current scholarship in order to better understand repressive policing as a persistent phenomenon. We argue that the current state of fragmentation should not be solved by ignoring explanations of repressive policing but, rather, by finding a way of examining the entire network of explanations simultaneously and in an aggregated manner. Our method for achieving this goal is rooted in listening to the plurality of narratives used by the different actors involved in an event of repressive policing. We argue that such a pluralistic approach to data on repressive policing can help us better understand the multifaceted, complex nature of the phenomenon and elucidate the gap between the normative expectation of democratic protest policing and the reality of repressive practices.
We identify an ideal source for achieving this in the protocols of a commission of inquiry (CoI) that investigated an extreme, large-scale event of repressive protest policing: the Commission of Inquiry into the Clashes between Security Forces and Israeli Citizens in October 2000 (Or State CoI, named after its chief investigator, Israeli Supreme Court Justice Theodor Or). This commission was set up to investigate lethal clashes between security forces and Israeli citizens in October 2000, during which twelve Arab citizens of Israel were killed by police officers from the National Police (specifically, paramilitary units from the Border Guard and special police sniper units) and hundreds more were injured. The Or State CoI is the only Israeli state commission that has dealt with the policing of protests and, more widely, with the state’s treatment of the Arab minority. It is the single most important police-related commission in Israel in modern times, and, as such, it joins similar official endeavors across the world that are aimed at investigating repressive policing (Litmanovitz Reference Litmanovitz2016).
We secured access to the unpublished and understudied protocols of the Or State CoI, which include hundreds of testimonies of police officers, witnesses, victims, and experts (hereinafter Or protocols).Footnote 1 These testimonies, transcribed into thousands of pages of protocols served as our main source of data, providing an unparalleled resource for charting and identifying the different, sometimes competing, explanations of repressive policing presented before the commission in real time representing the different groups of participants in the events. In this article, we develop a computational model of scaled reading that enables a multi-level examination of the plurality of narratives contained within the Or protocols and the official final report of Or State CoI (hereinafter Or report) (State Commission of Inquiry 2003).
Our methodology offers the ability to process and shed light on the huge amount of complex textual data. It manages to “listen” to all the narratives in an aggregated manner without compromising the individual story and its specific context. The scaled reading model allowed us to comprehensively analyze the entire corpus of the commission’s work, which contained hundreds of testimonies of all the parties involved and thousands of pages of the Or report. It innovatively combines a large-scale algorithmic topic modeling of the entire corpus, which identifies types of explanations of repressive protest policing; a mid-scale analysis, which identifies which speaker groups invoke which explanations; and a small-scale reading of the computationally selected “most-representative” testimonies that expose the singular experiences of repressive policing, prying open the “black-box” of the phenomenon.
Bringing together these different practices of textual analysis, our model was able to encompass the multiple perspectives and narratives in the protocols and in the final report without losing sight of the singular point of views of the specific actors. We found that all levels of explanation identified in the literature co-exist in a single event of repressive policing. We also found that no type of explanation exclusively belongs to a specific group of actors in the examined event. Furthermore, we found that this co-existence of mechanisms is present not only within the larger corpus but also within each topic and speaker group, as a characteristic of the phenomenon of repressive policing. Lastly, we propose four insights into how repressive policing plays out: as a non-linear, nonbinary, noncausal, and nonunitary phenomenon, which challenges the established understanding of this phenomenon. Our findings suggest that, at least in the examined context of a deeply divided society, the identified co-existence of mechanisms, coupled with the new insights on the nature of events of repressive policing, can shed light on its persistent nature.
Following this introduction, the second section discusses the mechanisms of protest policing identified in the literature. The third section provides a background on our case study—the clashes between security forces and Arab-Israeli citizens in October 2000Footnote 2 and the CoI that investigated it. The fourth section describes the scaled reading methodology and the aims of each “level” of reading. The fifth section presents the findings of the scaled reading of the Or corpus, followed by concluding remarks.
EMPIRICAL AND THEORETICAL APPROACHES TO REPRESSIVE POLICING OF PROTESTS
Repressive policing relates to a myriad of practices that include the use of violent (lethal and nonlethal) means of containment by police against demonstrators during protest events (Della Porta Reference Della Porta1995; Earl, Soule, and McCarthy Reference Earl, Soule and McCarthy2003; Waddington Reference Waddington2007). As a phenomenon, repressive tactics stand in contrast to democratic ideals, which protests supposedly embody. And yet repressive policing of protests does occur; the contrast between the ideal and the reality has generated inquiry into its causes and consequences (Fielding Reference Fielding1991; Waddington Reference Waddington1994; Winter Reference Winter1998; Reiner Reference Reiner2000; McPhail and McCarthy Reference McPhail and McCarthy2005; Schneider Reference Schneider2008).
In the last two decades, in particular, several researchers have used systematic methods of data analysis to explore significant factors that shape how protests and riots are policed, particularly in the United States (Earl, Soule, and McCarthy Reference Earl, Soule and McCarthy2003; Earl and Soule Reference Earl and Sarah2006; Rafail, Soule, and McCarthy Reference Rafail, Soule and McCarthy2012; Warner and McCarthy Reference Warner and McCarthy2014). Such factors include, for example, which characteristics of the police, the protest, and the protesters are correlated with different levels of force (that is, police presence, legalistic policing, and physical force); how repressive policing is understood and explained by protesters themselves; and how national context and ideology plays into the use of force by police. Repressive policing as a reaction to threat posed by the protest is the common explanatory thread that runs through the literature.
Jennifer Earl and her colleagues (Reference Earl, Soule and McCarthy2003) suggest that the different explanations of repressive policing can be divided into three levels: macro, meso, and micro. Drawing on their typology, we maintain that each of these levels of explanation essentially pertains to a single perspective at which the protest is experienced as a threat: by the state, the police organization, or the police officers on the ground.
Macro-Level Explanations
The first approach in the literature to explaining repressive protest policing takes a macro perspective, which focuses on the state and draws on political science constructs. It assumes that the state will protect the interests of the dominant, elite group in society and suppress any threats directed at it by nondominant groups (Blalock Reference Blalock1967; Jackson Reference Jackson1989; Jacobs and O’Brien Reference Jacobs and O’Brien1998). An influential theory within this category looks to the mentality of the state as a central explanatory mechanism (Della Porta Reference Della Porta1995); it frames the police response as influenced by the state’s ability to govern the different challenging groups taking part in protests (Goldsmith Reference Goldsmith2002). States confident of their legitimacy can afford a degree of tolerance toward dissident protesters, while those whose legitimacy is widely contested will adopt a “zero tolerance” policy toward such protesters (Ellison and Martin Reference Ellison and Greg2000).
An additional explanation for the state’s choice to engage in repressive policing is termed the weakness approach. William Gamson (Reference Gamson1975) claims that the state will only repress movements and groups that it thinks will collapse under pressure because the state’s prestige in the eyes of the public will be put at risk if it fails in efforts to repress protests. This understanding makes weak peripheral groups more vulnerable to repressive policing (Della Porta Reference Della Porta1995; Sprinzak Reference Sprinzak1999).
Meso-Level Explanations
The second approach to explaining repressive policing focuses on the police organization as shaping all aspects of the police response to protests, whether directly through its policies and resources or indirectly through its socialization of the police officers in the field. Studies stemming from this approach, focusing on the US context, identify police (re)training efforts as correlated with a shift to nonviolent protest policing in the late 1970s (McCarthy and McPhail Reference McCarthy and McPhail1998). Another organizational factor associated with the over-all decline in repressive policing is the introduction of an organized permit system (McCarthy and McPhail Reference McCarthy and McPhail1998; Soule and Davenport Reference Soule and Christian2009).Footnote 3
A second set of explanatory factors within this category relates to the resources available to the police organization: their overall budget, adequate equipment for public order policing, and the availability of prior intelligence on the protest event (Earl, Soule, and McCarthy Reference Earl, Soule and McCarthy2003; Fillieule and Jobard Reference Fillieule and Fabien1998; Earl and Soule Reference Earl and Sarah2006). Police officers’ lack of training and lack of experience in public order tasks and inadequate professional equipment for handling protests might heighten tensions and increase the risk to officers, which in turn may raise the probability of repressive protest policing (Waddington Reference Waddington1994).Footnote 4 Yet another set of meso-level characteristics identified includes the police organization’s general past experience—that is, what kind of policies and practices did it deploy outside of public order policing tasks as well as its history of brutality (Earl, Soule, and McCarthy Reference Earl, Soule and McCarthy2003; Vitale Reference Vitale2005).
Micro-Level Explanations
The final body of work refers to factors embedded in these situations, primarily the interactions between the protesters (individuals and groups) and the police officers. The work of the police officer, who has the authority to enforce the law, very often exposes him or her to a high risk of violence at the hands of noncomplying citizens. The issue of threat perception has been central in the criminological literature more generally in attempts to understand the use of lethal police force against citizens (Skolnick and Fyfe Reference Skolnick and Fyfe1994; Jacobs and O’Brien Reference Jacobs and O’Brien1998; MacDonald et al. Reference MacDonald, Kaminski, Alpert and Tennenbaum2001; White Reference White2001). This is also a central legalist argument for determining guilt (or the lack of) in the misuse of lethal force; if an officer was at risk, or felt they were at risk, they are less culpable of using force.
Accordingly, scholars have taken a police-centered approach that examines what police agencies and officers are likely to find threatening during protest events (Earl and Soule Reference Earl and Sarah2006). They highlight the situational threat among police officers and particularly their fear of “losing control” of the protesting crowd (Earl and Soule Reference Earl and Sarah2006; Warner and McCarthy Reference Warner and McCarthy2014). The underlying assumption is that, in their choice of actions, protesters cause the police to feel threatened, and this results in (more) repressive policing. Several salient variables have been identified in this context: the presence of counter-demonstrators; protester-committed property crime and violence; rock, brick, and bottle throwing at the police; protesters’ use of confrontational protest methods; the proportion of use of illegal means and actions in the demonstration; and the size of the protesting group (Earl, Soule, and McCarthy Reference Earl, Soule and McCarthy2003; Earl and Soule Reference Earl and Sarah2006).
These sets of factors identified and empirically validated on all three levels of explanations are critical in understanding the different mechanisms through which protest policing occurs. Looking over the extensive body of literature, it is striking that the explanations do not exclude one another; none of them is more “right” or presented as more prominent. They are static explanatory factors in the sense that it is not clear how they might work together to contribute to the reality of repressive policing. What is missing is a framework that manages to capture the interaction between the different levels of explanations and accounts for their potential co-existence in the complex system of an event of repressive policing. As we will demonstrate, a scaled reading of the Or State CoI dataset allows us not to settle on a single perspective that ultimately obscures the complexity of the phenomenon. Instead, the scaled reading model reveals the co-existence and interaction between the levels: how the individual-level threat interacts with the meso level of the police organization and is in turn attenuated by the socio-political context.
A CASE STUDY OF REPRESSIVE PROTEST POLICING: THE OCTOBER 2000 EVENTS
Our study is focused on the policing of a series of protests and riots known as the October 2000 events, which took place in parallel to (and as a rection to) an uprising of the Palestinians in the occupied West Bank and Gaza (the Second Intifada). Within Israel’s borders, Arab citizens staged mass demonstrations in towns and villages throughout the country. According to police estimates, some sixty to seventy thousand Arab citizens took part in the events from October 1 to October 8, 2000. During the events, main highways and junctions were blocked in the North and Triangle areas (both heavily populated by Arabs), and there was also an attempt by Arab demonstrators to approach Jewish villages and outposts that were in the vicinity of Arab towns and villages. In addition, police stations, banks, traffic lights, and post offices were vandalized and looted (State Commission of Inquiry 2003, part 2). Dozens of Arab communities participated, making it very difficult for the police to respond to all locations. Furthermore, when the police reached one of the protest arenas, they were usually unprepared for the magnitude of the events, outnumbered, and lacking the necessary professional (nonlethal) equipment for public order policing; this situation, in part, led to police opting to use either rubber bullets or live ammunition.Footnote 5 During the violent clashes, paramilitary Border Guard units and special police sniper units killed twelve citizens and a resident of Gaza residing in Israel. Hundreds more were injured from live ammunition, rubber bullets, and tear gas. One Israeli Jew was killed by a stone thrown from a bridge onto his vehicle.
Following the violent events, a state CoI was set up in 2001 to investigate the clashes between security forces and Israeli-Arab citizens. The Israeli law states that a state CoIs will be set up following a government resolution in order to investigate events defined as “a matter of vital public importance which requires clarification.”Footnote 6 The government resolution appointing the Or State CoI stipulated that its mandate was to “investigate the unfolding of the events,” including “the causes that led to these events taking place.”Footnote 7 The Or State CoI broadly interpreted the mandate that was given to it was to consider itself empowered to discuss the roots of the processes that caused or contributed to the lethal events (Gabbay Reference Gabbay2015). To this end, the committee held ninety-two public hearings between February 2001 and August 2002, in which it heard 434 testimonies from politicians, Arab Israelis, police officers, journalists, experts, and citizens, and examined almost forty-three hundred exhibits (Horovitz Reference Horovitz2017).Footnote 8 A central question before the Or State CoI was the legality of the police use of force in the clashes, particularly of lethal force, in accordance with the Israeli Penal CodeFootnote 9 and the Israeli Police Regulations.Footnote 10
The Or Report was published in September 2003, stretching over eight hundred pages (State Commission of Inquiry 2003). In its concluding remarks, the report states that “[t]he events of October 2000 shook the earth” (part 6, para. 3). The report offers a dire assessment of the conflicted relations between the Israel police and the Arab citizens. Moreover, it traces the systematic and protracted discrimination by the state against its Arab citizens since its establishment in 1948 (part 1, para. 18; see also Horovitz Reference Horovitz2017). In its final recommendations, the Or State CoI called on the state to open criminal investigations in all cases of fatal shootings of civilians by the police (State Commission of Inquiry 2003, part 6, para. 11). However, these recommendations resulted in little action, leading to zero indictments of officers involved in the shootings.Footnote 11 Moreover, while the Or report had subsequent influence on police organizational regulations regarding the means of protest policing, the commission did not have any significant political or social impact, with most of the high-ranking officers and politicians who had been warned by the commission remaining active in the political and professional sphere (Gavison Reference Gavison and Lavie2010).
Two decades after the October 2000 events, the Or State CoI, its report, and its recommendations are mostly forgotten; this is perhaps most evident in the riots that broke out across Israel in May 2021 as we were completing the work on this article. Academic research has also mostly ignored the Or State CoI, with only a handful of studies trying to assess its socio-legal role (Gabbay Reference Gabbay2015; Horovitz Reference Horovitz2017). This fate is in line with other CoI around the world, which have tended to fall into oblivion, leading to minimal social or political reform (Ashforth Reference Ashforth1990; Parker and Dekker Reference Parker, Dekker, Boin, McConnell and Hart2008). This article departs from the traditional examination of the impact of CoIs, utilizing them instead as a data source for examining diverging explanations of repressive protest policing and furthering our understanding of this widespread phenomena.
The Or State CoI provides a rare opportunity to analyze a real event, complex in nature, unfolding over several days and locations, across multiple fronts, involving many groups of protestors from across the country and a large variety of police units. These unpublished and understudied protocols are a unique dataset in public law that merits examination. The narratives within the dataset include not only the perspectives of officials selected by the government but also those of the different actors who partook in the process of inquiry. Moreover, it is an exceptional corpus of oral testimonies given by police officers of all ranks who took part in the policing of the events, from the field officers to high-ranking command officers. As such, its data offer an extensive variance of perspectives, positions, and narratives on a single event.
METHODOLOGY
In order to better understand repressive policing, we aimed to analyze the entire Or corpus. While the Or corpus presents an unparalleled opportunity to study an event of repressive protest policing, it exceeds a readable scale. In order to model the data, we developed a methodological approach of scaled reading, which drew on novel computational text analysis techniques. The scaled reading approach enabled us to process and shed light on a huge amount of complex textual data without resorting to a fragmentary, uni-perspectival analysis.
Scaled Reading: Computational Modeling of Narrative-Based Datasets
With the explosion of digitized textual legal resources and advances in computational natural language processing, scholars have begun to apply automated content analysis to the study of legal texts (Livermore and Rockmore Reference Livermore and Rockmore2019). Applying computational methods to the reading and analysis of legal texts, or, in other words, treating textual narratives as data, affects the way in which scholars read these texts (Grimmer and Stewart Reference Grimmer and Stewart2013; Nguyen et al. Reference Nguyen, Liakata, DeDeo, Eisenstein, Mimno, Tromble and Winters2020). Performing distant reading, scholars read texts based on analysis of statistics (Moretti Reference Moretti2000, Reference Moretti2013). The “reading” of the text is actually performed by the machine using a series of algorithms. Distant reading approaches to narrative documents holds the potential to expand our understanding beyond the human and readerly scale, which is inherently constrained by scale and therefore remains limited to a relatively small selection of texts. This approach, however, risks losing sight of the narrativity that defines testimonial documents.
Traditionally, narratives are extracted and imbued with meaning through a practice of close reading. Borrowed from literary criticism, close reading refers to the careful, sustained interpretation of a brief passage of text, which is selected out of a handful of testimonies. As the mirror approach of distant reading, close reading carries the polar opposite risk; it risks remaining tied to a certain limited perspective—that of a specific officer or a specific witness, which is ultimately anecdotal. The Or corpus, with more than two million words, exceeds the bounds of existing methods of analysis. For this purpose, we developed a dynamic reading model for analyzing the entire data from the Or State CoI in an aggregated manner, while also zooming in on unique narratives of the participants in the event. In legal scholarship, few attempts have been made thus far to bridge the gap between close and distant reading (Keydar Reference Keydar2020).
Our model synthesizes familiar humanistic approaches of close reading with computational distant reading. The proposed scaled reading model moves between three scales of analysis: large scale at the corpus level, mid-scale at the topic level, and small scale at the document level. Each of the three stages is essential to the model’s aims. They each stand alone in providing new insights on the data. The strength of the scaled reading approach is in combining these three discrete analyses into a single, coherent model. We now turn to describing the methodology of each distinct level.
Large-Scale Reading
The aim of the first level is to identify the main themes that emerge from the Or corpus. This is the first stage in modeling the data, and it provides a systematic overview of what took place during the October 2000 events. For this stage of analysis, we employed a technique of topic modeling (Blei, Ng, and Jordan Reference Blei, Ng and Jordan2003). Topic modeling is an exploratory technique that is useful for imposing order upon large bodies of textual data. The model captures the latent semantic structure behind a text collection. As such, topic models are especially suited for insight-driven analysis, particularly given the interpretable nature of their output—that is, a list of words (Nguyen et al. Reference Nguyen, Liakata, DeDeo, Eisenstein, Mimno, Tromble and Winters2020) rather than binary or numerical outputs (Law Reference Law2016). Topic models are attractive because they offer a way to expose a corpus’s themes by discovering groups of words that often appear together in documents. These groups of words are given the namesake “topics” (Blei Reference Blei2012). By a topic being “about” a theme, we mean that those distributions over the vocabulary of the corpus place high probability on words that a domain expert would interpret as being related to the subject (DiMaggio, Nag, and Blei Reference DiMaggio, Nag and Blei2013).
Topic models are especially adequate for the analysis of complex narratives, such as testimonies as well as for other free-form legal texts.Footnote 12 Additionally, unlike qualitative analysis, which is based on information retrieval, in which researchers know in advance what they are looking for, the computational model is not based on preconceptions of what the topics “should be” about. Extracting the Or corpus’s main themes using a topic modeling approach allows us to crystallize the dominant explanations of repressive policing that emerge from the testimonies. The strength of our approach is that it does not impose the existing explanations of repressive policing on the data. Instead, only once the computational model has identified the topics can we examine how these findings relate to the established explanations found in the literature. This type of data-driven analysis reduces the risk of bias that comes with setting out with a particular perspective or research perception.
Mid-Scale Reading
In the second reading level, we scale down from the corpus level to the topic level, detecting—for each topic—the speaker group that is most associated with that topic. The aim of the second level is to further our comprehension of how the repressive policing event is understood and explained by the different actors that participated in the October 2000 events. For this purpose, we identified and labeled the four main speaker groups in the protocols: “Arab” (including witnesses and victims as well as political representatives, which totaled 128 speakers), “Police” (from rank and file up to the chief of police, which totaled 183 speakers), “Other” (ministers, journalists, experts witnesses, which totaled fifty-five speakers), “Judge” (interjections of the three commissioners during the proceedings).Footnote 13 As part of the mid-scale reading, we also considered the files of the Or State CoI’s final report as representative of an additional speaker group: the state-appointed investigative body (State Commission of Inquiry 2003). Unlike the individual speech acts by the commissioners during the proceedings (which were separately labeled as “Judges”), the report represents a unified perspective of the official COI and so was labeled separately as “Report.”
Small-Scale Reading
In the third reading level, we zoomed in further to analyze individual narratives of protest policing: how the October 2000 events were experienced and understood by the different actors. In this stage, the mechanisms of repressive protest policing were explored using a close reading, which was guided by the finding of mid- and large-scale reading. A core element of this stage was our ability to focus on documents that are archetypical of the topics rather than anecdotal. For this purpose, we developed a statistical model that allowed us to identify the documents that best represent each topic. We selected the documents that were not only characterized as having the highest topic probability for any given topic (that is, the document that includes the highest “concentration” of the topic) but also—because this could be an outlier of either the text or the algorithm—the document that best represents how the topic regularly “behaves” in relation to all other topics within the corpus.Footnote 14
Using this process of selection, the small-scale reading anchors the choice of which texts to examine and interpret as reflective of the entire topic. This method helps focus our analytical attention on a small set of computationally identified texts, overcoming a central challenge in dealing with large narratival corpora. The small-scale reading method provides a more robust basis for the selection process, diminishing the risk of anecdotal evidence. Thus, “[c]omputational methods can help us with the empiricism that is crucial to accurate close reading” (Eve Reference Eve2019, 349). Moving back and forth between the computational topic modeling of the large-scale analysis and the mathematically assisted small-scale qualitative analysis, the three-tiered scaled reading model overcame the distant/close reading dichotomy that dominates contemporary scholarship in computational text analysis. It allowed us to combine the strengths of each of the methods so that we could identify large-scale patterns in the corpus without losing sight of individual voices and stories.
FINDINGS FROM SCALED READING OF THE OR CORPUS
Following the procedures described above, we analyzed the protocols of the public testimony sessions of the Or State CoI (greater than 1.5 million words) and the six parts of the Or Report (greater than 240 thousand words).Footnote 15 We initially performed pre-processing steps on the corpus, which are required for any meaningful computational analysis.Footnote 16 In addition to the usual challenges and requirements of preparing a large-scale textual dataset, we faced the additional challenge of working with a Hebrew language text, which has not been previously done in the context of legal testimonial analysis.
Findings from Large-Scale Reading: Topic Modeling Analysis of the Corpus
As part of the topic modeling analysis on which this level centers, we first needed to set the number of topics that would appear in the final model. Topics in this type of computational analysis include groups of words that are most likely to appear together in a corpus. Based on the relative size of our corpus, the repeated occurrence of key topics, and the level of interpretability, which was tested on different K values from five to twenty, we ultimately chose a fifteen-topic composition. Figure 1 includes the output of this analysis: fifteen topics, each topic represented by its twenty most prominent words.Footnote 17
Topic modeling of the Or corpus presented by clusters, topic names, and the twenty most prominent terms per topic.

Examining the lists of words, it becomes apparent that the words in each topic do not necessarily relate to each other lexically—namely, these are not terms that “naturally” belong in the same semantic sphere (for example, lists of colors, names, fruits, and so on). The model, nonetheless, indicates statistically that these words belong to the same discourse or cluster of meaning in terms of their chances of appearing together in the same document. Our aim in the interpretative process of the statistically driven grouping is to decipher the semantic meaning of these groups of words based on our expert knowledge. To increase the validity of our interpretative process, each of the authors named each topic independently, based on the list of words. We then compared our interpretative outputs of named topics and arrived at a shared final agreement on the topic name. The outcomes of this process are reflected in Figure 1, which includes next to each cell of word lists the name given to that topic.
The potential of using topic modeling for this form of thematic analysis is exemplified in our analysis and naming of topic 1. The topic is seemingly characterized by an unrelated—meaningless—list of words. However, when we examine it through a lens of expertise (that is, our prior knowledge of the October events), the words gain a shared contextual meaning. These are all nouns that are “places holders” of the events themselves: junction, road, vehicle, village, police station, shooting, and gas. Reading the topic in this vein, one can “see” the scene of a riot unfolding. We thus named this topic: “Incidents: descriptions.” All fifteen topics were named in this fashion, as we constructed—topic by topic—the semantic universe of the Or corpus (see “topic names” rubrics in Figure 1).
Following the process of naming each topic, we moved to trace common threads connecting the topics into overarching themes, which we refer to here as “clusters.” This interpretative stage allowed us to discern how these thematically grouped topics (that is, clusters) resonate with the types of explanations of repressive protest policing found in the literature. We briefly describe the five clusters identified: political, incidents, shooting, police work, and commission work as well as the topics that each cluster comprises (see “clusters” rubrics in Figure 1).
The political cluster includes two topics: “Arab political life” (topic 0) and “Arab-Jewish divide” (topic 9). These two topics include words that are descriptors of political activity related to the Arab-Palestinian sector in Israel. Topic 0 includes words referring to disputed holy locations (for example, Al-Aqsa Mosque, the holiest mosque on temple mount that is implicated in the onset of the events)Footnote 18 and words alluding to Palestinian political entities (for example, the High Follow-Up Committee for Arab Public in Israel, the national coordinating and representative body for Palestinian citizens of Israel). Topic 9 includes words that accentuate the ethnic nature of the conflict (for example, Jew, Arab) as well as words relating to the political arena in which these contested identities are negotiated (government, citizen, public, minister).
The incidents cluster includes four topics: “Incident: descriptions” (topic 1), “Incident: actions” (topic 2), “Incident: Jaffa locality” (topic 5), and “Incident: localities” (topic 7). These topics all consist of words relating to different aspects of the violent events of October 2000. Topic 1 is characterized by nouns describing scenes of events (see above), while topic 2 is laden with verbs alluding to actions in the scene (for example, saw, went, came, spoke, stood, threw). The two remaining topics contain words relating to either specific geographical locations in which the protests occurred (for example, Jaffa, Fureidis, Jisr-a- Zarka, Zichron Yaacov) or more general place names (for example, entrance, restaurant, street).
The shooting cluster includes three topics: “Shooting: police angle” (topic 4), “Shooting: sniper angle” (topic 8), and “Shooting: testimony” (topic 11). All these topics describe with more granularity the incidents in which lethal use of force was exercised during the protests, including technical terms relating to shooting events (for example, rubber [bullets], sniper, assault rifle) or organizational terms referring to special units deployed in the shooting incidents.Footnote 19
The police work cluster includes three topics: “Police: means and weapons” (topic 10), “Police: command” (topic 13), and “Police: field” (topic 14). This cluster covers the different aspects of police work during the October 2000 events and their aftermath, from words denoting police activity on the ground (policeman, commander, resident), to technical terms relating to means of protest policing (rubber [bullets], [tear] gas, weapon, meter), and to names of position holders in the police command and the political oversight bodies.Footnote 20
Finally, the commission work cluster includes the three topics relating to the work of the Or State CoI itself, its procedures, and its legal framework: “Commission work: administrative” (topic 3), “Commission work: proceedings” (topic 6), and “Commission work: testimony” (topic 12).
Once we completed the process of naming and clustering, we moved to compare the thematic clusters to the established empirical and theoretical explanations of repressive policing in the literature. We found that four of the thematic clusters we identified—political, police, incidents, and shootings—map onto the micro, meso, and macro mechanisms of repressive policing. Loaded with the terminology relating to ethno-social political identities and the Arab-Jewish conflict in Israel, the political cluster echoes macro-level ideological explanations for police use of force in a deeply divided society (Hasisi Reference Hasisi, Avnon and Benziman2010). The police work cluster, which describes aspects of police work, the police’s means and weapons, as well as the nexus between Israel police and the political echelon, aligns with meso-level explanations regarding the influence of organizational characteristics on police use of force. Two clusters—incidents and shooting—which consist predominantly of factual aspects of specific violent incidents between police and protestors, can be seen as expressing the micro level, circumstantially rooted explanations of repressive policing.
Overall, the large-scale analysis offers an overarching view of all the explanations offered by the participants in the repressive policing event. The analysis indicates that the three levels of explanations—macro, meso and micro—are all in play within the studied event of repressive protest policing. They are all simultaneously invoked as credible explanations for police use of force. Based on the topical analysis of the testimonies of participants, we found that repressive policing is a product of all three levels of mechanisms; a single level of explanation cannot suffice.
Findings from Mid-Scale Reading: Connecting Speaker Groups to Topics
After mapping the thematic composition of the Or corpus, we sought to further understand how the repressive policing event is understood and explained by the different groups of actors that participated in the October 2000 events. This will allow us to assess whether the multitude of explanations uncovered in the large-scale reading are not simply a product of the diversity of the interviewees in the dataset, who each have their unique perspective. In order to identify which speaker group invoked which type of explanations for repressive policing, we classified topics based on speaker group identities. In practice, we assessed two questions: First, if each topic represents a narrative of a single group or whether we can identify within each topic different group perspectives and, second, if there were topics that more clearly “belonged” to a certain group.
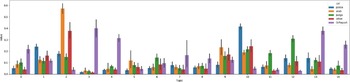
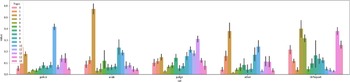
The findings of the mid-scale reading stage are described in Figures 2 and 3. They show, first, that multiple speaker perspectives co-exist within a single thematic cluster. In other words, the thematic clusters we identified are not homogenous in their origin. Second, they show that, within each participating group, speakers refer to different types of explanations in their testimonies—that is, they are not homogenous in their perspective.
Topic distribution based on speaker group identities. Each bar shows the prevalence (Y-axis value) of the topic within the documents associated with that speaker group.

Topical composition of each speaker group. The bars display the distribution and prevalence (Y-axis value) of topics for each of the five speaker groups.

Figure 2 displays the topic distribution based on the classification of speaker groups. As can be seen from the graph, each topic originates from several speaker groups. Topic 1 and 2, which are comprised of nouns and verbs describing the incidents, originate from two speaker groups: the police and Arabs respectively. This means that the testimonies of police officers take on a descriptive stance, while the testimonies of Arab witnesses are characterized by active words. Different explanations may account for this divergence: legalistic (police officers may have directed their testimonies away from their actions to more neutral descriptions); sociological (Arab witnesses relate their experience in a subjective first-person voice); and linguistic (Arab witnesses mostly did not speak in their native language leading to a different linguist structures). These hypotheses are outside the scope of our analysis but should be tested in future research.
Beyond these hypotheses, what can be concluded is that this incident cluster, identified in the previous reading stage as corresponding to a micro-level type of explanation, is representative of at least two speaker groups—the Arab group and the police. This finding indicates that micro-level factual explanations of repressive policing are not exclusively used by one group or another. The political cluster also shows a striking divergence in the group perspectives composing it. Topic 0—“Arab political”—is invoked most dominantly by the Or State CoI in its final report. Topic 9—“Arab-Jewish divide”—on the other hand, originates from the testimonies of Arab witnesses. What we can see is that both the Arab group and the state touch upon issues relating to political identities (perhaps in very different ways, as will be examined in the next stage), while police officers, as a group, contribute the least to this macro-level type of explanation.
In addition to the heterogeneity of perspectives comprising each thematic cluster, we also found that each participating group is in itself not homogenous in its explanations. As Figure 3 shows, each speaker group is tied to topics across the clusters—that is, invoking the three levels of explanations (macro, meso, micro). For example, we found that for the police speaker group the dominant topics are 10 and 1, indicating that witnesses associated with the police spoke in their testimonies both of explanations relating to the incidents themselves as well as to organizational matters, dealing with the types of means and weapons used for protest policing.
To conclude, the thematic clusters we identified—understood as corresponding to types of explanations—are not connected exclusively to a single group perspective. It follows that the different types of explanations of repressive policing are used by all participating groups (the police, Arabs, commissioners, and the state). While the finding from the large-scale stage could have been an artifact of each actor’s perspective (state—macro; police officials—meso; police and protestors on ground—micro), the mid-scale analysis reveals this is not the case. All actors explain repressive policing as a product of multiple factors on all levels of explanations from macro to micro.
Findings from Small-Scale Reading: Analyzing Representative Testimonies
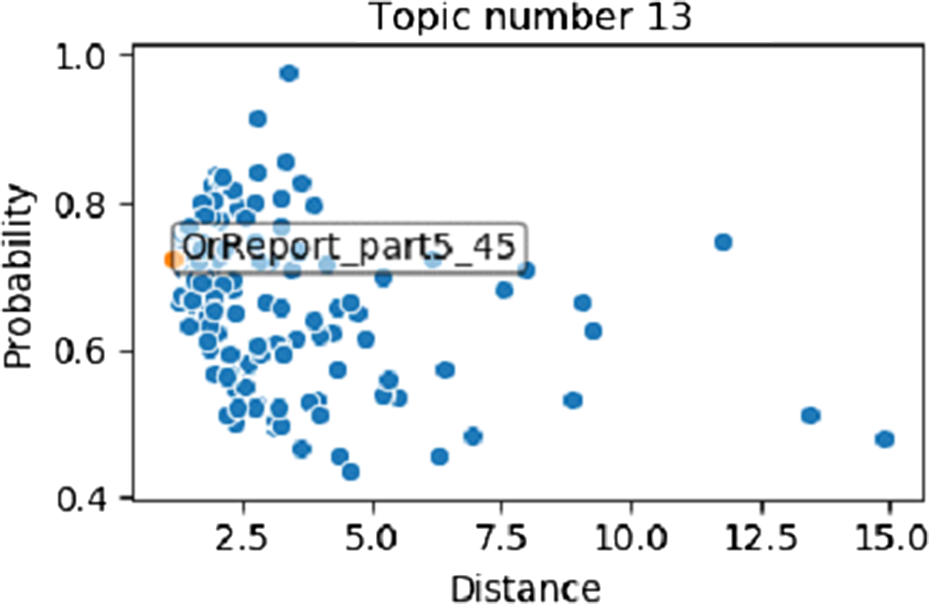
The small-scale analysis builds on our newfound understanding from the previous two stages that the October 2000 events were a consequence of all mechanisms that drive repressive policing. We now seek to gain further insight into the events by moving from the corpus level to the level of the individual experiences. Guided by the topical analysis of the large-scale reading and the speaker group analysis of the mid-scale reading, we identify in the small-scale the most representative documents in each of the fifteen topics using a nearest centroid model. Figure 4 illustrates the method for identifying the document according to our centrality model.Footnote 21 Given the proximity of ranking and to avoid arbitrariness and anecdotal analysis, we selected for our small-scale reading the three top-ranking documents for each topic.Footnote 22
Most-representative documents of Topic 13 as calculated using the nearest centroid model. Each document is represented as a dot in the plot where the y-axis is the probability and the x-axis is the distance from center; the nearest-centroid document is the one most to the left, where the distance is lowest (put in the caption of the figure for only one topic).

Examining the triads of documents, we found support for the findings of the algorithmic model in the identifying features and contents of the selected segments: the three documents chosen for each topic have much in common in terms of speaker identity and contextual and thematic relevance. For example, for topic 2, all the testimonies belong to Arab speakers that are describing violent incidents as witnesses. For topic 10, the three most representative documents are all testimonies of a specialist riot police unit. They were all in the scenes of repressive policing incidents and are describing the use of repressive policing means.
When reading each triad of documents, we were guided both by existing research on repressive policing and by the findings from the previous two levels approaching the segments as an intersection of the two axes: the topic (theme) and the speaker group (group identity). We sought to explore how mechanisms of repressive policing identified in the literature played out in the singular experiences of specific actors in the context of the October events. What our small-scale reading reveals is that, within each triad—whether it be testimony by witnesses, interjections by commissioners, or segments from the final report—different mechanisms contributing to use of force co-exist and even compete. Speakers dynamically shift between types of explanations in their attempt to make sense of the violent clashes between citizens and the police.
We present the analysis we conducted on topic 10’s most representative documents to illustrate this point. As noted, the triad of testimonies in topic 10 includes members of Yasam, the designated riot unit of the Israeli police. All three officers expressed a sense of being overwhelmed by the exceptional intensity of the protests. Edri, the team commander in a riot squad of the northern district, describes the scene as “a war.”Footnote 23 Ankonina, a commander of a riot squad in the south (called up north to respond to the protests), states: “Stones, Molotov cocktails, objects, masked men began to approach” (Or Protocols, session 16). Cohen, also a team commander in the northern district, expresses a similar shock and clearly explains how unusual these events were: “[B]oth in the army where I was an infantry fighter and as a police officer, this is the first time a Molotov cocktail has been thrown at me, this is the first time I have been shot at.”Footnote 24
However, the witnesses go beyond the micro-level explanations of the circumstances of the incidents. The three officers highlight the effects of inadequate policing of the protests on their responses on the ground and their ability to contain the protests. The commissioners are probing the officers’ choices on the ground, demanding to understand why policies that are seemingly supposed to curtail repressive use of force were not implemented. Cohen, for example, is asked why he did not used plastic riot shields, which would have allowed police to stay protected and thus use less lethal force:
Cohen: “Thousands of people, thousands of bottles, thousands of stones were thrown at us, Molotov cocktails, shooting, I cannot be static and stand and absorb, it is impossible.”
Commissioner Shamir: “They issued you this mean, was it included in the training in some form, were you told when it should be used, when not?”
Cohen: “It is there, we know how to use it, that’s it. We were not asked by the unit command to use it, that’s all.”Footnote 25
In the same vein, Cohen also contests the adequacy of the policy regulating opening fire only with explicit permission from a commanding officer (in this case, him): “There were times when teams were left alone because I was not next to them, so a person who finds himself in a situation where he has to shoot means, he will not come and call me, … it is a situation that is impossible.”Footnote 26 Ankonina also takes issue with the firing regulations but from a different perspective. As a senior commander issued with a long rifle, he was allowed and perhaps even expected to use live ammunition against protestors, but he argues that this policy is inadequate and could actually lead to more severe repressive policing: “[I] do not see myself conducting the fighting through [rifle] sights. I have my fighters, I have the team commanders, I manage the fighting. Once I’m with a long weapon, I do not think I can conduct the fighting the way I want it to be.”Footnote 27
The officers challenge the policy framework they were forced to operate within, expressing anger at the police organization that left them on the ground with irrelevant rules for the use of force. Edri voices dismay that, despite the severity of the riots the senior command continued to communicate their expectation to officers on the ground: “‘[B]e calm, restrain, do not act, hold back a little and a little more.’ And it’s very difficult for me as a person, when I’m constantly attacked.”Footnote 28 We see here how organizational policies—classified in the literature as meso level mechanisms—that seemingly were put in place to reduce the risk for repressive policing might on the ground have led to the opposite effect, by failing to provide the commanders with the appropriate means and tools to respond to events.
Interweaved into the micro and meso levels emerging from the testimonies are the ethnic tensions underpinning the October events. Despite going out of their way to reject any allegations of racist or differential policing, the officers cannot ignore the ethnic dimensions of the clashes, expressing fear and even anger at Arab citizens as a differentiated category. Edri shares that although he is “a man of the law and I am supposed to serve … I am more alert … much more alert [since] the incident with the shooting” when going to police Arab localities.Footnote 29 And Ankonina voices his disappointment with the Arab public: “[I]t is even insulting; I give my personal phone number (to Arab citizens in my precinct) which I do not always do … and in the end they say I wished them death.”Footnote 30
Another macro level aspect is contained within this triad of testimonies. The police officers do not narrow their argument to the personal danger they experienced (micro-level mechanisms). The officers’ perspective is that—as the police—represent the state’s interest in protecting itself: As Cohen states, “[a]s a policeman it is my job to uphold the law. … When people riot—a stone of a Jew and a stone that an Arab threw hurts equally, so every person and no matter who he is, what is his ethnicity, once he does not obey the law—he should not expect it to go unpunished.”Footnote 31 The argument is distinct from that of an officer faced with a suspect in a dark alley claiming her decision to shoot was reasonable. Resonating with the state mentality hypothesis, the officers argue on behalf of a state that must protect itself against challenges to its legitimacy.
A systematic analysis of the data in such a manner exposes how the identified co-existence of all mechanisms of repressive policing is present not only within the larger corpus but also within each topic and speaker group, as a characteristic of the phenomenon of repressive policing.
Insights from the Aggregated Analysis of the Scaled Reading Model
Bringing all the levels of reading together affords us the opportunity to further transcend the partial, perspectival view of the phenomenon of repressive policing and see how the co-existence of mechanisms undermines the established understanding of repressive policing and adds new dimensions for analyzing its complexities. We find that repressive policing—in the context of the Or corpus—does not hold up to the existing categories and logics found in the literature, which assume linearity in the progression of protest events, correlation between situational factors and police response, binary constructs of policing approaches, and a unitarian mentality of organizations and the state. Macro-level explanations, for example, assume that a state with unconsolidated legitimacy will contribute to repressive policing. Meso-level mechanisms assert that poor training or a low budget is correlated to repressive practices. The micro-level perspective puts forward the hypothesis that too many protestors or too few police can explain the use of force.
Our analysis exposes how the categories and logics that we currently employ to explain repressive policing are meaningful but not sufficient. Emerging from the data on the October 2000 events is the understanding that repressive policing does not fit neatly into these categories and logics and instead manifests as a nonlinear, noncausal, nonbinary, and nonunitary phenomenon. Uncovering these characteristics of protest policing events can shed light on the persistence of the phenomenon. Without a clear understanding of repressive policing, there is little chance of responding adequately to this challenge.
The manifestation of nonlinearity can be found when examining the three most representative documents in topic 2—“incidents: actions,” which all belong to the Arab protestors that participated in the events. Kopti, Abu Shakra, and HebeFootnote 32 recount shooting incidents in different locations, claiming to have suffered police brutality or witnessed it from up close. In all three testimonies, Chairperson Or is questioning the witnesses, asking if they threw stones or witnessed stone throwing on the police.Footnote 33 In response to Chairperson Or’s questions, we are confronted with the Arab witnesses’ claim that it was a provocation from the police that led to the escalation: “People passed by, some of the people who were in the (protest) procession, passed in front of the house, suddenly policemen … started firing rubber bullets and teargas bombs at them” (Kopti);Footnote 34 “I saw some young people approaching the road but they did not throw stones. Suddenly, after about a quarter of an hour—half an hour, fifteen-twenty policemen from the Border Guard came to us, shouted, told us to enter the house” (Abu Shakra).Footnote 35 Moreover, the witnesses either explicitly negate the accusation of dangerous behavior which provoked police use of force: “[T]here was no real danger to the policemen to shoot people” (Kopti),Footnote 36 or claim a simultaneous, rather than linear, chain of events: “The policemen fired rubber bullets and the young men threw stones” (Hebe).Footnote 37
While each witness gives a different explanation for the eruption of violence, all of their narratives cannot be easily fit into an explanation of police use of force that is the result of a linear progression of the events. Instead, the witnesses describe a more circular event: “When I went up, I did not intend to throw stones, but when the police started cursing the Prophet Muhammad and Islam, I got angry and started throwing stones” (Hebe).Footnote 38 Even when admitting to throwing stones (a factor that, in the literature, is tied to police choosing to respond with repressive policing), the witness “complicates” this explanation by rejecting a uni-directional version of the events.
Manifestations of noncausality can be found in the triad of the most representative documents of topic 1 – “incident: descriptions,” which are testimonies by police officers who were sent to police the protests. The three testimonies that were identified by the model are indeed rife with descriptions of violent clashes. The police officers portray in their testimonies difficult conditions and objective indicators in the scenes that supposedly justified the use of force, based on threat perception, and distinctly express a sense of real and imminent danger to their lives. Mualem, an intelligence officer in a northern urban police station, recounted in his testimony a violent riot in nearby junction, which he described as a “state of war”: “An indescribable number of rioters, throwing everything, iron bars, stones, everything possible, traffic lights, whatever could have been thrown, was thrown at the cops.”Footnote 39 Mualem explains how a change in the circumstances led to a decision to use tear gas against the protestors: “At this point the rioters decide to reduce range to us and we felt we were in danger, and we fired gas at the rioters. … I would like to point out, your honor, that during the events we were in real danger to our lives.” And he adds: “[Y]ou see in the eyes of the people, in their reaction, in their determination that they want to hurt the cops anyway … to harm the police.”Footnote 40
Similalry, Algrisi, chief of another urban police station in the Northern district, also describes the violent nature of the protest: “[A]bout two thousand people who left the village. Throwing stones, bottles, uprooting safety fences, destroying everything that was in the way.” However, Algrisi states that “we for our part … allowed them [that is, allowed the rioters to continue], as long as there is no danger to do whatever they want along this section.”Footnote 41 Here, we see how the two police officers’ descriptions of extensive violence perpetrated by the protestors led to different responses: in the first case, lethal policing means are used and, in the second, they are not.
Further illustration of this point can be found in the fact that some of the shooting incidents did not occur as part of the mass, out-of-control demonstration, or took place in their outskirts. For example, the Or State CoI recommended that the shooting of two young man in Arabe village be investigated, as the evidence suggested they did not take part in the riots (State Commission of Inquiry 2003, part 3). In Nazareth, snipers shot at a car eighteen times though it was far from the area in which the protests had taken place, leaving the women passenger crippled. The commission did not make any recommendation in this case as it was being prosecuted by the Police’s Internal Investigations Unit (part 6).
Within this same topic (topic 1) we also identified nonbinary manifestations of protest policing. In this topic alongside their descriptions of unrestrained clashes, all three officers portray attempts at dialogue with the local representatives from Arab villages in their jurisdiction; these attempts to calm the rioters were sometimes successful, and sometimes not. According to Mualem, one of the dignitaries asked him to give the village permission to “just burn some tires so … we will also appear in the headlines.” Mualem adds that it was “an excellent conversation with the dignitaries of the village, and for us it was quiet in our villages.” He concludes by praising the villages for not participating in the riots.Footnote 42 Algrisi, likewise, describes a fruitful dialogue: “After this incident, that same evening I spoke with the head of the council and his deputy, we asked to calm the spirits. We kept our distance…. The smaller the friction with the population, the smaller the riots along this road.” The third officer, head of a detective branch in a central investigative unit, likewise describes how between waves of violence, in each period of calm, the police “tried the subject of conversation.”Footnote 43
From this constant oscillation between violence and dialogue with dignitaries, we see that binary categories of democratic, dialogue-based protest policing, and harsh, repressive policing are not necessarily mutually exclusive. The “police command” topic (topic 13) manifests the nonunitary nature of the state when dealing with repressive policing. The three most representative documents are segments from the final report, which represents the voice of the state in scrutinizing use of lethal force in the October events. In all three of these segments, the report assesses the responsibility of the top ranks of the police and political establishment: how well they functioned; the police’s commanding stratum level of preparedness; assessments of risk levels; the communication between police and political echelons; and the adequacy of policies for dealing with the events. Looking at the three segments together, we find that the Or State CoI locates the responsibility not with the political echelon but, rather, with the police organization that was ill-prepared. This factor, according to the report, is what led to the overuse of force and to casualties. Unsurprisingly perhaps, considering this is the “voice” of the state, the final report finds that the state did not fail and, in fact, exercised its prerogative as it should have.
A central question the report deals with is how important it was to keep the roads open, based on the assumption that some use of force at least was related to the decision to push back the rioters and maintain free passage. The state’s prerogative to rely on the use of force in order to face the challenge to its authority by the Arab protesters blocking its main roads is declared openly:
The political echelon was entitled, and perhaps obliged, to take these implications into account. It was entitled to take into account the severe damage to public confidence in the state’s ability to enforce law and order in view of the sights seen on 1.10.00. … The political echelon was allowed to take into account the need to prevent the infiltration of a message, according to which the use of tools such as blocking major pathways for long periods of time is a worthwhile thing and an effective way to put pressure on decision makers.
…
The directive was given for this purpose emphasizes dedicating efforts to open the road. … the Police Command did not understand, nor did it intend to understand, that permission to restrain and use force indiscriminately was granted, whatever the consequences. (State Commission of Inquiry 2003, part 5)
This excerpt captures the dynamic and contradictory message of the Or State CoI in regard to justifications for police use of force. It highlights, on the one hand, the entitlement of the state to use its legitimate force to establish authority and, on the other hand, the illegitimacy of the interpretation of this authority, by the police, as an excuse to use force.
This topic echoes explanations from the macro-level literature on weaknesses and strengths of the state as an explanatory factor in repressive policing. It deals with the question of whether to tolerate the threat to its governability (that is, the blocking of major roads by protestors) or to respond by use of force. On the one hand, this is exactly what we see playing out—the narrative of a state is one of a country that is facing an intimidating minority and is protecting itself. However, while the literature talks about the mentality of the state in predicting if the state will allow protests or repress them, what emerges from the data is that we cannot speak of a stable, fixed, or unitary “mentality of the state.” Instead, we see a division of “state mentalities”: the political echelon portrays itself as protecting the state against a minority threatening governability; it simultaneously expects its proxy—the police—to see the same minority as citizens deserving democratic policing.
CONCLUDING DISCUSSION
In the article, we have sought to overcome the fragmentary explanations of repressive policing identified in the literature in order to better understand this persistent phenomenon, which undermines the foundations of democratic societies. We have developed a computational model of scaled reading that has enabled a multi-level examination of a unique textual dataset. The vast body of protocols and reports of the Or State CoI offered us an opportunity to examine an extreme episode of protests from the points of view of all actors involved in the events and their aftermath. To the best of our knowledge, it is the first attempt to examine protocols of an investigative body in such a comprehensive manner, which captures the corpus as a whole without losing sight of individual testimonies.
The large-scale analysis of the dataset reveals the presence of all three level of mechanisms previously identified in the literature—macro, meso, micro—within the studied event. Furthermore, in the mid-scale analysis, we find that the simultaneous existence of all levels of explanations is not an artifact of the diverse speaker composition of the corpus. All speaker groups—police, Arabs, and the Israeli state—construe the violent clashes using all levels of explanations. We find this dynamic, multifaceted construction of the protests also exists at the level of individual testimonies, which we assessed through the triads of representative documents in the small-scale analysis. Understanding repressive policing as a product of all mechanisms operating simultaneously helps us to make sense of the persistence of this phenomenon, despite being juxtaposed against societal values.
Furthermore, our analysis of repressive policing—in the context of the Or corpus—challenges existing categories and logics found in the literature. We have found manifestations of repressive policing as a nonlinear, noncausal, nonbinary, and nonunitary phenomenon. What we learn from these findings is that the theoretical categories that we currently use to understand repressive policing are not sufficient as long they remain fragmented and void of a unifying lens. We argue that as long as the response of liberal democracies to repression of protests by the police is guided by misconstrued notions, we cannot expect to adequately address this societal failing. The insights gained from the use of our scaled reading model affirm the importance of developing methodological paths that can accommodate the plural nature of socio-legal phenomena (Keydar Reference Keydar2020). Our methodological contribution lies in addressing current challenges arising from the use of computational text analysis on complex narrative datasets. The scaled reading model affords an opportunity to gauge the gap between distant and close readings, providing a new path in legal and criminological scholarships.
No empirical research is without its limitations. As a first attempt to computationally analyze protocols of an investigative body, we faced several methodological hurdles. The status of the protocols as transcribed oral conversations, which are less structured and therefore harder to model, coupled with the lack of proficiency of the Arab witnesses in the Hebrew language, made computational analysis more challenging. Moreover, latent Dirichlet allocation (LDA) (the method used in this article) is a bag-of-words model that does not account for the order of words in the documents, thus losing the syntactic elements of the discourse before the Commission. Additionally, the LDA algorithm has prior assumptions about language, as its object of research, which should be critically accounted for. Moreover, the Hebrew language, as a rich morphological language, with few ready-made natural language processing tools, poses intrinsic challenges that add to complexity of employing language processing algorithms. While we paid careful attention to all these concerns and actively addressed them in both the preprocessing and modeling stages, they should nonetheless be highlighted. Furthermore, the textual analysis we conduct throughout this article is linguistically based—namely, we analyzed the language used by the speakers. The model does not process gestures, silences, and other nontextual cues. Our model cannot reveal thoughts and motives—for example, we cannot discern if officers describe threatening circumstances to explain their fear or to muster organizational support for their actions. While this is an inherent limitation of textual analysis, we do not ignore that the witnesses are speaking in a particular context and that their words might have instrumental and political functions.
The specific context of the October 2000 events—a set of lethal protests unfolding in Israel, which is a deeply divided society—is eminent throughout the Or corpus. This is most apparent in the final report of the Or State CoI, which is associated with the “Arab political identity” topic (topic 0). The most representative documents for this topic scrutinize the legitimacy of protest of the Arab public. The texts are centered not on an Arab perspective of the ethnic and political tensions—as one might expect— but, rather, on the inciting messages of the Arab leadership (as represented by the Monitoring or High Follow Up Committee). The report criticizes the veracity of the messages relied on by the Monitoring Committee and concludes with the ominous question of whether the Monitoring Committee “has done all that is required of it … to prevent the demonstrations from deteriorating towards violent riots.” We find that the documents relating to the “Arab political identity” are invoked by the Or State CoI as a way of criticizing the political exercise of that identity.
This serves as an important reminder that the Or corpus is rooted within a particular context. Future research should test the generalizability of our findings in comparative contexts, incorporating data from other investigative commissions into events of repressive protest policing using the scaled reading method. The explanations we have uncovered of repressive policing in this context might be a consequence of Jewish society’s struggle to make space for Arab political life in Israel, leading to reduced tolerance to protests by this group. However, they may also carry a broader relevance; it may be that the “unexplained” gap we should be examining is not between democratic life and the persistence of repressive policing, as this article set out to do, but, rather, a gap between democratic societies’ perceived commitment to their enshrined values and the state of liberal democracies today.
Appendix 1. Output of LDA topic modeling with fifteen topics and the twenty most prominent terms per topic in Hebrew original and English translation

Appendix 2. Most-representative documents per topic calculated using a nearest centroid model

Appendix 3. Top-ranking, most-representative documents per topic