

The popularity of social media provides ordinary people with an effective channel of expression, making their opinions more influential. The extant literature demonstrates that public opinion expressed through social media has indeed played a crucial role in the policy-making process. For instance, through the analysis of tweets produced by legislators and ordinary citizens in the United States, Barberá et al. (Reference Barberá, Casas, Nagler, Egan, Bonneau, Jost and Tucker2019) show that legislators follow the discussion of public issues, especially those raised by their supporters. Given its role in the public policy-making process, it is thus important to examine how the design of social media features influences individuals’ opinion expression. This article contends that when the privacy function of social media, whereby users are able to selectively disclose content, is used for politically relevant audience curation, people tend to take more partisan stances, which thereby can amplify the observed political polarization.
Different social media platforms provide different privacy functions to users, but more and more platforms are allowing users to selectively disclose content to others. When individuals generate content in cyberspace, they care about the views of others (Banaji and Prentice Reference Banaji and Prentice1994; Premeaux and Bedeian Reference Premeaux and Bedeian2003; Snyder and Gangestad Reference Snyder and Gangestad1986), including both in-groups and out-groups, as categorized by certain polarizing issues. This is driven by social desirability, the craving for one’s attitudes or behavior being seen as positive by others. Prior studies have demonstrated that expression in the public sphere can be affected by the intensity of social desirability (Goffman Reference Goffman1955; Holtgraves Reference Holtgraves2004).
We argue that, in the social media realm when there is no privacy function—that is, when content is accessible to everyone—users may face lower social desirability pressure and tend to express their attitudes less performatively, especially on polarizing issues. This is because, when content is accessible to everyone, different audiences might reward different attitudes, and so the image gain from appeasing one group is usually associated with the loss from upsetting another group. Thus, when there are varied audiences, individuals could be less motivated by social desirability concerns (Tirole Reference Tirole2026). Put differently, due to the pressure of both in-group and out-group social desirability that work in different directions, the overall social desirability users face may be relatively light.
With the privacy function, however, social media users, particularly those with a political slant, might expose their social media content only to like-minded peers. By doing so, users can impress their in-groups (Connors Reference Connors2023; Douglas and Wildavsky Reference Douglas and Wildavsky1983; Turner, Brown, and Tajfel Reference Turner, Brown and Tajfel1979), without worrying about upsetting out-groups. It is worth noting that, in general, users do not leverage the privacy function to create a completely private environment where only they are present, because they access social media mainly to connect with others. Instead, the privacy function may be used for politically relevant audience curation, whereby users create a safe space in which peers have similar political leanings (Tirole Reference Tirole2026). This might further induce users to express more partisan stances than they would otherwise, because in such a safe space, users only face in-group social desirability. To present oneself as a “qualified” in-group member or at least to avoid being seen as from the out-group, social media users might have incentives to use more partisan expressions to signal their political stance to peers. Consequently, the privacy function of social media could amplify the observed level of political polarization.
We tested this argument in Hong Kong, where the political landscape has undergone profound changes since the handover from Britain to China in 1997 (Ma Reference Ma2007). A growing number of Hong Kong residents value democratic principles and advocate for democratic reforms (Ma Reference Ma2011; Sing Reference Sing2010). Those people, labeled as the pro-democracy or “yellow” camp, launched a series of social and political demonstrations over the past two decades, including the anti-Extradition Bill movement in 2019 (Cai Reference Cai2016; Cheng Reference Cheng2016; Cheng et al. Reference Cheng, Lee, Yuen and Tang2022). Conversely, because of the continuous social and economic integration between Hong Kong and mainland China, as well as the inflow of mainland immigrants, a subset of Hong Kong people claim to give more weight to social stability and economic development than to democratic values. Labeled as the pro-establishment or “blue” camp, these individuals support the authorities in Hong Kong and Beijing (Cheng Reference Cheng2020; Lo Reference Lo2008). Political polarization between the “yellow” and “blue” camps has intensified over the years, especially during the 2019 social movement. Expressions of hostility toward the opposing camp have long been observed on local social media (Chan and Fu Reference Chan and Fu2017; Lee Reference Lee2016), which makes Hong Kong an appropriate context to verify our theoretical argument.
We conducted an experiment that created a social media-like environment in which participants expressed attitudes toward polarized news articles or nongovernment organization (NGO) funds; we recruited 119 undergraduate and graduate students from one of the eight public-funded universities in Hong Kong in late 2021 and early 2022 to test our predictions.Footnote 1 There were two treatment groups: in the transparency group, participants’ actions were observable to all the other participants, and in the safe space group, participants were allowed to freely select their audience in the same experimental session. In the control group, there was no audience for the participants’ expression of attitudes.
The findings reveal that, first, participants in the safe space treatment tended to use the privacy function to disclose their choices to like-minded participants but usually not to out-groups, as categorized by the expressed attitudes. Second, in contrast to participants in the control group, who had no audience, those in the safe space group were indeed more likely to endorse or disapprove politically divisive news articles and NGO funds. The difference between the control and transparency groups was not significant. The findings thus suggest that the subjects express different polarization levels depending on their audience/privacy and that when the privacy function of social media is used for politically relevant audience curation, users tend to take more partisan stances, thereby amplifying the observed level of political polarization.
This article makes a threefold contribution to the existing literature. First, it speaks to the literature regarding the influence of social media on political polarization (e.g., Barberá Reference Barberá2015; Bessi et al. Reference Bessi, Zollo, Del Vicario, Puliga, Scala, Caldarelli, Uzzi and Quattrociocchi2016; Boxell, Gentzkow, and Shapiro Reference Boxell, Gentzkow and Shapiro2017; Cinelli et al. Reference Cinelli, De Francisci Morales, Galeazzi, Quattrociocchi and Starnini2021; Druckman, Levendusky, and McLain Reference Druckman, Levendusky and McLain2018; Mutz Reference Mutz2006; Settle Reference Settle2018). Echoing the burgeoning literature on the influence of social desirability on polarization (e.g., Connors, Reference Connors2023), we contribute to the relevant discussion from a novel lens: the potential influence of the (in)transparency of user content on social media expressions due to social desirability. Our findings suggest that the privacy function of social media might incentivize users to express more partisan stances than they would otherwise and thereby amplify the observed level of political polarization. Second, this article draws implications about the reported level of political polarization in the real world. As the findings suggest, people tend to intensify polarizing expressions in the safe space provided by social media. Therefore, it is necessary to reassess the robustness of the reported level of polarization on various social media platforms, which, our findings suggest, may depend on the design of certain social media features. Third, this article (especially the results from the transparency and control groups) provides an angle to observe political polarization in the Hong Kong society. As the chilling effects of the enactment of the National Security Law and the Article 23 (the Safeguarding National Security Ordinance) of the Basic Law (see Footnote endnote 1) emerge, these laws may pose an obstacle to the academic exploration of polarization and other political topics in Hong Kong (Lee, Yuen, and Tang Reference Lee, Yuen and Gary2024). Our study was conducted during a precious time window and therefore contributes to the literature on Hong Kong politics.
This article is organized as follows. We first construct the theoretical basis of our study by thoroughly engaging with the relevant literature. Next, we describe the design and implementation of the experiment. Third, the main results are presented and discussed. Finally, we draw a conclusion.
Social Media and Polarization
The emergence and high penetration of social media have profoundly reconstructed the political landscape worldwide. Initially, pundits and observers optimistically predicted that social media would promote civilian empowerment and democratization in autocracies (Allagui and Kuebler Reference Allagui and Kuebler2011; Diamond and Plattner Reference Diamond and Plattner2012; Hill and Hughes Reference Hill and Hughes1999; Hussain and Howard Reference Hussain and Howard2013; Tudoroiu Reference Tudoroiu2014; Yang Reference Yang2009; Zheng and Wu Reference Zheng and Wu2005) and contribute to the growth of civil society and the improvement of democratic quality in democracies (Dahlberg Reference Dahlberg2001; Gil de Zúñiga, Jung, and Valenzuela Reference Gil de Zúñiga, Jung and Valenzuela2012; Kahn and Kellner Reference Kahn and Kellner2004; Ratto and Boler Reference Ratto and Boler2014; Skoric et al., Reference Skoric, Zhu, Goh and Pang2016). Nevertheless, many studies from the past two decades caution about the possible deleterious effects of social media. In autocracies, information flow and collective actions facilitated by social media might be largely short-lived and soon replaced by strong government control of cyberspace (Gunitsky Reference Gunitsky2015; Han Reference Han2015; Keremoğlu and Weidmann Reference Keremoğlu and Weidmann2020; King, Pan, and Roberts Reference King, Pan and Roberts2013; Reference King, Pan and Roberts2017; Roberts Reference Roberts2018; Rød and Weidmann Reference Rød and Weidmann2015). In Western democracies, a growing number of studies have underscored the possible threats of social media to democracy (Bradshaw and Howard Reference Bradshaw and Howard2018; Golovchenko et al. Reference Golovchenko, Buntain, Eady, Brown and Tucker2020; Persily, Tucker, and Tucker Reference Persily, Tucker and Tucker2020), such as the spread of misinformation and racism and the radicalization of anti-immigration sentiments (Allcott and Gentzkow, Reference Allcott and Gentzkow2017; Allcott, Gentzkow, and Yu Reference Allcott, Gentzkow and Yu2019; Del Vicario et al. Reference Del Vicario, Bessi, Zollo, Petroni, Scala, Caldarelli, Stanley and Quattrociocchi2016; Enders et al. Reference Enders, Uscinski, Seelig, Klofstad, Wuchty, Funchion and Murthi2023; Wahlström, Törnberg, and Ekbrand Reference Wahlström, Törnberg and Ekbrand2021). Tucker et al. (Reference Tucker, Theocharis, Roberts and Barberá2017, 48) state, “Social media are neither inherently democratic nor inherently undemocratic. Rather, social media constitute a space in which political interests battle for influence, and not all these interests are liberal or democratic.”
Over the past decade, scholars have increasingly focused on the rise of political polarization and the potential role that social media play in it. Political polarization can be understood both as a state and a process (DiMaggio, Evans, and Bryson Reference DiMaggio, Evans and Bryson1996). As a state, polarization refers to the grouping of a population of individuals according to some vector of characteristics who exhibit opposition to out-groups (Esteban and Ray Reference Esteban and Ray1994), whereas polarization as a process refers to the increase in such opposition over time. There are two main forms of political polarization. The first is ideological polarization, which is the divergence of political attitudes, beliefs, opinions, and stances on specific political issues and affairs (Dalton Reference Dalton1987; Fiorina and Abrams Reference Fiorina and Abrams2008; Fiorina, Abrams, and Pope Reference Fiorina, Abrams and Pope2005). The second is affective or psychological polarization, which is an identity-driven hostility toward the outgroup regardless of policy positions (Iyengar et al., Reference Iyengar, Lelkes, Levendusky, Malhotra and Westwood2019; Iyengar, Sood, and Lelkes Reference Iyengar, Sood and Lelkes2012; Rogowski and Sutherland Reference Rogowski and Sutherland2016). Taking the United States as an example, even if the ideological distance between Democrats and Republicans on some political issues shrinks, they still tend to dislike one another and to perceive that the social distance between them has expanded (Mason Reference Mason2018).
Regarding the implications of social media on polarization, some studies show that the use of social media can reduce political polarization to some extent. Barberá (Reference Barberá2015), for instance, suggests that social media provide ordinary people with the opportunity to meet others who share only “weak ties” with them. These strangers may bring novel information that they are not normally exposed to, thereby diversifying their information reception. Given the positive effect of information diversity on ideological moderation (Mutz Reference Mutz2006), social media exposure thus may be able to reduce polarization. Similarly, Boxell, Gentzkow, and Shapiro (Reference Boxell, Gentzkow and Shapiro2017) find that although the level of political polarization has risen across all age groups in the United States, the change has been smallest among the youngest set of people who are most likely to be active social media users. Other empirical studies have found comparable results (Beam, Hutchens, and Hmielowski Reference Beam, Hutchens and Hmielowski2018; Nordbrandt, Reference Nordbrandt2023; Yarchi, Baden, and Kligler-Vilenchik Reference Yarchi, Baden and Kligler-Vilenchik2021).
However, another line of research yields the opposite result: social media usage fuels polarization among the public, primarily because of the “echo chamber” effect. Through the use of algorithms and self-selection, individuals on social media platforms are generally exposed to homophilic information and news disseminated by like-minded peers, elites, and media outlets. Living in such a bubble of homogeneity for a long time, people’s perceptions of political affairs and out-group members will become increasingly radical and extreme, leading to intensified ideological polarization (Bessi et al. Reference Bessi, Zollo, Del Vicario, Puliga, Scala, Caldarelli, Uzzi and Quattrociocchi2016; Cinelli et al. Reference Cinelli, De Francisci Morales, Galeazzi, Quattrociocchi and Starnini2021; Druckman, Levendusky, and McLain Reference Druckman, Levendusky and McLain2018; Levy Reference Levy2021; Peterson, Goel, and Iyengar Reference Peterson, Goel and Iyengar2021). Moreover, some scholars believe that social media can reinforce users’ political identities and promote their biased content processing, which may intensify their polarization even in the absence of so-called echo chamber effects. For example, Settle (Reference Settle2018) argues that the key features of social media—including the fusion of social and political content, the ubiquitous social feedback, and the incentives to disseminate eye-catching content— contribute to the aggregate level of psychological polarization. Under such a circumstance, crosscutting interactions on social media, such as receiving counter-attitudinal news and interacting with out-group individuals, are likely to increase rather than decrease political polarization, as well as animosity toward the outgroup (Bail et al. Reference Bail, Argyle, Brown, Bumpus, Chen and Fallin Hunzaker2018; Kim Reference Kim2019; Zhou Reference Zhou2016).
The Privacy Function of Social Media and Users’ Attitude Expression
Although prior studies examined the nexus between social media and political polarization from different angles, we still know little about whether the accessibility of user-generated content on social media platforms affects users’ attitude expression and, consequently, observed polarization. Along with the advancement of digital technologies, the genres and functions of social media have experienced rapid development. Today, many forms of social media offer users a privacy function that allows them to choose the visibility of the content they generate. For example, on Twitter, users can choose to protect their accounts so that their tweets and account information are only available to their followers. On Facebook, “groups” allow users to have a relatively closed circle of members, and there are indeed many private political groups on Facebook in which only members can see who is in the group and what they post.Footnote 2 WeChat, the largest social media application in China, makes it possible for users to hide or show particular posts in “Moments” to a selected group of contacts. A survey shows that 78.1% of WeChat users indeed set visibility restrictions when they post content on “Moments.”Footnote 3 We contend that when the privacy function of social media is used for politically relevant audience curation, people may express more partisan political attitudes than they would otherwise, thereby amplifying the extent of observed political polarization.
Scholars have suggested that people’s expression in the public sphere could be affected by the intensity of social desirability, which refers to the craving for the belief that an attitude or behavior is seen as positive by others (Goffman Reference Goffman1955; Holtgraves Reference Holtgraves2004). More specifically, in the face of the pressure from social expectations, if individuals believe their stances are incompatible with the mainstream, they may be cautious about what they say and do and tend not to reveal what they really think. This is especially the case if they have a high level of a self-monitoring trait, the tendency to change one’s actions and thoughts to appease others (Banaji and Prentice Reference Banaji and Prentice1994; Premeaux and Bedeian Reference Premeaux and Bedeian2003; Snyder and Gangestad Reference Snyder and Gangestad1986).
We argue that although this view is insightful on issues for which there is a consensus, on polarizing issues the effects of social desirability on individuals’ expressions will be more nuanced, and in the social media realm, they may depend on whether privacy functions are provided. We contend that, in a transparent environment without the privacy function, social media users need to balance their images as perceived by both in-group and out-group members (Brewer Reference Brewer1999).Footnote 4 On a polarizing issue, different audiences might reward different attitudes, and so a user’s image gain from appeasing in-group members is usually associated with the image loss caused by the exposure to out-groups. With such a varied audience, people could be less motivated by social desirability concerns because they do not know what is the socially desirable thing to do (Tirole Reference Tirole2026). As a result, they might be less likely to express political attitudes in a performative way.
However, when users are provided with a privacy function that can be used for politically relevant audience curation, they are incentivized to reveal their content to like-minded individuals while hiding it from out-group users, especially in a polarized context. By doing so, users could impress members of their in-groups (Connors Reference Connors2023; Douglas and Wildavsky Reference Douglas and Wildavsky1983; Turner, Brown, and Tajfel Reference Turner, Brown and Tajfel1979) without worrying about antagonizing out-groups. As a result, the privacy function creates a “safe space” for users: they are surrounded by peers who are politically similar. Yet this safe space may also induce users to express more partisan stances, because there users only face in-group social desirability. To present oneself as a “qualified” in-group member or at least avoid being seen as from the out-group, social media users might have incentives to use more partisan expressions to signal their political stance to in-group members.
To sum up, we argue that the privacy function of social media—that is, the flexibility by which users are allowed to choose who can access their content—may induce users to disclose to like-minded people only, creating a safe space in which users tend to express more partisan political attitudes than they would otherwise, thereby amplifying the level of observed political polarization.
The Context
We use Hong Kong as the context to test our argument. After being handed over from Britain to China in 1997, the political landscape of this financial center in East Asia experienced drastic changes (for an overview, see Ma Reference Ma2007). On the one hand, with the development of the economy and civil society, a growing number of Hong Kong residents, especially professionals and the middle class, place great importance on liberal and democratic values and principles and demand democratic reforms, such as universal suffrage for elections of the executive head and legislators (Ma Reference Ma2011; Sing Reference Sing2010). These people are in the pro-democracy or “yellow” camp. As the difference in the positions widened between the pro-democracy camp and the Hong Kong Special Administrative Region (SAR) government, as well as the central government, wide-ranging social and political demonstrations have erupted over the past two decades (Cai Reference Cai2016; Cheng Reference Cheng2016). On the other hand, because of the continuing socioeconomic integration between Hong Kong and mainland China and the inflow of mainland immigrants, a subset of Hong Kong residents are privileging social stability and economic prosperity over democratic values. They claim to be staunch supporters of the SAR government and Beijing and are labeled as the pro-establishment or “blue” camp (Cheng Reference Cheng2020; Lo Reference Lo2008). Those residents do not attend demonstrations organized by the pro-democracy camp, and they vote for the pro-Beijing candidates in legislative elections (Wong et al. Reference Wong, Ma and Lam2018).
Political polarization between the “yellow” and “blue” camps has intensified over the years, especially during the 2019 anti-extradition bill campaign. Various peaceful and armed protests organized by pro-democracy citizens occurred one after another for nearly a year, and the demands of the movement broadened from legal issues to comprehensive democratic reform (Cheng et al. Reference Cheng, Lee, Yuen and Tang2022; Lee, Yuen, and Tang Reference Lee, Yuen and Gary2024). Protesters even classified local businesses based on their political stances and exclusively supported like-minded businesses, trying to build a “yellow economic circle.”Footnote 5 The two camps have clashed, and expressions of hostility toward the opposing camp have long been observed in the Hong Kong social media realm (Chan and Fu Reference Chan and Fu2017; Lee Reference Lee2016). Therefore, Hong Kong, a society with a high level of political division, is an appropriate context to verify our theoretical argument.
To strengthen its control over this quasi-autonomous city, the Chinese government has implemented a series of strict measures, including the introduction of the Hong Kong National Security Law in 2020 and the enactment of the legislation for Article 23 (the Safeguarding National Security Ordinance) of the Basic Law in 2024.Footnote 6 Our experiment, conducted in late 2021 and early 2022, which was after the 2019 social movements but before these two laws exerted significant chilling effects, captured an important time window to study polarized expressions in Hong Kong and to test our theoretical predictions (see also Footnote endnote 1).
Experimental Design and Execution
We designed and conducted an experiment in one of the eight public-funded universities in Hong Kong. Leveraging oTree (Chen, Schonger, and Wickens Reference Chen, Schonger and Wickens2016), we programmed a quasi-social media environment. With research ethics approval from this university, we recruited undergraduate and graduate students who had not participated in any previous experiment.Footnote 7 Although the student sample was not representative of the Hong Kong population, our primary goal was to investigate the causal effect of the social media privacy function on observed political polarization.Footnote 8 The experiment was performed in two waves (wave 1 in October and November 2021 and wave 2 in February 2022), and in total there were 119 student participants (for replication data, refer to Hong, Xia, and Zhang (Reference Hong, Xia and Zhang2026)).
Participants were recruited through bulk email invitations and were randomly assigned to one of the three groups; thus, the assignment to treatment groups was not related to their political views. After registering, participants were informed only about the time and location of the experimental sessions, but not about the treatment condition to which they were assigned.
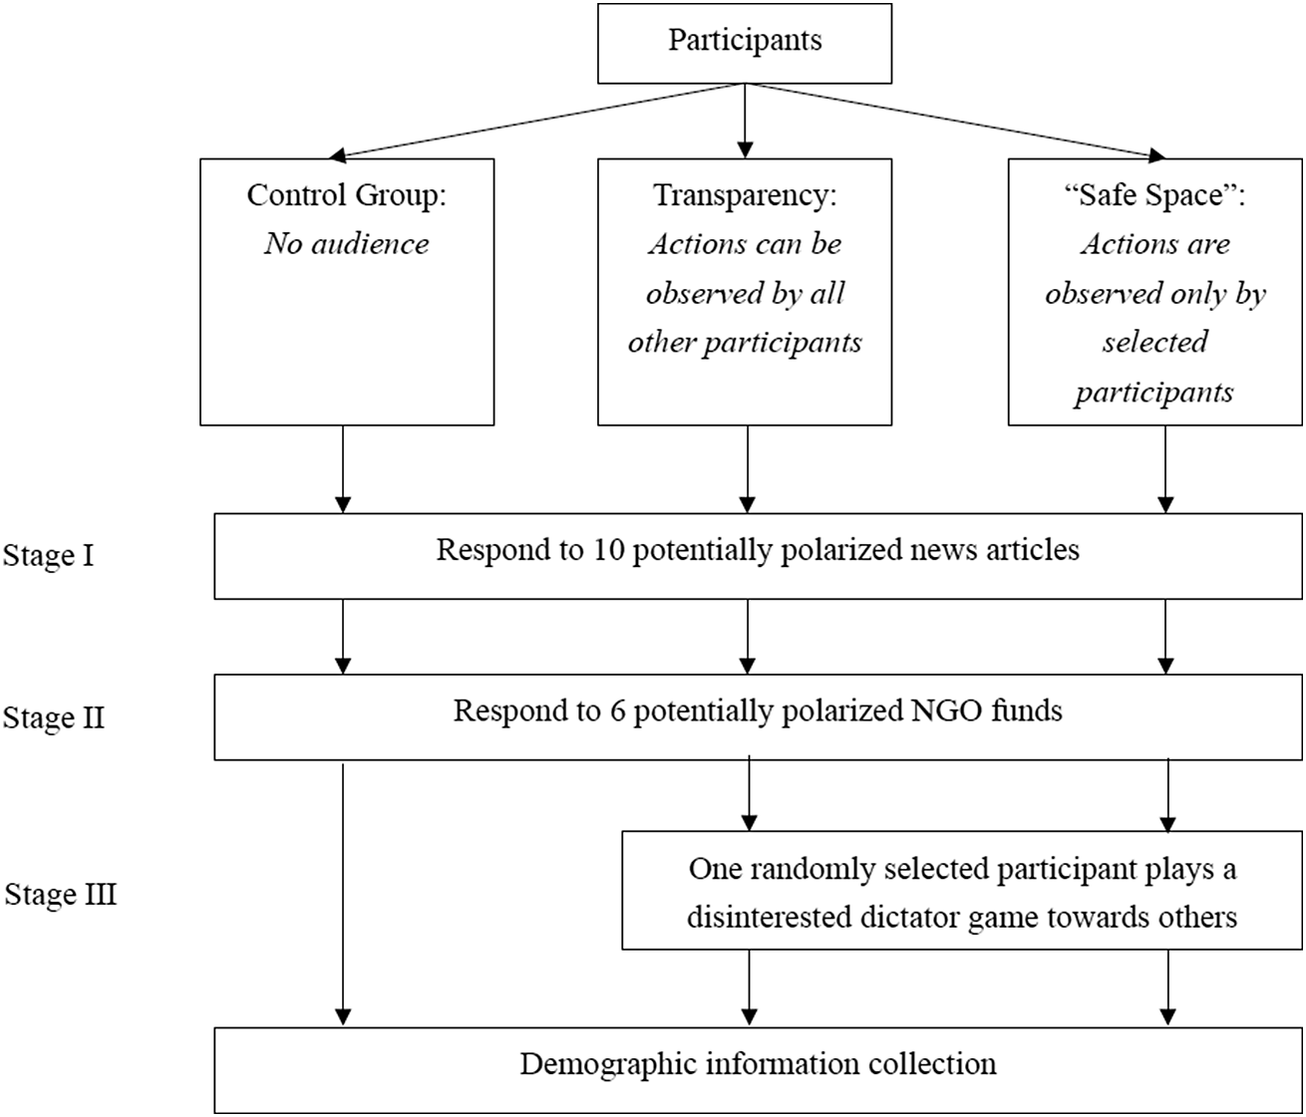
The experiment included a control group and two treatment groups: the transparency and safe space groups. In the control group, there were no audiences for the participants’ actions.Footnote 9 In the transparency group, participants’ actions were observable to all the other participants in the same experimental session, whereas in the safe space group, participants were allowed to select the audience in the same session who could observe their actions. The experiment consisted of two stages for the control group and three stages for the two treatment groups. We measured the observed polarization level by recording the participants’ responses to divisive issues in the “social media” environment created in the experiment.
In Stage I, each participant was sequentially presented with 10 news articles with publication dates and sources on their “social media stream.” The articles were taken from local and international media and were mostly about Hong Kong or mainland China. Most were politically divisive (see table 1). News articles A to E were likely to be favored by the “blue” camp, and news articles F to H by the “yellow” camp; news articles I and J were neutral in the sense that the two camps were unlikely to have opposing attitudes to them: they served as controls.Footnote 10
Summary of the News Articles and NGO Funds

Table 1. Long description
The table is divided into two main sections: News and Funds.
News Section:
* A: P L A Trains Hong Kong Police with Goose-stepping Chinese-style Marching (Source: Asian News International).
* B: Singaporeans Are Keen on Chinese Sinovac Vaccine; People Queued up Overnight (Source: Yahoo).
* C: Chinese Astronauts Conduct Second Spacewalk outside Planned Space Station (Source: C N N).
* D: Survey: Over 70 percent of Hong Kong Youngsters Consider Participating in the Great Bay Area Employment Scheme (Source: Lianhe Zaobao).
* E: H K U: All Students Involved in Mourning the Suspect Who Assassinated Policeman Are Banned from Campus (Source: Sina News).
* F: Hundreds Queue for Final Edition of Apple Daily (Source: Radio Television Hong Kong).
* G: U K Parliament Members Urged to Relax B N O Application Eligibility (Source: Hong Kong Economic Times).
* H: Japan Stuns China to Win Historic Mixed Olympic Table Tennis Gold (Source: C N N).
* I: The 3D Printed Fibonacci House by T A M Is Now Listed on Airbnb (Source: 3D Printing Media Network).
* J: Dual Typhoons: Over 38.1 degrees in Sheung Shui; Chanthu to Impact in Weekend (Source: H K 0 1).
Funds Section:
* K: Hong Kong Association of Overseas-Returned Scholars (H K A O R S).
* L: Hong Kong Federation of Education Workers (H K F E W).
* M: A H K Fund.
* N: Society for Community Organization (SoCO).
* O: Liber Research Community (Liber Research).
* P: Hong Kong Guide Dogs Association (H K G D A).
Notes: See online appendix C for the detailed content of the news articles and description of the NGO funds.
After viewing each news article, participants were asked to choose from three options: “like,” “dislike,” or “abstain.” Next, participants in the safe space group who selected active choices “like” or “dislike” had three options to hide their choices from others in the same experimental session: (1) hide from those who liked the news article; (2) hide from those who disliked the news article; and (3) hide from those who abstained. They could choose one, more, or none of the hiding options. Figure 1 shows what Stage I looks like to participants in the safe space group.
Experimental Interface of Stage I (Safe Space Group)
Notes: Figure 1(a) shows a sample screenshot of the presentation of news article titled “PLA Trains Hong Kong police with ‘Goose-Stepping’ Chinese-style Marching” in Stage I. At the right bottom of figure 1(a), the participant can choose to “like” or “dislike” the news article or “abstain.” Participants who choose to “like” or “dislike” the news article have a chance to hide it from some audiences, as shown in figure 1(b).

Figure 1. Long description
The interface is divided into two vertical sections labeled (a) and (b).
Panel (a) is titled Stage I Liking or Disliking News Articles Round 6. On the left is a photograph of police officers in blue uniforms marching in formation outside a building, with a caption below stating P L A trains Hong Kong police with goose-stepping Chinese-style marching. To the right of the photo is a news text block from A N I regarding the People's Liberation Army training. Below the text is a dropdown menu asking Would you like to ‘like’ or ‘dislike’ this news article? The dropdown options are: I'd like to ‘Like’ this news article, I'd like to ‘Dislike’ this news article, and I abstain.
Panel (b) shows the follow-up screen titled Stage I Liking or Disliking News Articles Round 6. It asks Would you like to hide your choice of ‘like’ or ‘dislike’ to other participants? Select all that apply. Three sets of Yes or No radio buttons follow, corresponding to: Hide my choice from those who ‘liked’ the news article, Hide my choice from those who ‘disliked’ the news article, and Hide my choice from those who abstained. At the bottom, an orange warning box states that unhidden choices can be observed by other participants and the allocator in Stage I I I. A blue Next button is at the very bottom.
In Stage II, the social media stream provided information about six local NGO funds. Funds K, L, and M are considered to lean toward the pro-establishment camp (“blue”), funds N and O are ideologically close to the pro-democracy camp (“yellow”), and fund P has no significant political slant and serves as a control.Footnote 12 After viewing the description of each NGO fund, participants were asked whether they “agree” or “disagree” to donate to this fund or would “abstain.” If a majority of participants in the experimental session voted for a donation to the NGO fund, we (the experimenter) would donate 200 Hong Kong dollars (approximately USD26) to it after the experiment. Our final donation amount depended on the number of experimental sessions in which a majority of the participants “agreed” to donate to this NGO fund. The feature of “the experimenter donates” teases out the self-interest of the participants. After the participants cast their votes and before the voting outcome was released, participants in the safe space group who voted to “agree” or “disagree” with the donation could choose one, more, or none of the following options to hide their votes: (1) hide from those who voted for a donation to the NGO fund; (b) hide from those who voted against a donation to the NGO fund; and (c) hide from those who abstained.
In Stages I and II, the order of news articles and that of NGO funds were randomized across sessions. After the participants completed both stages, participants in the control group could view a summary of their own active decisions—decisions of “(dis-)like”/ “(dis-)agree”—but not others’ decisions. Participants in the transparency group could view their own and all other participants’ active decisions in the same experimental session. Participants in the safe space group could only view their own active decisions and those active decisions to which they have access (i.e., those not hidden by the decision maker).
To induce social desirability, the experiment included a third stage for the participants in the two treatment groups: it was a disinterested dictator game that is commonly applied in experimental economics (e.g., Bolton, Dimant, and Schmidt Reference Bolton, Dimant and Schmidt2021; Coffman Reference Coffman2011; Exley Reference Exley2018). Specifically, in each experimental session, which consisted of 12 participants (except for one session with 14 participants), at the beginning of Stage III the computer randomly selected one participant to be an allocator with equal probability. The allocator was then asked to select three of the remaining participants in the session as bonus recipients. Each of the selected bonus recipients and the allocator would receive a fixed-amount bonus: 100 Hong Kong dollars (approximately USD $13). Before selecting the bonus recipients, the allocator could review other participants’ decision profiles in the first two stages that were accessible to her; that is, all the other participants’ decisions in the transparency group and the other participants’ decisions that were not hidden in the safe space group. This stage induces social desirability concerns for participants in the treatment groups in the first two stages, because, in those stages, the participants would care about their social image in the eyes of all the other participants, given that each participant would have the same probability of being selected as the allocator in Stage III.
After the participants finished all the experimental stages, they were asked to fill out a questionnaire that collected their basic demographic information (see Footnote endnote 17). Figure 2 summarizes the experimental design, and table 2 describes each group in the experiment. Table A1 in the online appendix reports the demographic distribution of participants across the three groups and the results of balance tests. The absence of significant differences in demographic characteristics indicates that randomization was successfully achieved.
Summary of the Experimental Design

Figure 2. Long description
The flowchart begins at the top with a central box labeled Participants. Three arrows branch downward to three distinct experimental conditions:
* Left: Control Group: No audience.
* Center: Transparency: Actions can be observed by all other participants.
* Right: Safe Space: Actions are observed only by selected participants.
Below these groups, the flow proceeds through four horizontal stages:
* Stage I: A single wide box spanning all three groups labeled Respond to 10 potentially polarized news articles.
* Stage II: A single wide box spanning all three groups labeled Respond to 6 potentially polarized N G O funds.
* Stage III: A box positioned under the Transparency and Safe Space columns only, labeled One randomly selected participant plays a disinterested dictator game towards others. The Control Group path bypasses this box with a direct arrow to the final stage.
* Final Stage: A single wide box at the bottom labeled Demographic information collection.
Summary of the Experiment

Table 2. Long description
The table consists of four columns: Group, Observability in Stage 1 and 2, number of Sessions, and number of Participants.
* Row 1: Control group, No audience, 3 sessions, 45 participants.
* Row 2: Safe Space group, Free selection of audience, 3 sessions, 38 participants.
* Row 3: Transparency group, Observable to all, 3 sessions, 36 participants.
* Row 4: In Total, spanning the first two columns, with 9 sessions and 119 participants.
For all (treatment and control) groups, we ensured the confidentiality of the subjects’ real identity and their decisions. The participants in the two treatment groups were aware that although some of their decisions might be associated with a randomly decided nickname (astronomical objects in the solar system; see figure 1(a)) and shown to other participants, their real identity was never associated with their decisions and was not observable to the experimenter.Footnote 13 Participants in the control group knew that their choices would not be observed by any other participant nor be associated with their real identity and would be anonymized to the experimenter.
Results
Polarization Index
It was first necessary to verify whether the participants were polarized in their attitudes toward the news articles and NGO funds. We used the following index to measure the degree of polarization for each news article and NGO fund based on participant responses in the control group:

where
$ \#\mathrm{participants} $
 indicates the number of participants and
$ \#\mathrm{likes} $
 (
$ \#\mathrm{dislikes} $
 ) indicates the number of participants who “liked” (“disliked”) the news article or “agreed” (“disagreed”) donating to the NGO fund. The term
$ \frac{\#\mathrm{likes}+\#\mathrm{dislikes}}{\#\mathrm{participants}} $
 captures the proportion of the participants who expressed positive or negative attitude toward the news or NGO fund. Conditional on attitude expression, the term
$ \frac{\left|\#\mathrm{likes}-\#\mathrm{dislikes}\right|}{\#\mathrm{likes}+\#\mathrm{dislikes}} $
 , ranging from 0 to 1, captures the difference in the frequencies of the two opposite attitudes among the participants. The larger it is, the more consensual attitude the participants had regarding the presented news or NGO fund. Put differently,
$ \left(1-\frac{\left|\#\mathrm{likes}-\#\mathrm{dislikes}\right|}{\#\mathrm{likes}+\#\mathrm{dislikes}}\right) $
 captures the divisiveness in terms of participants’ expressed attitudes toward the given news or NGO fund. Overall, the polarization index is thus the product of the two terms. It equals 0 if all participants, except for those who chose to “abstain,” expressed the same attitude, and equals 1 if exactly one half of the participants chose to “like/vote for” the news/fund and the other half chose to “dislike/vote against” the same news/fund.
Figure 3 visualizes the polarization index of each news or fund in the control group (for more details, refer to table A2 in the online appendix). As expected, the polarization indexes for news/funds I, J, and P, which are largely unrelated to politics, are low (< 0.25), whereas the other news/funds (except news article C and NGO fund L) have higher polarization indexes (> 0.25). The most polarized ones are news articles D and E and NGO fund M: the two news articles report Hong Kong youth’s assimilation to mainland China and the University of Hong Kong’s harsh punishment of student social-movement leaders; NGO fund M is a pro-establishment organization calling for people to stop the demonstrations and restore social order. The results indicate that most of the news articles and NGO funds we used in the experiment, except those serving as controls, are indeed politically polarizing and so suitable for the purpose of our experiment. We consider those news/funds with a polarization index higher than 0.25 to be polarized news/funds, and much of the following analysis will be based on this categorization. Among those 11 polarized news articles/NGO funds, 6 are “blue” (A, B, D, E, K, and M), whereas the other 5 are “yellow” (F, G, H, N and O).
Polarization Index
Notes: Based on Equation (1), the chart shows the level of observed polarization among participants in the control group regarding a specific news article or NGO fund. “Yellow” new articles/NGO funds are indicated by yellow triangles, “blue” new articles/NGO funds are indicated by blue squares, while black dots indicate new articles/NGO funds that are neutral. (a)-(c) are for the control, transparency, and safe space groups, respectively.

Figure 3. Long description
The chart features a vertical axis labeled News forward slash N G O Funds and a horizontal axis labeled Polarization Index ranging from 0.00 to 1.00.
From top to bottom, the data points are:
* P: H K G D A is a black dot at approximately 0.01.
* J: 3 D-Printed Airbnb is a black dot at approximately 0.04.
* L: H K F E W is a blue square at approximately 0.18.
* C: Chinese Astronauts is a blue square at approximately 0.22.
* I: Weather is a black dot at approximately 0.22.
* G: Apple Daily is a yellow triangle at approximately 0.27.
* A: Goose-stepping is a blue square at approximately 0.31.
* F: B N O is a yellow triangle at approximately 0.31.
* O: Liber Research is a yellow triangle at approximately 0.31.
* B: Singapore Sinovac is a blue square at approximately 0.36.
* H: Japan Table Tennis is a yellow triangle at approximately 0.36.
* K: H K A O R S is a blue square at approximately 0.36.
* N: S o C O is a yellow triangle at approximately 0.36.
* M: A H K Fund is a blue square at approximately 0.49.
* D: G B A Employment is a blue square at approximately 0.53.
* E: H K U Student Union is a blue square at approximately 0.71.
A legend on the right indicates that black dots represent Neutral, blue squares represent Blue, and yellow triangles represent Yellow.
Revealing to In-groups and Hiding from Out-groups
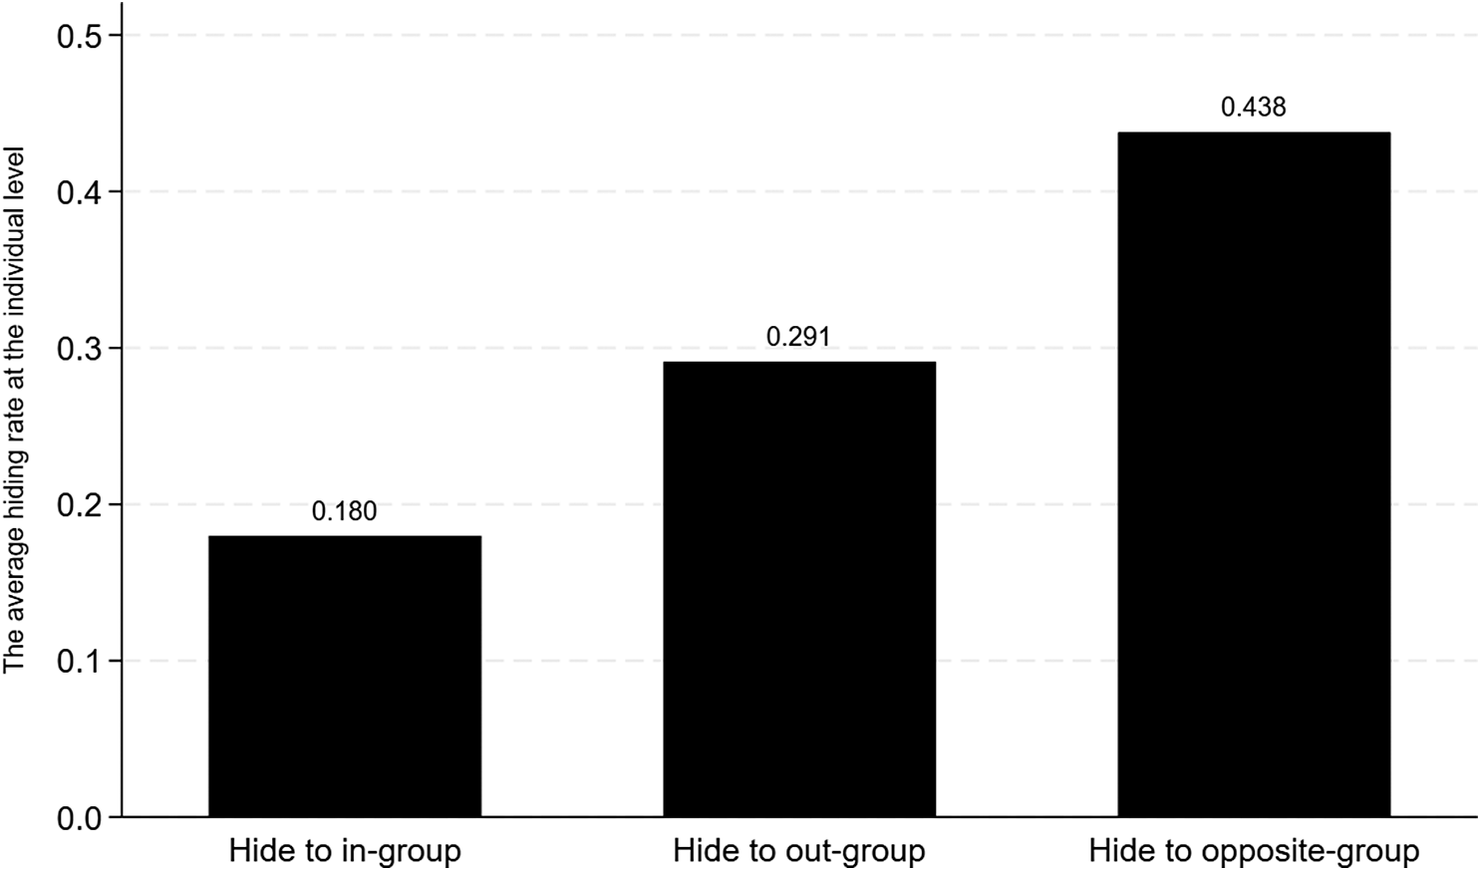
We now present the main results of our experiment. We first investigated whether participants in the safe space group, who could freely choose their audience, tended to expose their active decisions toward polarized news/funds to those with a similar political leaning and to hide them from their out-groups. Figure 4 presents participants’ hiding decisions for polarized news/funds, conditional on the participant behaving actively for the news/fund. In about 44% of the cases, participants hid their responses to polarized news and NGO funds from participants from the opposite group, namely, those who actively chose choices contrary to their own; in 29% of the cases, participants hid their responses from out-groups (including both members of the opposite group and those who chose “abstain”). Yet, the proportion of participants who concealed their choices from in-group members was merely 18%. To better understand whether these differences were statistically significant, we conducted the Wilcoxon signed-rank test. The results indicate that participants in the safe space group were indeed more likely to hide their active choices regarding polarized news/funds from both out-groups (p < 0.05) and opposite groups (p < 0.01) compared to in-groups. Thus, the experimental results confirm our theoretical expectation that individuals are prone to use the privacy function to block others with heterophilic political leanings.
Hiding Frequencies from Different Peer Groups for Polarized News/Funds
Notes: The figure shows the frequencies of participants in the safe space group hiding their Stage I/II active decisions from their in-group (other participants who made the same choice), the out-group (other participants who chose the opposite action or “abstain”), and the opposite-group (other participants who chose the opposite action) for polarized news articles or NGO funds.

We then performed a regression analysis to explore the heterogeneity in audience selection. Table A3 in the online appendix reports odds ratios from logit regressions using data from the safe space group for the polarized news/funds. In columns (1)-(3), the dependent variables are binary variables indicating “hiding from in-group,” “hiding from out-group,” and “hiding from opposite group,” respectively, as defined in figure 4. We regressed each of the dependent variables on various demographic variables, as well as controlled for news/fund fixed effects, order fixed effects,Footnote 14 dummy variables indicating the session size,Footnote 15 and whether the session was held in the second wave of the experiment, with robust standard errors clustered at the individual level. The regression results do not show very robust heterogeneity in terms of audience curation for the subjects. A relatively robust finding is that subjects whose parents were at a higher education level appear more inclined to curate their audience by hiding from out-groups.
“Blue-Yellow” Scores and Bonus Allocation
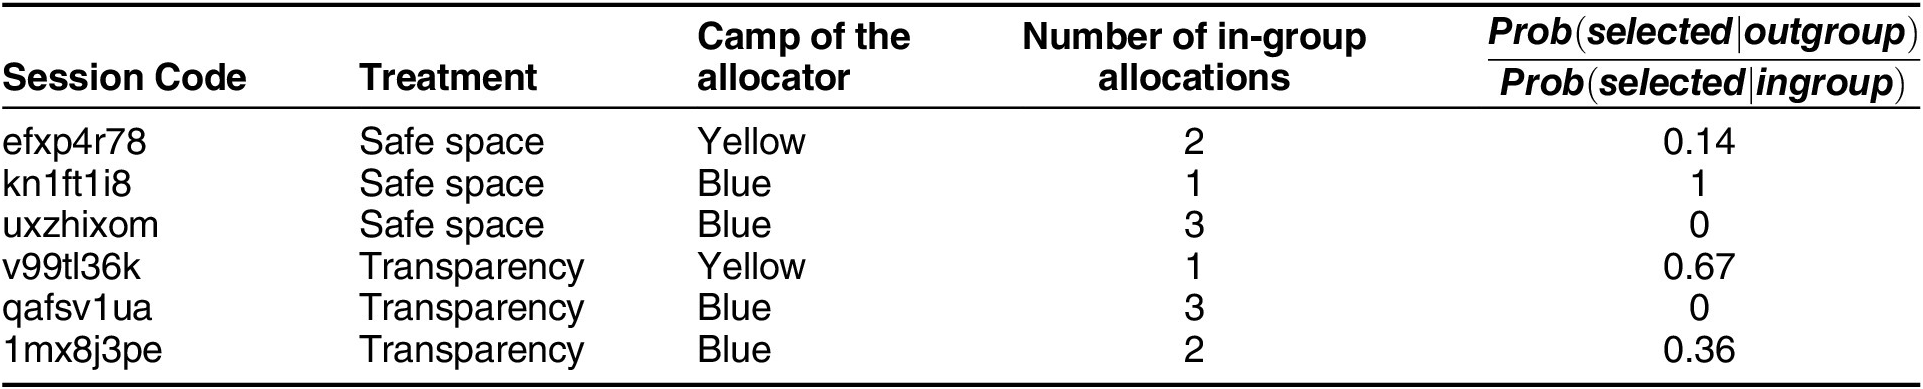
As mentioned, we embedded a disinterested dictator game into the treatment groups to induce social desirability concerns. If this design were valid, we should observe that participants who were randomly assigned as “allocators” tended to select like-minded participants to be bonus recipients. To estimate the political stance of each participant, we constructed a “blue-yellow” score for each participant by assigning +1(-1) point if they liked/voted for a “yellow” (“blue”) polarized news article/NGO fund or disliked/voted against a “blue” (“yellow”) polarized news article/NGO fund. The sum of points constituted the participant’s “blue-yellow” score. Given the 11 polarized news articles/NGO funds, the score ranged from -11 to 11. A participant is a member of the allocator’s ingroup if and only if their blue-yellow scores have the same sign; otherwise, the participant is in the allocator’s out-group. Table 3 depicts the allocators’ camp (Blue/Yellow for negative/positive “blue-yellow” scores) and their selection of three bonus recipients for each experimental session in the treatment groups. In two experimental sessions, the allocator’s selected bonus recipients are all from in-groups, and in another two sessions, two out of the three bonus recipients are in the allocator’s in-groups. The last column,
$ \frac{Prob\left( selected| outgroup\right)}{Prob\left( selected| ingroup\right)} $
 , indicates the odds ratio that the allocators selected out-groups versus in-groups as bonus recipients. Notably, this figure is never larger than 1 in all six experimental sessions, suggesting that there is a significant in-group bias for bonus allocation. The results validate our design of social desirability pressure in the experiment.
Allocators and Their Selection of Bonus Recipients

Table 3. Long description
The table contains five columns: Session Code, Treatment, Camp of the allocator, Number of in-group allocations, and the odds ratio of selecting out-groups versus in-groups, expressed as the fraction Numerator Prob (selected | outgroup) all over denominator Prob (selected | ingroup).
* Session e f x p 4 r 7 8: Safe space treatment, Yellow camp, 2 in-group allocations, odds ratio 0.14.
* Session k n 1 f t 1 i 8: Safe space treatment, Blue camp, 1 in-group allocation, odds ratio 1.
* Session u x z h i x o m: Safe space treatment, Blue camp, 3 in-group allocations, odds ratio 0.
* Session v 9 9 t l 3 6 k: Transparency treatment, Yellow camp, 1 in-group allocation, odds ratio 0.67.
* Session q a f s v 1 u a: Transparency treatment, Blue camp, 3 in-group allocations, odds ratio 0.
* Session 1 m x 8 j 3 p e: Transparency treatment, Blue camp, 2 in-group allocations, odds ratio 0.36.
Notes: A participant belongs to the blue (yellow) camp if their blue-yellow score is negative (positive). An in-group (out-group) allocation means that the allocator selects a bonus recipient who belongs to the same (a different) camp. Prob (selected | in-group) is an in-group’s probability of being selected as a bonus recipient, defined as the ratio of the number of in-group recipients divided by the number of the allocator’s in-groups in the session. Prob (selected | out-group) is defined in the same fashion. Thus,
$ \frac{Prob\left( selected| outgroup\right)}{Prob\left( selected| ingroup\right)} $
 indicates the odds ratio of selecting out-groups versus in-groups to be bonus recipients.
Expression of Political Stances in the Safe Space Group
We then compared the differences in attitude expression among the experimental groups. Given our aim of investigating social media users’ political expression when they can select the audience for their content, in our analysis, we were primarily interested in the comparison between the safe space group and the control group and in that between the safe space group and the transparency group.
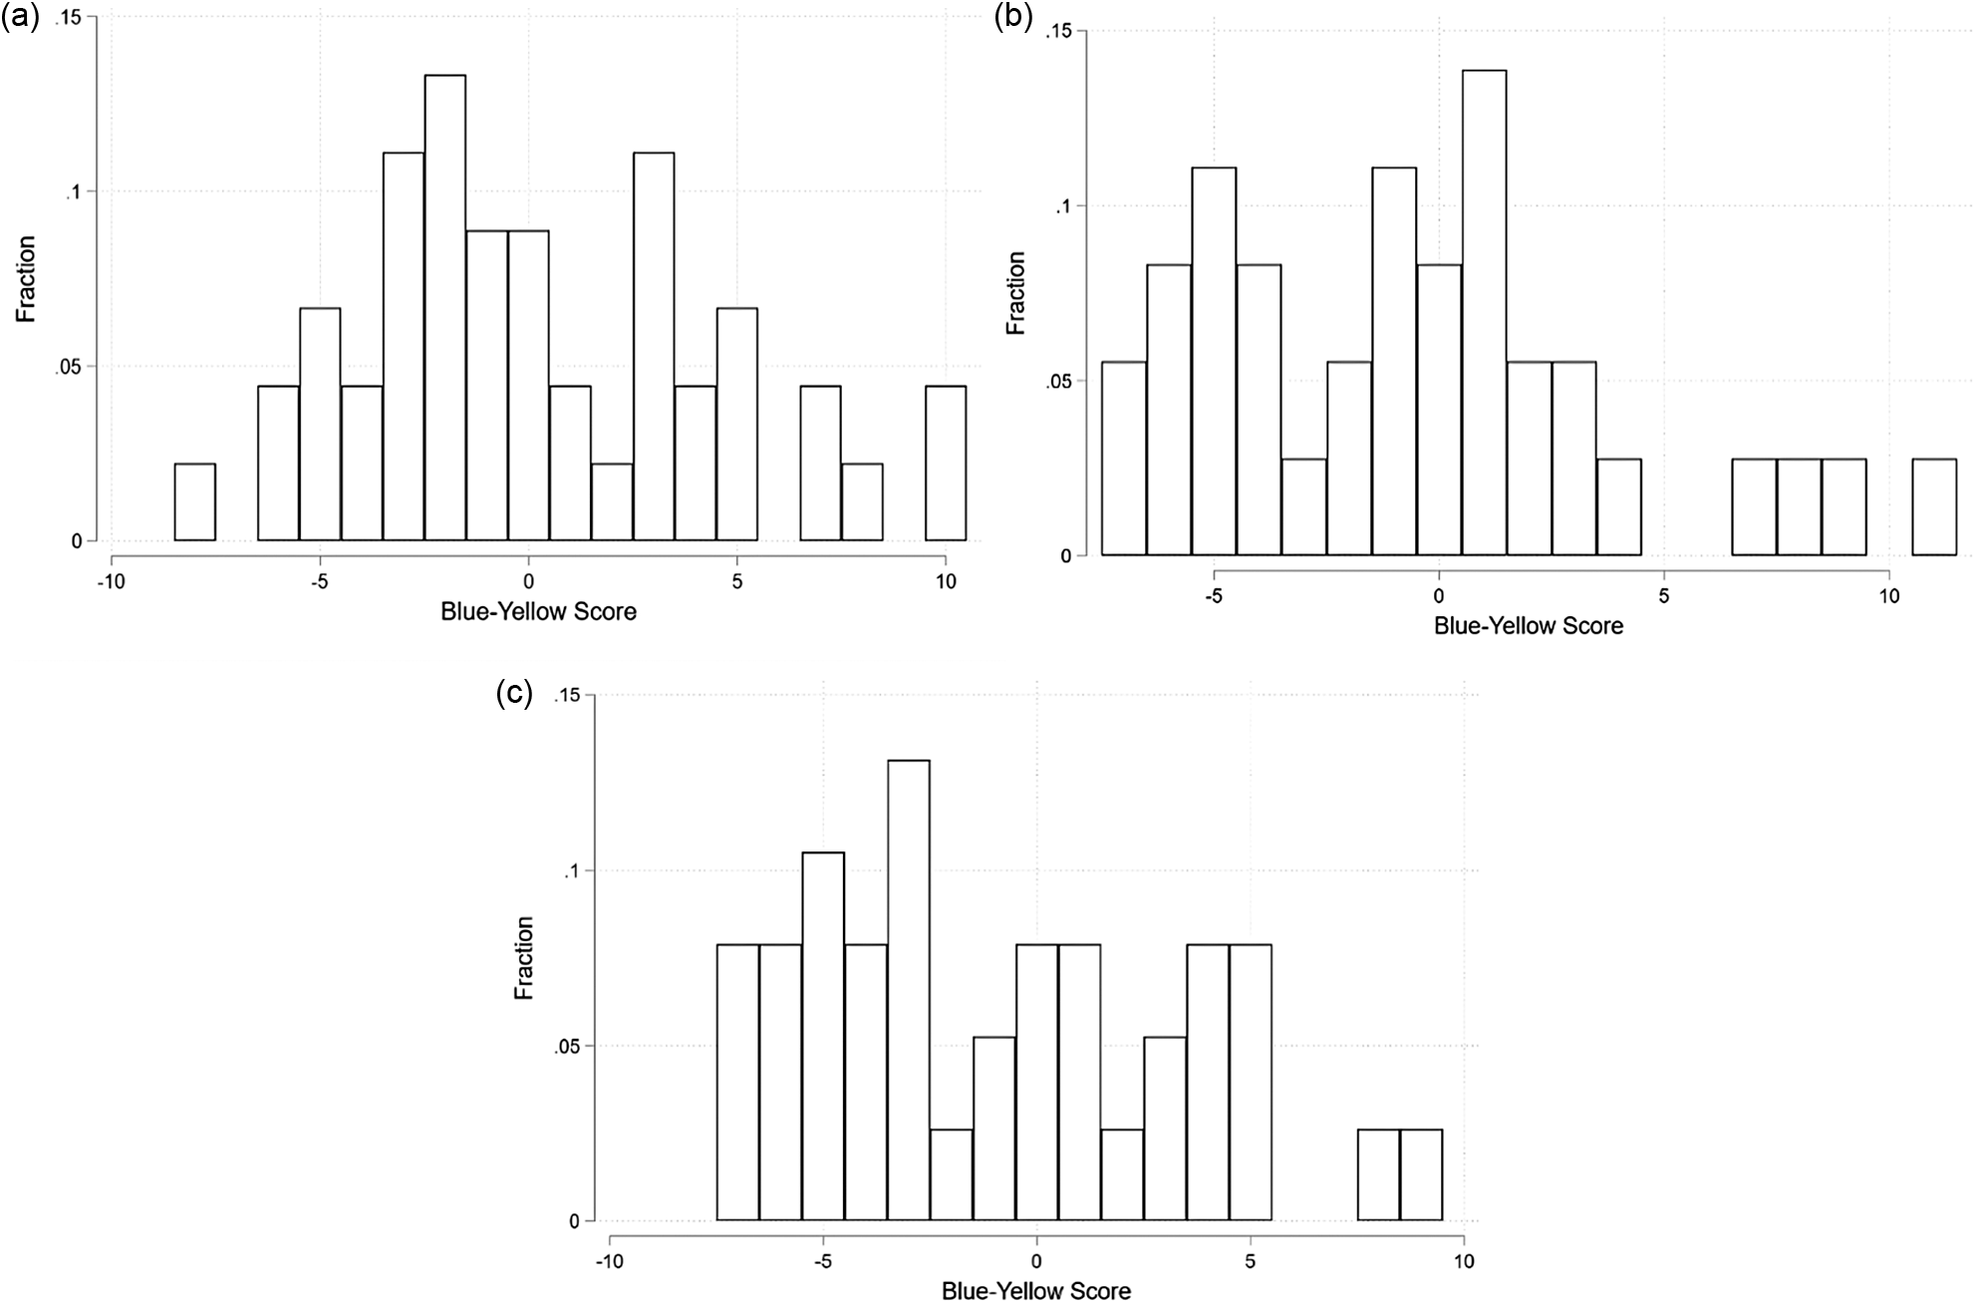
Figure 5 visualizes the distribution of participants’ “blue-yellow” scores in the three groups. Since the absolute value of a participant’s “blue-yellow” score reflects her degree of political leaning, we compute the average of the absolute values of “blue-yellow” scores for the three experimental groups. They are 3.51 (Control), 3.58 (Transparency), and 3.82 (Safe Space), respectively. A simple comparison suggests that participants in the safe space group expressed more polarized attitudes than in the other two groups. To further empirically verify that participants in the safe space group were more likely to take partisan stances, we conduct the following two analyses.
Distribution of Participants’ “Blue-Yellow” Scores in the Three Groups
Notes: The score is calculated by assigning +1 (–1) when a participant liked/voted for a “yellow” (“blue”) polarized news article/NGO fund or disliked/voted against a “blue” (“yellow”) one. Summing across 11 such items yield a score ranging from –11 to 11. Subfigures (a)-(c) are for the control, transparency, and safe space groups, respectively.

Figure 5. Long description
The figure consists of three panels, each containing a histogram with the x-axis labeled Blue-Yellow Score ranging from minus 10 to 10 and the y-axis labeled Fraction ranging from 0 to 0.15.
Panel a (top-left) shows a multimodal distribution. The highest peak is at a score of minus 2 with a fraction of approximately 0.14. A secondary peak occurs at a score of 3 with a fraction of 0.11. The data is spread relatively evenly between minus 7 and 5, with small outliers at 7, 8, and 10.
Panel b (top-right) shows a distribution with two distinct clusters. The first cluster is centered around minus 5 with a peak fraction of 0.11. The second cluster is centered around 1 with the highest peak in the panel at approximately 0.14. There are isolated low-fraction bars at the far right of the scale between 7 and 11.
Panel c (bottom-center) shows a distribution concentrated between minus 7 and 5. The highest peak is at minus 3 with a fraction of approximately 0.13. Other notable peaks occur at minus 5 and minus 4, both at approximately 0.11. There is a significant gap in data between 5 and 8, with two small bars appearing at 8 and 9.
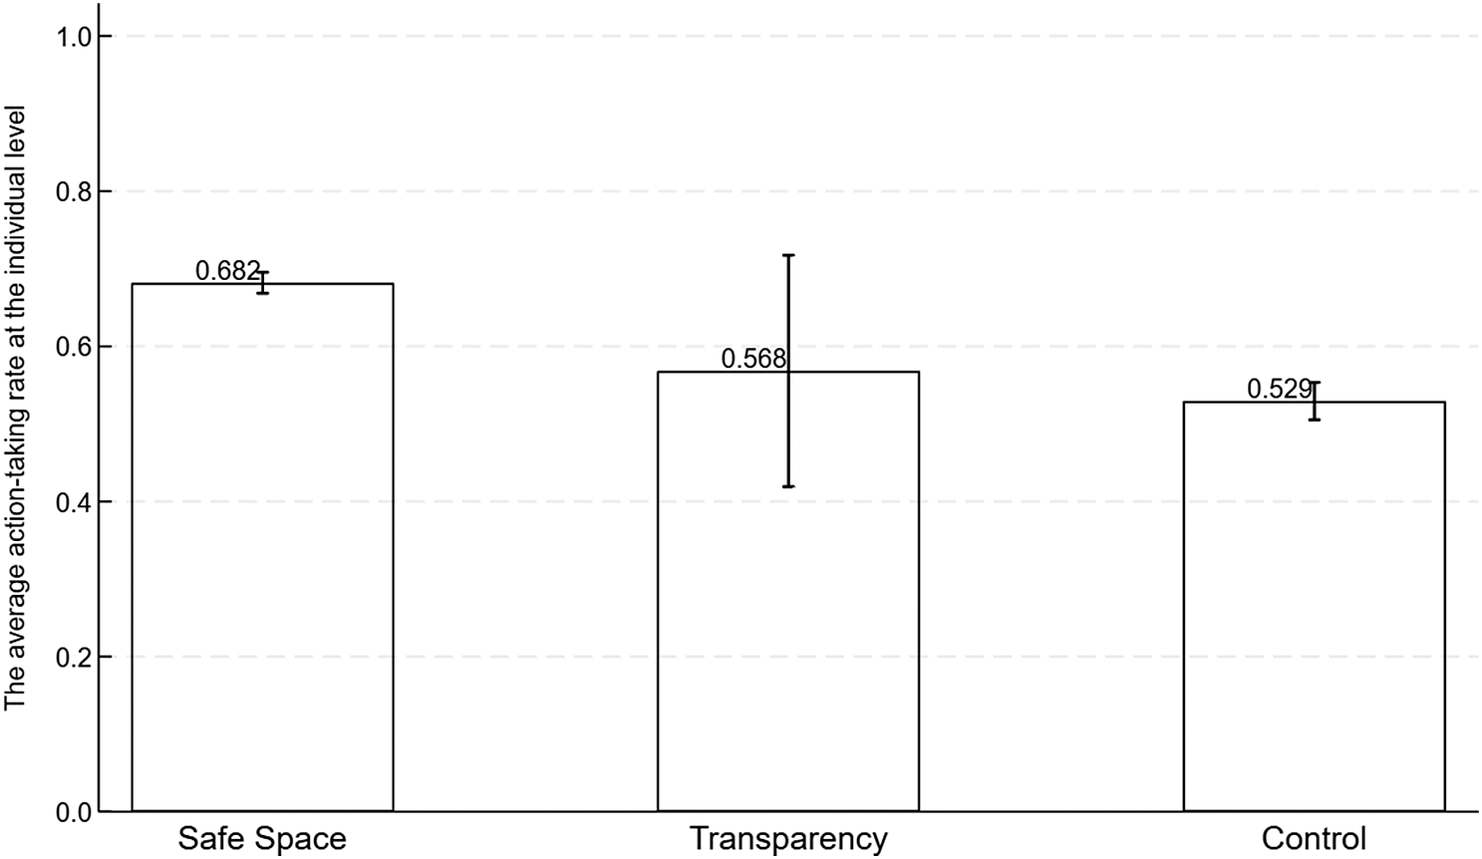
First, we consider participants’ “active actions”— that is, their active choice to “like/vote for” or “dislike/vote against” those polarized news articles or NGO funds rather than choosing to “abstain”. Our main hypothesis states that participants in the safe space group would be more inclined to take “active actions” compared to their counterparts in the control and transparency groups (because the safe space group could impress their in-groups by taking the actions and hide their actions to the out-groups). Figure 6 shows the frequencies of “active actions” for polarized news/funds across the three groups. While the frequencies of “active actions” among participants in both the control and transparency groups were about 55%, the frequency in the safe space group was nearly 70%, indicating a sharp difference.
Frequencies of “Active Actions” for Polarized News/Funds across the Three Groups

Moreover, the results of the Mann-Whitney test at the individual level indicate that the difference between the control and safe space groups is statistically significant (p < 0.05), suggesting that participants in the safe space group were indeed more likely to take a stance for polarized news/funds, compared to their counterparts in the control group. In a society where more individuals choose to take a partisan stance on polarizing issues, instead of staying neutral, the observed level of polarization increases. By contrast, opinion expression tends to be less performative in an anonymous setting.Footnote 16
Although the difference in the frequencies of “active actions” between the safe space and transparency groups is 11.4%, it is statistically insignificant according to the Mann-Whitney test (p = 0.18). Nevertheless, the regression analysis reported later shows that after we control for many other factors that may affect the subjects’ decisions, the difference becomes statistically significant.
Finally, the difference in the frequencies of “active actions” between the control and transparency groups is not significant, either statistically (p = 0.45; Mann-Whitney test) or in terms of magnitude (the difference being less than 4%).
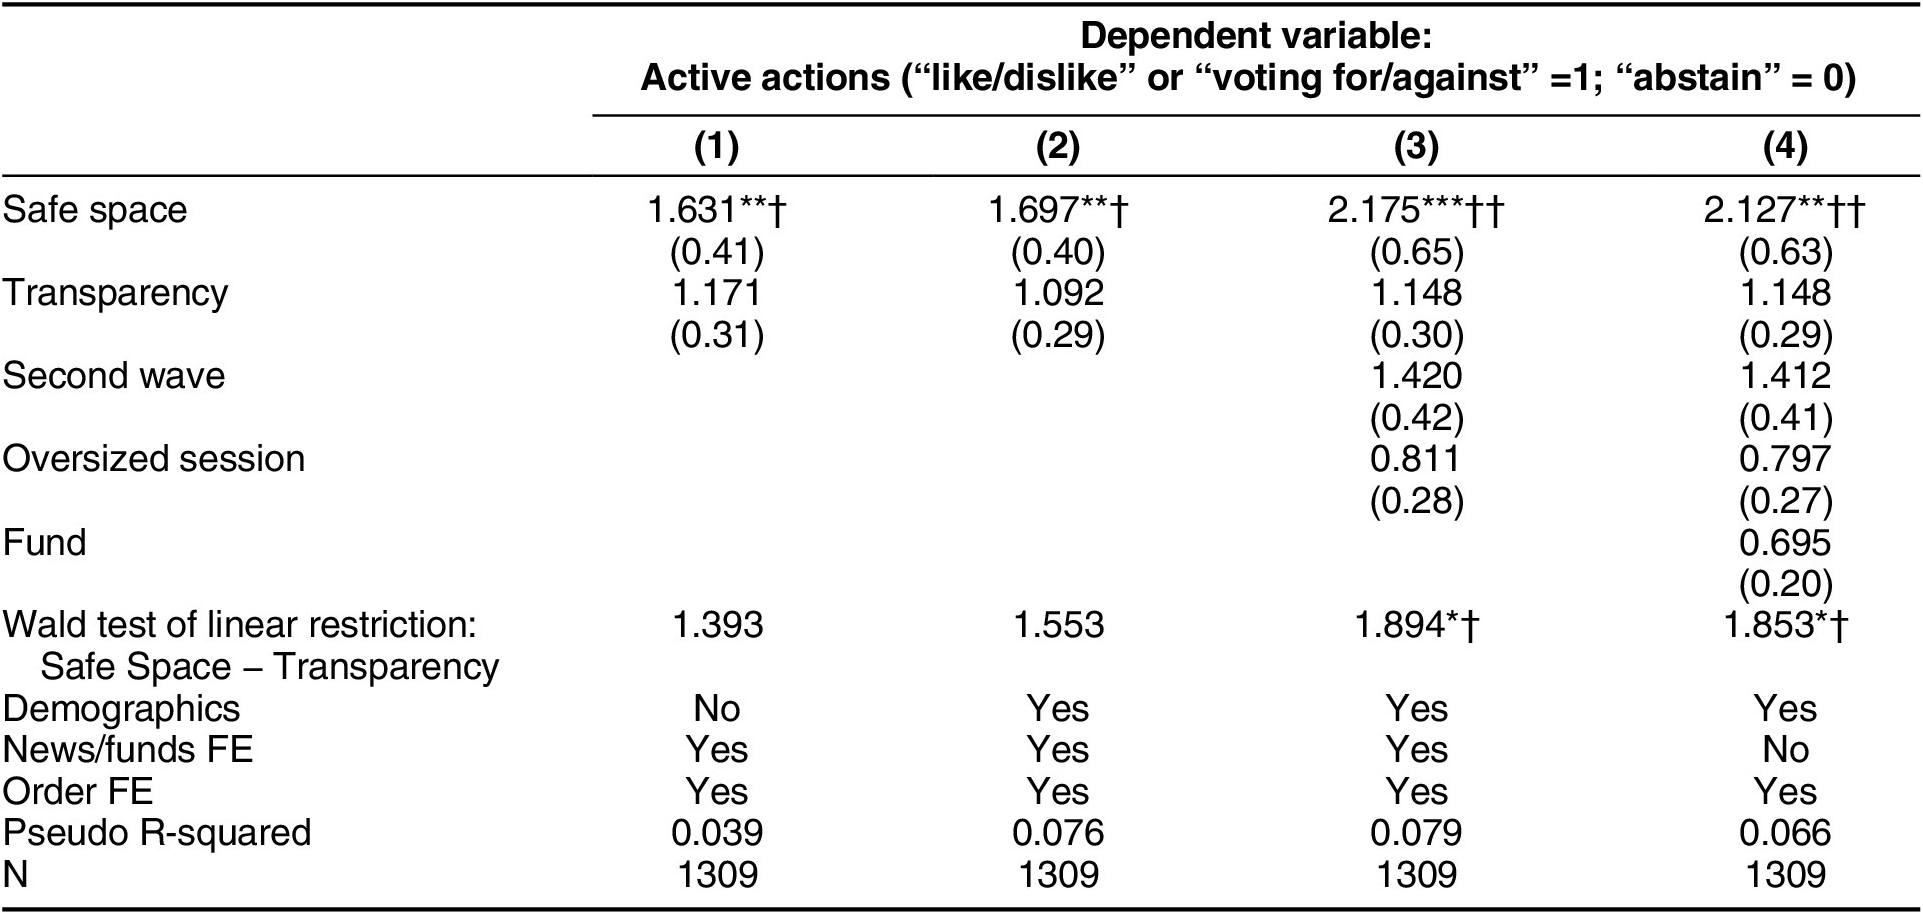
Table 4 reports odds ratios from logit regressions using data for the polarized news/funds from the three experimental groups. The dependent variable is a dummy variable indicating whether the subject acts actively (equal to 1 if the subject chose “like/dislike” or “voting for/against”). In column (1), we regress the dependent variable on two dummy variables indicating our treatments: safe space and transparency, with the control group being the baseline. We also control for order fixed effects and news/fund fixed effects, with robust standard errors clustered at the individual level. Starting from column (2), we include demographic variables.Footnote 17 Starting from Column (3), we further control for dummy variables capturing some other characteristics of the experimental sessions: second wave indicates whether the session was held in the second wave of the experiment; oversized session indicates the only session in the treatment groups with more than 12 subjects. In column (4), instead of controlling for the news/fund fixed effects, we use a dummy variable, fund, to separate the NGO funds from the news articles.
Odds Ratios from Logit Regressions of “Active Actions”

Table 4. Long description
The table presents odds ratios for the dependent variable Active actions, where 1 equals like/dislike or voting and 0 equals abstain. It consists of four columns representing different regression models.
* Safe space: Odds ratios are 1.631 in model 1, 1.697 in model 2, 2.175 in model 3, and 2.127 in model 4. All are statistically significant.
* Transparency: Odds ratios range from 1.092 to 1.171 across all models, but none are statistically significant.
* Second wave: Included in models 3 and 4 with odds ratios of 1.420 and 1.412 respectively.
* Oversized session: Included in models 3 and 4 with odds ratios of 0.811 and 0.797 respectively.
* Fund: Included only in model 4 with an odds ratio of 0.695.
* Wald test of linear restriction (Safe Space minus Transparency): Values are 1.393, 1.553, 1.894 (significant), and 1.853 (significant) for models 1 through 4.
* Controls: Demographics are included in models 2, 3, and 4. News/funds F E is included in models 1, 2, and 3. Order F E is included in all models.
* Statistics: Pseudo R-squared values range from 0.039 to 0.079. The sample size N is 1309 for all models.
Standard errors are clustered at the individual level and provided in parentheses below the odds ratios. Significance levels are indicated by asterisks for standard testing and daggers for Holm-Bonferroni corrected testing.
Notes: This table reports odds ratios from logit regressions using data from the polarized news/funds. Robust standard errors clustered at the individual level are reported in parentheses. *, **, and *** represent significance at 10%, 5%, and 1% levels, respectively, in the absence of correction for multiple hypotheses testing. †, ††, and ††† represent significance at 10%, 5%, and 1% levels, respectively, under the correction for multiple hypotheses testing using the Holm-Bonferroni procedure (Holm Reference Holm1979).
Table 4 reports that the odds ratios of safe space are greater than 1 and statistically significant in all the columns, confirming that the subjects are more likely to act actively under the safe space than under the control group. In contrast, the odds ratios of transparency are not significant (with p > 0.5), suggesting that participants in the transparency group might not behave very differently from their counterparts in the control group.Footnote 18 More importantly, the odds ratios of the Wald Test of linear restrictions (i.e., safe space minus transparency) are greater than 1 and statistically significant in our more comprehensive specifications, Column (3) and (4): participants in the safe space are more likely to “act actively” than those in the transparency group.
As mentioned earlier, there are two primary comparisons in our analysis: the comparison between the safe space and control groups, and the comparison between the safe space and transparency groups. We then used the correction procedure proposed by Holm (Reference Holm1979) to take care of the issue of multiple hypotheses testing. The results are also indicated in table 4. With the correction, the difference between the safe space and control groups remains statistically significant, and the difference between the safe space and transparency groups remains statistically significant in the more comprehensive specifications, columns (3) and (4).
Overall, the empirical analysis demonstrates that the subjects are substantially more likely (by more than 10 percentage points) to “act actively” in the safe space group than in the control and transparency groups, and the differences are statistically significant (by both statistical tests and regression analysis for the comparison with the control group, and by regression analysis only for the comparison with the transparency group). These results demonstrate that in the presence of the privacy function to select audience, individuals more often choose sides instead of staying neutral.
Conclusion
Building on the extensive literature on political polarization and on the political implications of social media, we argue that the privacy function of social media could have a profound impact on the intensity and extent of individual political expression. Specifically, the privacy function of social media, which enables users to freely choose who can access their content, might be used for politically relevant audience curation and thus incentivize users to take more partisan stances in their opinion expression than they would otherwise, thereby amplifying the level of observed political polarization. Through an experiment in Hong Kong, where political polarization intensified due to the conflict between the pro-democracy and pro-establishment camps, we empirically support this argument. More precisely, the privacy function of social media indeed induces participants to more often take a clear stance on polarizing issues rather than remaining neutral. It is worthwhile noting that our study does not speak to the actual level of polarization. Instead, it focuses on the expressed partisan positions, showing that the privacy function of social media induces more partisan expressions and so increases the observed level of political polarization.Footnote 19
From a theoretical viewpoint, our study uses the privacy function of social media to show how privacy, together with social desirability concerns, can influence people’s reported political stances in an unexpected and nuanced way. On the one hand, it deepens our understanding of the role of privacy in political communication, in particular the type of privacy that allows people to select their audience. On the other hand, although a considerable number of studies have examined the impact of social media on political expression and polarization from different angles, this research demonstrates that certain features of popular social media platforms may have an unexpected effect on opinion expression. As stated by Tucker et al. (Reference Tucker, Theocharis, Roberts and Barberá2017, 48), “social media are neither inherently democratic nor inherently undemocratic.” Indeed, the devil is in the details. Our study thus calls for further political-science research on the design of social media functions and their impacts in greater detail.
In addition, the findings of this research carry important practical implications. First, political elites, policy makers, and ordinary users should be cautious in treating opinions expressed on social media, even those expressed in private such as in “private circles” on Facebook, because the opinions expressed could vary with the features of the social media platforms. Second, social media companies might consider fine-tuning the privacy function of their platforms, given our finding that when such functions are used for politically relevant audience curation, individuals might express more partisan political positions than they would otherwise.
The current research has a few limitations, which point to some directions for future research. First, given that the primary aim of this study was to establish the plausible mechanism through which the privacy function could affect political expression and observed polarization, we used a student sample in our study, which might not be sufficiently representative of the general population; in addition, the sample size was not large. Thus, a caveat is in order: we do not provide direct evidence about the real-world prevalence of social media users’ use of privacy functions to create their “safe space.” Future research may use larger and more representative samples from the field to validate the generalizability of the findings. Second, although we used the motives of social desirability and in-group impression management as plausible mechanisms to derive our testable hypothesis about the privacy function, the research does not offer direct evidence regarding these psychological mechanisms that underlie individuals’ expression of political stances. The mechanisms could be investigated in greater depth using more fine-grained data in future research.
Supplementary material
To view supplementary material for this article, please visit http://doi.org/10.1017/S1537592726105751.
Data replication
Data replication sets are available in Harvard Dataverse at: https://doi.org/10.7910/DVN/OC1BQB.
Acknowledgments
We thank the editors, three anonymous reviewers, Jean Tirole, Jiangnan Zhu, and seminar participants in the Institute for Advanced Study in Toulouse (IAST) for helpful comments on earlier versions of this article.