INTRODUCTION
Green turtles, Chelonia mydas, occur in tropical and subtropical regions throughout the world's oceans. Due to overexploitation of eggs and turtles as food source and, to a lesser extent, incidental mortality related to marine fisheries and degradation of marine and nesting habitats, populations have declined throughout the world (Groombridge & Luxmoore, Reference Groombridge and Luxmoore1989; NMFS, 1998; Seminoff, Reference Seminoff2004; Koch et al., Reference Koch, Nichols, Peckham and de la Toba2006). Green turtles are currently listed as endangered in the International Union for Conservation of Nature Red Data Book (IUCN, 2009) and are included in Appendix I of the Convention on International Trade in Endangered Species of Wild Fauna and Flora. Despite a worldwide increase in research and conservation of green turtles, their foraging biology and habitat requirements remain poorly understood (Bjorndal, Reference Bjorndal, Musick and Lutz1997).
Like most sea turtles, green turtles are migratory and use a wide range of broadly separated localities and habitats during their lifetime (Hirth, Reference Hirth1997). Upon leaving the nesting beach, it has been hypothesized that hatchlings begin an oceanic phase, perhaps floating passively in major current systems (gyres) for several years (Carr & Meylan, Reference Carr and Meylan1980; Carr, Reference Carr1987; Reich et al., Reference Reich, Bjorndal and Bolten2007; Arthur et al., Reference Arthur, Boyle and Limpus2008). In neritic habitats, green turtles feed primarily on algae and/or seagrass, with diet composition varying between feeding areas. In the Hawaiian archipelago (Balazs, Reference Balazs1980) and in Bahia de los Ángeles (Gulf of California, Mexico) (Seminoff et al., Reference Seminoff, Resendiz and Nichols2002), they feed mainly on macroalgae. On the Pacific coast of Baja California Peninsula (Mexico) the diet is dominated by a mixture of algae and seagrasses (López-Mendilaharsu et al., Reference López-Mendilaharsu, Gardner and Seminoff2005), while in the Caribbean Sea (Bjorndal, Reference Bjorndal1980, Reference Bjorndal1985; Mortimer, Reference Mortimer1981) and on the Great Barrier Reef in Australia (Fuentes et al., Reference Fuentes, Lawler and Gyuris2006) the green sea turtles feed predominantly on seagrasses.
In the eastern Pacific Ocean (EPO) the most studied feeding grounds for the green turtle are the Baja California peninsula (Mexico) (Cliffton et al., Reference Cliffton, Cornejo, Felger and Bjorndal1982; Seminoff et al., Reference Seminoff, Resendiz and Nichols2002; López-Mendilaharsu et al., Reference López-Mendilaharsu, Gardner and Seminoff2005), the Gulf of Fonseca (Honduras) (Carr, Reference Carr1952), Gorgona Island (Colombia) (Amorocho & Reina, Reference Amorocho and Reina2007), the Galapagos Islands (Ecuador) (Green & Ortiz-Crespo, Reference Green, Ortiz-Crespo and Bjorndal1982), and the Paracas Península (Perú) (Márquez, Reference Márquez1990). At many of these sites, green turtles consume large quantities of invertebrate matter in addition to marine algae and seagrasses (Carr, Reference Carr1952; Hays & Brown, Reference Hays, Brown and Bjorndal1982; Seminoff et al., 2002; Amorocho & Reina, Reference Amorocho and Reina2007). The diet composition at different feeding grounds depends on the availability of resources (Bjorndal, Reference Bjorndal1980; Ross, Reference Ross1985; Balazs et al., Reference Balazs, Forsyth and Kam1987), and to some extent by foraging preferences, especially for certain species of red algae (Gilbert, Reference Gilbert2005; Fuentes et al., Reference Fuentes, Lawler and Gyuris2006; López-Mendilaharsu et al., Reference López-Mendilaharsu, Gardner, Riosmena-Rodríguez and Seminoff2008).
Among the most important areas for green turtles in the EPO are the Galapagos Islands, an oceanic archipelago located ~1000 km west from mainland Ecuador (Green & Ortiz-Crespo, Reference Green, Ortiz-Crespo and Bjorndal1982; Hurtado, Reference Hurtado1984). In addition to hosting a major nesting population, the Galapagos Islands contains important feeding grounds for green turtles, particularly around the archipelago's western islands of Isabela and Fernandina (Green & Ortiz-Crespo, Reference Green, Ortiz-Crespo and Bjorndal1982), where high productivity areas are located (Banks, Reference Banks, Danulat and Edgar2002) due to local upwelling (Feldman, Reference Feldman, Robinson and Del Pino1985). Here and elsewhere, there is a resident population of green turtles which feeds in nearshore neritic foraging habitats (Seminoff et al., Reference Seminoff, Zárate, Coyne, Foley, Parker, Lyon and Dutton2007). Green & Ortiz-Crespo (Reference Green, Ortiz-Crespo and Bjorndal1982) and Green (Reference Green, Schroeder and Witherington1994) made some comments on the diet composition of the green turtle in the Galapagos Islands. However, they did not carry out an exhaustive study on this issue. Despite the importance of the Galapagos Islands for green turtles, the feeding ecology of this species has been poorly studied.
The purpose of this research was to study the dietary composition of green turtles in the Galapagos Islands, and how it differed spatially and seasonally through oesophagic content analysis. The present study is a contribution to the overall understanding of green turtle diet in the EPO, an ocean region that has been known for hosting the enigmatic invertebrate foraging behaviour of green turtles (Bjorndal, Reference Bjorndal, Musick and Lutz1997).
MATERIALS AND METHODS
Study site
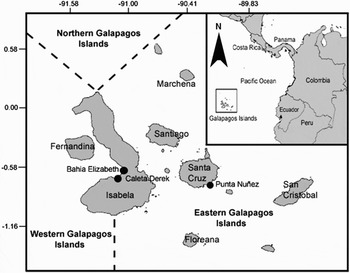
From 2006 to 2007, we studied green turtles at three feeding areas in the Galapagos Islands. These include Bahia Elizabeth (BE) (S00°35′41.1″W91°04′10.2″), Caleta Derek (CD) (S00°38′35.9″W91°05′33.4″) in the Western Galapagos Islands and Punta Nuñez (PN) (S00°44′40.7″W 90°15′18.3″) in the Eastern Galapagos Islands (Figure 1). Whereas BE and CD are lagoons (1–5 m deep) with low swell influence, PN is an exposed bay (1–15 m deep) influenced by strong currents and wave action. The sea floor in BE is mainly covered by mud, where turtles are usually observed resting. The sea floor in CD is mainly covered by rocks and small patches of green algae. Adjacent coasts of BE and CD present great cover of the green alga Ulva spp. and other turf algae (e.g. Polysiphonia sp.). The PN sea floor is covered mainly by mixed patches of Caulerpa racemosa and Hypnea sp. and smaller patches of Dictyota sp. at the external part of the bay.
Galapagos Archipelago. The black points show the study sites of Bahia Elizabeth, Caleta Derek and Punta Nuñez. Hatched lines are divisions of the three ecoregions in Galapagos, according to Spalding et al. (Reference Spalding, Fox, Allen, Davidson, Ferdaña, Finlayson, Halpern, Jorge, Lombana, Lourie, Martin, McManus, Molnar, Recchia and Robertson2007).

According to the Galapagos Marine Reserve (GMR) zoning scheme (DPNG & FCD, 1999) these localities are not totally protected. At BE non-extractive (tourism and conservation) activities are allowed, at CD and PN extractive (fishing) and non-extractive activities are allowed (DPNG & FCD, 1999).
Turtle capture and measurement
Turtle capture efforts were conducted at BE in February and August 2006, at CD in August 2006, and at PN in June, September, October 2006 and July 2007. A 100 m net with 30 cm mesh size was used for capturing turtles. Manual captures were also made using snorkel equipment. Upon capture, turtles were transported to a boat where their curved carapace lengths (CCL) were measured (± 0.1 cm) with a measuring tape, from the anterior nucal scute to the posterior most edge of the carapace.
We grouped turtles according to their size in base on the mean nesting size (MNS) of females that nest on the Galapagos beaches (MNS = 86.7 cm CCL; Zárate et al., Reference Zárate, Fernie, Dutton and Seminoff2003). Thus, Group I included all turtles with CCL < MNS (probable immatures), and Group II included all animals with CCL ≥ MNS (probable adults). This assignment may represent immature and adult individuals, but there may be some imprecision because all turtles do not necessarily reach maturity at the same size (Limpus & Chaloupka, Reference Limpus and Chaloupka1997).
Curved carapace length data were normal (Z = 1.20; P = 0.112) and homogeneous (Levene = 0.18; P = 0.834) so a one-way ANOVA was applied to determine CCL differences between study areas and seasons. This analysis was done with the software SPSS 12.0 (SPSS Inc, Chicago).
Diet study
To analyse the diet we conducted oesophageal lavage to collect recently ingested food from the oesophagus and the anterior stomach region of turtles (Forbes & Limpus, Reference Forbes and Limpus1993). Turtles were placed on their back, and the mouth was opened using a pry bar until a veterinary mouth gag was inserted to keep it open. A tube lubricated with vegetable oil was inserted in the oesophagus and clean seawater was pumped at low and constant pressure. The procedure lasted no more than five minutes. After the oesophageal lavage, turtles were released in the study area. Diet samples were stored in plastic bags and frozen for later laboratory analysis.
The volume of each sample was determined through measuring water displacement in a graduated cylinder. Each sample was then spread in a Petri dish of appropriate size, and dietary components were identified to the lowest possible taxonomic level according to Taylor (Reference Taylor1945), Abbott & Hollenberg (Reference Abbott and Hollenberg1976), Lobban (Reference Lobban1996) and Russell & Balazs (Reference Russell and Balazs2000). Algae identification was performed using a stereoscope and light microscope. To quantify the relative abundance of the consumed items a 16 squares graticule (each square of 1 × 1 cm) with 2 mm2 gradations was located in the bottom of the Petri dish. The relative abundance of food components was determined by the microestereology technique (Schaefer, Reference Schaefer1970; Redfoot, Reference Redfoot1997). This technique involves counting the number of times a particular item appears over the intersection points of the squares using a stereomicroscope. Thus, the relative abundance represents the points covered by each species. The relative abundance of each food item was estimated using the following formula:

Any diet component with a relative volume >5% in at least one sample was considered an important item (Garnett et al., Reference Garnett, Pirce and Scott1985; Seminoff et al., Reference Seminoff, Resendiz and Nichols2002; Arthur & Balazs, Reference Arthur and Balazs2008). For all consumed items with >5%, we calculated the frequency of occurrence (%FO) (Windell & Bowen, Reference Windell and Bowen1978):

The weighted resultant index (Rw) was used to establish the most important elements of the diet of the turtles in the three sites. This is a relative importance index that combines the %FO and the %V and allows us to estimate the order of importance for the entire array of foods ingested:
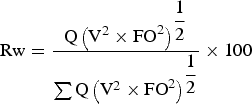
where,
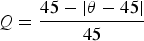
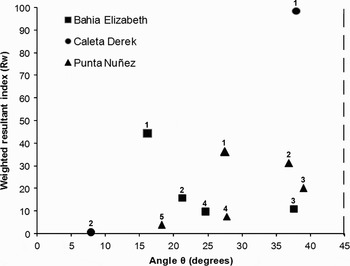
This index can be graphically represented as a function of the θ angle that is calculated using the formula tan−1(V/FO). This makes it possible to interpret the importance of each item considering the consistency of the %V and %FO. Diet components with a uniform representation of %V and %FO have angles close to 45°. The values of the Rw vary between 0 and 100; food items with values close to 100 represent the most important in the diet, while those closer to 0 represent less important items in the diet (Mohan & Sankaran, Reference Mohan and Sankaran1988).
The similarity of the diet between the study sites and the two sampling events at BE was tested with non-metric multidimensional scaling analysis (MDS) using a Bray–Curtis similarity matrix (presence/absence). This analysis uses a dissimilar measurement function for each pair of samples and expresses it in terms of distance in a multidimensional graphic. A similarity analysis (ANOSIM) was made as well to examine the effect of the sites over the diet component samples. The ANOSIM is a non-parametric permutation analysis applied to a similarity presence/absence matrix from which we could analyse the null hypothesis that there are no differences between sampling events, grouping the sites and samples (Arthur & Balazs, Reference Arthur and Balazs2008). The MDS and ANOSIM analyses were processed with the software Community Analysis Package (CAP) version 3.0 (Pisces Conservation Ltd).
To analyse how the contribution of relative volume of the principal diet components (V ≥ 5%) varied between the two sampling events at BE a comparative histogram was made. Welch ANOVA was applied to determine differences in the consumption proportion of the principal alimentary items in the diet of the turtles in the study sites and between sampling seasons at BE. Welch ANOVA is a variance analysis that considers normal data that does not obey the homogeneity assumption. This analysis was done using the software SPSS version 12.0 (SPSS Inc, Chicago).
RESULTS
A total of 65 green turtles were captured. At BE, of the 33 turtles, 14 were captured in August 2006 (cold season) and 19 were captured in February 2006 (warm season). At CD, 20 turtles were captured in August 2006, while at PN, 14 turtles were captured during 2006–2007.
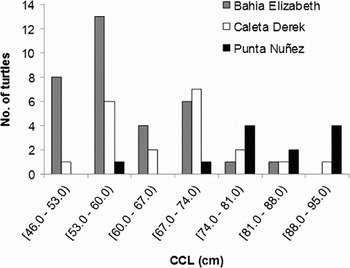
At BE 97% (N = 32) of captured turtles were categorized in Group I (CCL < MNS), whereas 3% (N = 1) were categorized in Group II (CCL ≥ MNS). At CD 95% (N = 19) of captured turtles were categorized in Group I and 5% (N = 1) were categorized in Group II. At PN, 42% (N = 5) were categorized in Group I, whereas the remains 58% (N = 7) were categorized in Group II. Significant differences were found between mean size of turtles captured in the three study sites (F2, 64 = 21.44; P < 0.01) (Figure 2). Turtles at PN (mean CCL = 81.02 ± 10.40 cm) were the largest compared to turtles captured at CD (mean CCL = 66.84 ± 10.76 cm) and BE (mean CCL = 59.14 ± 9.31 cm). No significant differences were found in the sizes of turtles captured during warm versus cold seasons (F1, 32 = 1.38; P > 0.05) at BE.
Size-classes of green sea turtles captured in the three study sites: Bahia Elizabeth (N = 33), Caleta Derek (N = 20), Punta Nuñez (N = 12).

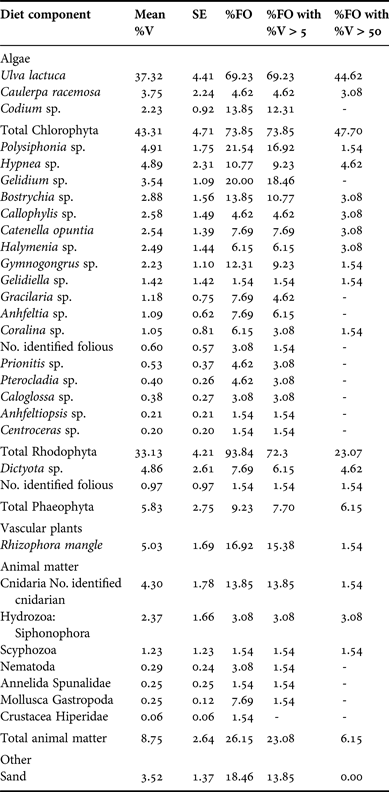
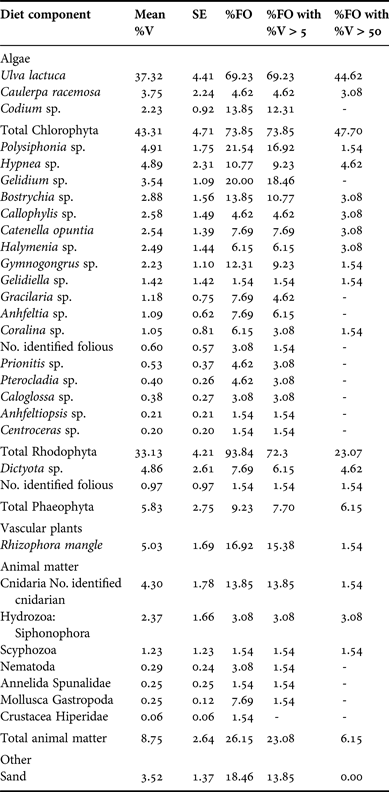
Mean oesophageal sample volume was 3.15 ± 2.00 ml at PN (N = 12), 7.21 ± 6.26 ml at CD (N = 20) and 5.18 ± 4.67 ml at BE (N = 14). Diet components consumed by green turtles in the Galapagos Islands are shown in Table 1. Due to the lack of taxonomic keys for identifying the marine flora of the Galapagos Islands and the high endemism (29%) of algae reported in this area by Garske (Reference Garske, Danulat and Edgar2002), most of the algae were only identified to genus level. Green turtles fed mainly on algae (mean relative volume = 82.27%) but also on mangrove (mean relative volume = 5.03%) and animal matter (mean relative volume = 8.75%). In terms of relative abundance, green algae were the major dietary constituent, followed by red algae (Table 1). However, this did not reflect the species richness in the diet (3 species of green algae and 18 species of red algae). Five components were the most important in terms of relative abundance in the diet (V ≥ 5%): Ulva lactuca, Polysiphonia sp., Hypnea sp., Dictyota sp. and the red mangrove Rhizophora mangle. While the algae Prionitis sp., Pterocladia sp., Caloglossa sp., Anhfeltiopsis sp. and Centroceras sp. were only found in small quantities (V ≤ 1%).
Diet of the green sea turtle at three study areas in the Galapagos Islands. Table shows relative abundance of food items (%V ± standard error (SE)) and frequency of occurrence (%FO). %FO with %V > 5 and %V > 50 represent the percentage of samples in which the diet item was found to contribute more than 5% and 50% of relative volume.
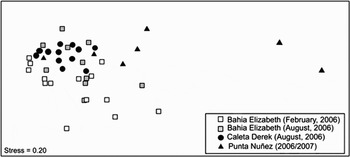
The ANOSIM showed that diet sample composition can differ between places and seasons, based on the presence and absence of the alimentary components (significance level = 0.10%; P < 0.01). However, similarity in diet of green turtles at BE and CD in August is evident according to the MDS analysis (Figure 3). This similarity is attributed to the presence of U. lactuca, Polysiphonia sp. and Gelidium sp. in the diet of turtles at both sites. While differences in the samples compared to PN are principally because of the presence of Hypnea sp., Caulerpa racemosa and Dictyota sp., algae that were only found in the samples from PN.
Two-dimensional multidimensional scaling grouping samples by study site, using a presence/absence matrix of the diet items in the samples (N = 65). Points that appear close together show higher similarity in the food items assemblages than those that appear distant.

Although U. lactuca was a common item in the diet of turtles from the three study areas, it was ingested in different proportions (Welch ANOVA F2, 28.81 = 64.01; P < 0.001). The weighted resultant index (Rw) shows that U. lactuca is the main food item in the diet of green turtles at BE and CD (Figure 4), with greater prevalence in diet of green turtles at CD (Rw = 98.45). On the other hand, primary diet components according to the Rw at PN were Hypnea sp. > Dictyota sp. > Caulerpa racemosa.
Importance of the primary food items (V > 5%) consumed by green turtles in three study areas in the Galapagos Islands. Weighted resultant index (Rw) denotes the order of importance of the food items in the diet. Bahia Elizabeth (N = 14): (1) Ulva lactuca, (2) Polysiphonia sp., (3) Hidrozoa, (4) Rhizophora mangle; Caleta Derek (N = 20): (1) Ulva lactuca, (2) Codium sp.; Punta Nuñez (N = 12): (1) Hypnea sp., (2) Dictyota sp., (3) Caulerpa racemosa, (4) Ulva lactuca, (5) Gelidium sp.

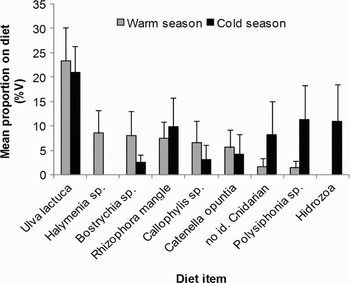
Diet of turtles in the warm season at BE had greater species richness than that during the cold season (χ2 = 16.84, df = 6; P < 0.05). Figure 5 shows the comparison of relative abundance of food items that were important (V > 5%) in at least one season at BE. Ulva lactuca was the most important item in both seasons and the level of consumption of this item did not change significantly (Welch ANOVA F1, 28.06 = 0.28; P > 0.05).
Mean proportion (%V ± SE) of major food items (V > 5%) in the diet of the green turtle during two seasons in the Galapagos Islands. This figure represents the two sampling events in Bahia Elizabeth: warm season (N = 19) and cold season (N = 14).

DISCUSSION
The present study shows that the Galapagos Islands coasts provide a variety of food resources for juvenile and adult green turtles. According to the MNS (86.7 cm CCL) criterion as a proxy threshold for estimating maturity, dominant size-classes of green turtles that aggregate at BE and CD (46–74 cm CCL) corresponded to juvenile individuals, while at PN the size-range (74–95 cm CCL) corresponded to large juveniles and presumed adult individuals. This provides further evidence that green turtles show some degree of ontogenetic habitat preference, with the largest turtles tending to aggregate at higher-energy coastal areas and smaller individuals at shallow protected areas (Seminoff et al., Reference Seminoff, Jones, Resendiz, Nichols and Chaloupka2003; López-Mendilaharsu et al., Reference López-Mendilaharsu, Gardner and Seminoff2005; Koch et al., Reference Koch, Brooks and Nichols2007). Ontogenetic habitat shift has been also suggested to occur with loggerhead (Caretta caretta) (Tomas et al., Reference Tomas, Aznar and Raga2001) and Kemp's ridley (Lepidochelys kempii) turtles (Schmid et al., Reference Schmid, Bolten, Bjorndal, Lindberg, Percival and Zwick2003) which may be a strategy that confers an advantage for turtles to increase growth rates (Bjorndal et al., Reference Bjorndal, Bolten and Martins2000) and survival (Schmid et al., Reference Schmid, Bolten, Bjorndal, Lindberg, Percival and Zwick2003; Koch et al., Reference Koch, Brooks and Nichols2007).
Green turtles in the Galapagos Islands mainly feed on algae. The reports of Green & Ortiz-Crespo (Reference Green, Ortiz-Crespo and Bjorndal1982) and Green (Reference Green, Schroeder and Witherington1994) did not provide a detailed list of the algae species present in the green turtle diet, thereby precluding long term comparisons with the present study. However, we speculate that local significant changes in algae communities (Robinson, Reference Robinson, Robinson and del Pino1985; Vinueza et al., Reference Vinueza, Branch, Branco and Bustamante2006) related to strong El Niño Southern Oscillation (ENSO) events during 1982–1983 and 1997–1998, could have induced changes in green turtle diet composition along the time, as have occurred in the Hawaiian archipelago (Russell & Balazs, Reference Russell and Balazs2009).
Changes in green turtle diet composition during both seasons at BE are probably due to seasonal changes in vegetation availability. Garske (Reference Garske, Danulat and Edgar2002) reported seasonal patterns in the marine flora of the Galapagos Islands, especially in the Western Galapagos region where BE is located.
The diet composition of green turtles may change as the algal biomass and cover decline from the cool to warm season, as has been found with other herbivores that feed on similar algae species (e.g. Ulva), such as the marine iguana (Amblyrhynchus cristatus) (Sheperd & Hawkes, Reference Sheperd and Hawkes2005). Although, biomass of Ulva reduces significantly during the warm season (Vinueza et al., Reference Vinueza, Branch, Branco and Bustamante2006) no significant differences were found in its consumption proportion by the green turtle in both seasons, which suggest selection of this resource, yet when it is scarce. But the fact that turtles in the warm season consume a higher diversity of red algae, suggests that in this season turtles consume more food items to complete their food requirements. We also expect seasonal changes in diet composition of turtles that feed at CD and PN, due to changing oceanographic features, particularly because of upwelling processes, which causes differential patterns in algae composition on Galapagos Islands coasts (Garske, Reference Garske, Danulat and Edgar2002).
Algae assemblages that make up the diet of green turtles are different between study sites. Diet composition is more similar at BE and CD, likely due, at least in part to the close proximity of these two sites and the consistency of available algae (Figure 1). In addition, BE and CD are located in the same region (Western Galapagos Islands) and algae composition may be relatively homogeneous (Garske, Reference Garske, Danulat and Edgar2002). PN is located in the Eastern Galapagos Islands where higher sea surface temperatures occur (Banks, Reference Banks, Danulat and Edgar2002), which causes the observed differences in algae assemblages (Garske, Reference Garske, Danulat and Edgar2002). The fact that site-specific composition of the diet of green turtles varies over a short geographical scale was also reported in the Hawaiian Islands (Arthur & Balazs, Reference Arthur and Balazs2008). This underscores the adaptive nature of green turtle foraging strategies, which is likely driven by local food availability.
The proportion of green algae in the diet of green turtles reported in the present study is higher than most previous green turtle diet studies. Whereas we found that green algae constituted 43.3% of the diet of green turtles, it is 11.6% in the Hawaiian archipelago (Arthur & Balazs, Reference Arthur and Balazs2008), 9% on the west coast of the Baja California Peninsula (López-Mendilaharsu et al., Reference López-Mendilaharsu, Gardner and Seminoff2005), 6.2% in the Gulf of California, Mexico (Seminoff et al., Reference Seminoff, Resendiz and Nichols2002), and 5.11% in Texas, USA (Coyne, Reference Coyne1994), all four sites of which green turtles feed mainly on red algae. Red algae are generally higher in protein and energy content, and digestibility than green algae (especially Ulva) (Wong & Cheung, Reference Wong and Cheung2001; Rubenstein & Wikelski, Reference Rubenstein and Wikelski2003), which suggest that green turtle diet in the Galapagos Islands may have less nutritional content compared with turtles in other foraging grounds where they consume red algae at higher extent.
The green turtle, unique among sea turtles in feeding on macroalgae, may be variously stressed by ENSO events in the Galapagos Islands, when algae biomass decline, and only algae of poor food quality persists (e.g. Ulva spp.) (Laurie, Reference Laurie and Glynn1989). Strong ENSO events in the Galapagos Islands have caused drastic declines of growth rates and number of other herbivores, such as marine iguanas (Amblyrynchus cristatus) and the ‘zayapa’ crab Grapsus grapsus (Laurie & Brown, Reference Laurie and Brown1990; Vinueza et al., Reference Vinueza, Branch, Branco and Bustamante2006). Despite that no studies have focused on the effect of ENSO on green turtles in the Galapagos Islands, it is suggested that it may profoundly influence green turtle nutrient intake, and consecutively produce a decline of growth rates and a delay of the size-at-maturity. Nutrient deficiencies caused by ENSO can also reduce the reproductive output of green turtles, by not allowing nesting females to reach the required body condition to breed, which may drive interannual variation in nesting numbers, as has been reported at the north coast of Australia (Limpus & Nicholls, Reference Limpus and Nicholls1988).
The green alga Ulva lactuca was the preferred food of green turtles in BE and CD, whereas in PN the preferred items were C. racemosa, Hypnea sp. and Dictyota sp. By means of visual surveys on the sea floor in adjacent coasts of CD and BE, it was evident that U. lactuca was the most abundant algae, covering most of the rocky bottom, where turtles were usually observed performing feeding activities. In contrast, the most abundant algae species at PN are C. racemosa, Hypnea sp. and Dictyota sp. (Garske, Reference Garske, Danulat and Edgar2002). This coincidence in algal abundance in marine habitats and in our lavage samples suggests that green turtles consume the most readily available food at the foraging areas at which they inhabit. This is consistent with previous findings by Balazs (Reference Balazs1980), Garnett et al. (Reference Garnett, Pirce and Scott1985) and Forbes (Reference Forbes1996).
The red mangrove R. mangle (mainly shoots) constitutes 5% of the diet of the green turtle in the Galapagos Islands. The consumption of this item by green turtles in the Galapagos Islands was previously reported by Pritchard (Reference Pritchard1971), and was reported in other foraging areas such as Gorgona Island (Colombia) (Amorocho & Reina, Reference Amorocho and Reina2007) and Australia (Limpus & Limpus, Reference Limpus and Limpus2000). Somewhat interesting is the fact that the red mangrove is substrate for the epiphytic algae Catenella opuntia, Bostrychia spp. and Caloglossa spp. (Skelton & South, Reference Skelton and South2002; personal observation), that were consumed by turtles at BE, a site with ample supply of red mangroves around the lagoon. Catenella opuntia and Bostrychia sp. were consumed in a proportion higher than 5% in the warm season (Figure 5), so they may be target dietary components for green turtles. On the other hand, consumption of red mangrove was higher (> 5%) during the cold season when the consumption of epiphytic species was < 5% (Figure 5), thus it seems that red mangrove consumption is not incidental. This reflects the significance of the red mangrove as a food resource and a foraging habitat for juvenile green turtles at BE.
Turtles in our study also consumed a number of items at trace levels. These items may be incidentally consumed as they could be associated with the substrate of algae preferred by green turtles. Incidental consumption of some species have been reported for green turtles elsewhere (Seminoff et al., Reference Seminoff, Resendiz and Nichols2002; Ferreira et al., Reference Ferreira, Garcia, Jupp and Al–Kiyumi2006; Fuentes et al., Reference Fuentes, Lawler and Gyuris2006; López-Mendilaharsu et al., Reference López-Mendilaharsu, Gardner, Riosmena-Rodríguez and Seminoff2008). In our study, items consumed incidentally may include all species that contribute less than 1% of relative volume in the diet, such as Prionitis sp., Pterocladia sp., Anhfeltiopsis sp., Centroceras sp. and some invertebrates (Table 1). We believe the frequent presence of sand in lavage samples is a consequence of the type of habitat used by green turtles and the result of incidental consumption of substrate material while foraging.
Invertebrates comprised only 8.75% of the total dietary abundance of green turtles in the Galapagos Islands. Only cnidarians (Scyphozoa, Siphonophora) were found at a level that warranted consideration as a major diet item (7.9% of relative volume). Whether these foods were consumed incidentally or purposely remains unresolved. However, even those invertebrate foods found at trace levels (nematodes, annelids, molluscs and crustaceans) may contribute vitamins, minerals and essential amino acids (Bjorndal, Reference Bjorndal1990) and thus provide nutritional benefits.
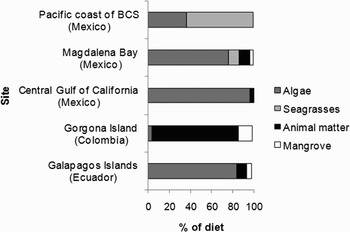
The herbivory tendency of the green turtle found in this study, supports the most common feeding pattern of post-pelagic green turtles (Bjorndal, Reference Bjorndal, Musick and Lutz1997) and is not consistent with other studies that suggest that green turtles in the EPO may consume high amounts of animal matter (Carr, Reference Carr1952; Bjorndal, Reference Bjorndal, Musick and Lutz1997; Amorocho & Reina, Reference Amorocho and Reina2007) (Figure 6). These spatial differences in diet composition along the EPO suggest that post-pelagic green turtles have the capability to adopt different feeding strategies, possibly in response to local abundance and type of resources.
Proportion (%) of the main diet groups of the green turtle in five foraging grounds along the Eastern Pacific Ocean: Pacific coast of the Baja California Peninsula (López-Mendilaharsu et al., Reference López-Mendilaharsu, Gardner and Seminoff2005), Magdalena Bay (López-Mendilaharsu et al., Reference López-Mendilaharsu, Gardner and Seminoff2005), Central Gulf of California (Seminoff et al., 2002), Gorgona Island (Amorocho & Reina, Reference Amorocho and Reina2007), Galapagos Islands (this study).

Conservation implications
The Galapagos Islands coasts provide several habitats that appear to be characterized by unique algae assemblages and different geophysical and oceanographic conditions, which may drive green turtle ontogenetic habitat shifts. Thus, it is important to protect these different habitats as they provide food to complement green turtle's energetic requirements for growth at different maturity stages. Thanks to the GMR zoning scheme, most, although not all, of the green turtle foraging grounds on the Galapagos Islands coasts are totally protected. This zoning scheme divides the coastal line in three subzones according to the allowed human activities. In the case of our study areas, these are not totally protected (see study areas description) which could represent a threat for green turtles.
Despite the great usefulness of the GMR zoning scheme for conservation purposes, it is important to identify critical endangered species habitats for conservation. In the case of areas with high aggregation of green turtles, where tourism activities are allowed, it is necessary to promote better tourism practices and control of boat traffic, as they alter turtle behaviour during resting and feeding activities (González, Reference González2008). These management efforts will assure the continued health of the local green turtle population and will provide an opportunity to continue studying green turtles in a near ‘pristine’ condition.
ACKNOWLEDGEMENTS
This work was possible thanks to the logistic support of the Charles Darwin Foundation (FCD), the monitoring permission given by the Galapagos National Park Service (PNG) and the economic support of the NOAA—National Marine Fisheries Service. A special thank you goes to the volunteers who helped in field work. We gratefully acknowledge Peter Dunn for his sage advice and continual support of our research. Thanks to R. Pépolas and J. Delgado for their support during the Punta Nuñez field trips, and to A. Harris for her assistance in algae identification. S. Ron, L. Coloma, T. DeVries, R. Riosmena-Rodríguez, D. Sage, I. Chapa, J. Rodríguez, L. Vinueza, J. Alvarado and C. Fernández gave valuable contribution to enhance the research and in many ways to improve the paper. This work was supported by the NOAA National Marine Fisheries Service, Southwest Fisheries Science Center, La Julla, California, USA.