1. Introduction
This paper proposes to construct a new series of Brazilian sugar imports by Portugal between 1761 and 1807. The unpublished data were derived from customs documentation of Lisbon and Porto, the two main Portuguese ports at the time. The new customs data collected provides quantities, Brazilian origin, quality, and taxes of the sugar. Based on the results of the empirical research, we demonstrate and corroborate the Brazilian sugar renaissance in the second half of the eighteenth century, a period of crisis in the colony’s mining industry and in the Portuguese trade balance.Footnote 1 The growth of the sugar economy in the colony contributed to the adjustment of Portugal’s external accounts. The new information has allowed us to verify the increase in Brazilian sugar exports, especially after in the early 1770s, despite the stagnation of the Portuguese economy.Footnote 2 The expansion is explained by favorable conditions both internal to the colony and external, whether Portuguese, African, or from other countries and their domains.
The Atlantic sugar market involved three continents, not only European consumption and American production, but also the abundant supply of enslaved workers from Africa.Footnote 3 Sugar experienced a growing consumer market in Europe throughout the eighteenth century, including in Portugal. The role of sugar in the European economy was a key commodity for the “Industrious Revolution” hypothesis.Footnote 4 This demand was primarily met by the boom in commodity production in the French, English, and Spanish Caribbean, which benefited from the Atlantic slave trade. Despite Brazil’s initial leadership in supplying this market until the first half of the seventeenth century, significant investments in Caribbean plantations by major European powers reduced Brazil’s role to a relatively minor supplier.Footnote 5 Brazilian sugar exports had stagnated by the middle of the eighteenth century.Footnote 6 In the last quarter of the eighteenth century, two major American conflicts impacted this market: the US War of Independence and, mainly, the revolution in Haiti.Footnote 7 The decline in production in the British Caribbean after the Napoleonic wars and the end of slavery allowed for a new expansion of Brazilian sugar exports.Footnote 8 The various international conflicts of the period had significant effects on competitors in the Caribbean and also on the demand for sugar in Europe. The price fluctuations of this precious commodity reflected the different influences of the period. Finally, the problems with competitors, the growth of demand and the prosperity of the slave trade contributed to the Brazilian sugar renaissance in this Atlantic context.
Portugal maintained a significant trade deficit with foreign nations, particularly England, in the mid-eighteenth century.Footnote 9 The metropolitan policies of Pombal’s consulate helped in the expansion of colonial agricultural production, aiming to adjust the trade balance and increase tax revenue. Among these policies, we can mention the appointment of qualified governors and the creation of Erário Régio and trading companies, in particular Pernambuco and Paraíba.Footnote 10 The process of accumulating human and material resources in the colony during mining benefited investments in sugar production at a later stage, particularly in the Southeast region. The spread of knowledge about the manufacturing method also facilitated the expansion of sugar mills into new areas, such as São Paulo and, especially, Campos dos Goytacazes in Rio de Janeiro. Additionally, colonial demographic growth and the slave trade with colonial products contributed to sugarcane investments.Footnote 11
The expansion of the sugar trade was a crucial element of Brazil’s agricultural renaissance, as it was the colony’s primary export product at the time. The increasing volumes of Brazilian sugar reached not only the Portuguese market, but mainly the European market. The response of the Portuguese Empire, including its domination of American and African territories, made it possible to supply larger quantities of sugar, thereby boosting a significant part of the colony. Despite the Brazilian agricultural renaissance, Portugal experienced no economic growth at this time; however, it increased tax revenue and contributed to the reduction of the trade deficit. Thus, from this constructed series, we shed light on the economic dynamics of a significant part of the colony, which produces sugars, and the metropolis, which consumes and re-exports them.
In the first section of the article, we present the sources used, primarily the unpublished ones, and describe how the data were processed. We highlight the advantages of our series in comparison to existing works in historiography. In the second section, we select data from Portugal’s trade balances to quantify the import and re-export of sugar between 1776 and 1807, estimating domestic consumption and the destinations of the product sent abroad. We demonstrate that sugar accounted for a significant percentage of Portuguese exports. Subsequently, we complement this with new documentary evidence for the origin of sugar in Brazil for a broader period. This allowed us to establish the dynamic production of the traditional and news regions between 1765/66 and 1807. In the fourth section, we present our continuous series of sugar volumes imported from 1761 to 1807, comparing them with prices available in the literature, which enables us to estimate the values of this commodity when it was landed in Portugal. In this way, we analyze the moments and intensity of the expansion of the Brazilian sugar economy in this period. Finally, we relate the new series to the flows of the slave trade and their prices, as well as the estimated population growth of the sugar regions. Thus, we demonstrate the sugar renaissance, contributing to the growth of the colony and helping to adjust Portugal’s trade deficit.
2. Sources and methods
To construct the series, we consulted the customs books of Lisbon and Porto, available in the Torre do Tombo archive, relating to the taxation of sugar imported from the Brazilian colony. The period consulted began with the establishment of the Erário RégioFootnote 12 in 1761 until the beginning of the nineteenth century, computing the following microdata for each daily tax assessment: quantity (in arrobasFootnote 13), quality (white or muscovado), value collected (in réis Footnote 14) and, when available, the port of origin in Brazil (generally Pernambuco, Bahia and Rio de Janeiro). For Lisbon, we consulted the Receita do Açúcar books and for Porto, the Ementa do Açúcar and Receita do Açúcar, when they were not available, the 4% aid tax (Donativo) books. In addition, we utilized the trade balances of Portugal, which serve as the classic source for foreign trade, including quantities and prices for each product, as well as the balance of imports and exports between the various Portuguese ports, colonies, and foreign nations. The balances widely used in the literature refer to a continuous and available period of research from 1796 to 1807. We consulted isolated and less informative trade scales for the years 1776, 1777, 1783, and 1787.Footnote 15 Finally, one of the reasons for using the balances is to compute the quantities and prices of sugar re-exports, allowing us to estimate apparent consumption in Portugal. The discussion on sugar trade has been expanded in terms of period and results beyond what is available in the literature.Footnote 16
We have extended the analysis to Lisbon through the documentation of sugar receipts at Alfândega Grande, which have been irregularly available since 1752, detailing quantity, origin, and product type. Additionally, we have used records of the 4% aid tax (Donativo) created after the 1755 earthquake.Footnote 17 Similarly, the notes and revenue records of sugar arriving from Brazil at Porto’s Customs provide a more detailed and regular view of this commodity’s trade, especially from 1766 onward.Footnote 18 Thus, we extended the analysis period based on these new and more serialized pieces of information from similar sources, although each had its own form of tax record keeping. This effort filled data gaps observed in historiography.Footnote 19 Consequently, this new series was constructed through unpublished manuscript sources from the customs of Lisbon and Porto.
The advantages of the new series constructed to historiography were (a) filling gaps of years and a series for a more extended period for each of the two main Portuguese ports: Lisbon and Porto; (b) measuring quantities in arrobas, as this was a more precise fiscal measurement than the sugar boxes that had different sizes, frequently used by literatureFootnote 20; (c) providing the quality of the sugar, limited to white and muscovado types, as they paid different taxes (for the sugar tax in Lisbon it was 400 réis per arroba of white and 200 réis per arroba of muscovado); and (d) reporting on tax revenue and the ports of departure in Brazil. The problems arise from the information being of fiscal origin, subject to exemptions and evasion. In addition, we included damaged loads when calculating the quantity. The collection was based on quantities, so variations in sugar prices did not affect the amount taxed per arroba.
To calculate the tax on goods, customs applied a fixed price (pauta) or a fixed rate per quantity. Therefore, no information on market prices for sugar is available in the customs documentation consulted. The trade balances show the import and export prices of sugar, but they are restricted to a limited period. We searched the historiography for different annual reports on sugar prices for that period, to calculate the imported values of the product. We chose the series constructed by PWR (Prices, Wages, and Rents in Portugal 1300–1910) because it is more complete.Footnote 21 The PWR price index deflated these prices. Thus, we calculated the nominal and real values of sugar imported by Portugal.
3. Imported and exported sugar by Portugal in trade balances (1776–1807)
Portugal’s trade balances with its territories and foreign nations were produced by the Superintendência Geral dos Contrabandos.Footnote 22 Economic historians have used this documentation in classic works, such as Simonsen (Reference Simonsen2005), initially published in 1937, and later by Novais (Reference Novais1979) and Arruda (Reference Arruda1980), mainly addressing more aggregated of trade between the colony and the metropolis.Footnote 23 We use them again to form an initial perspective more focused on sugar between 1776 and 1807.Footnote 24 This product was very significant in the total imported from the colony and also in the exported by Portugal. In the case of exports, sugar represented between one-tenth and one-third of the total (10.5% in 1807 and 32.4% in 1800).Footnote 25 Sugar was one of the main products of Portuguese foreign trade.
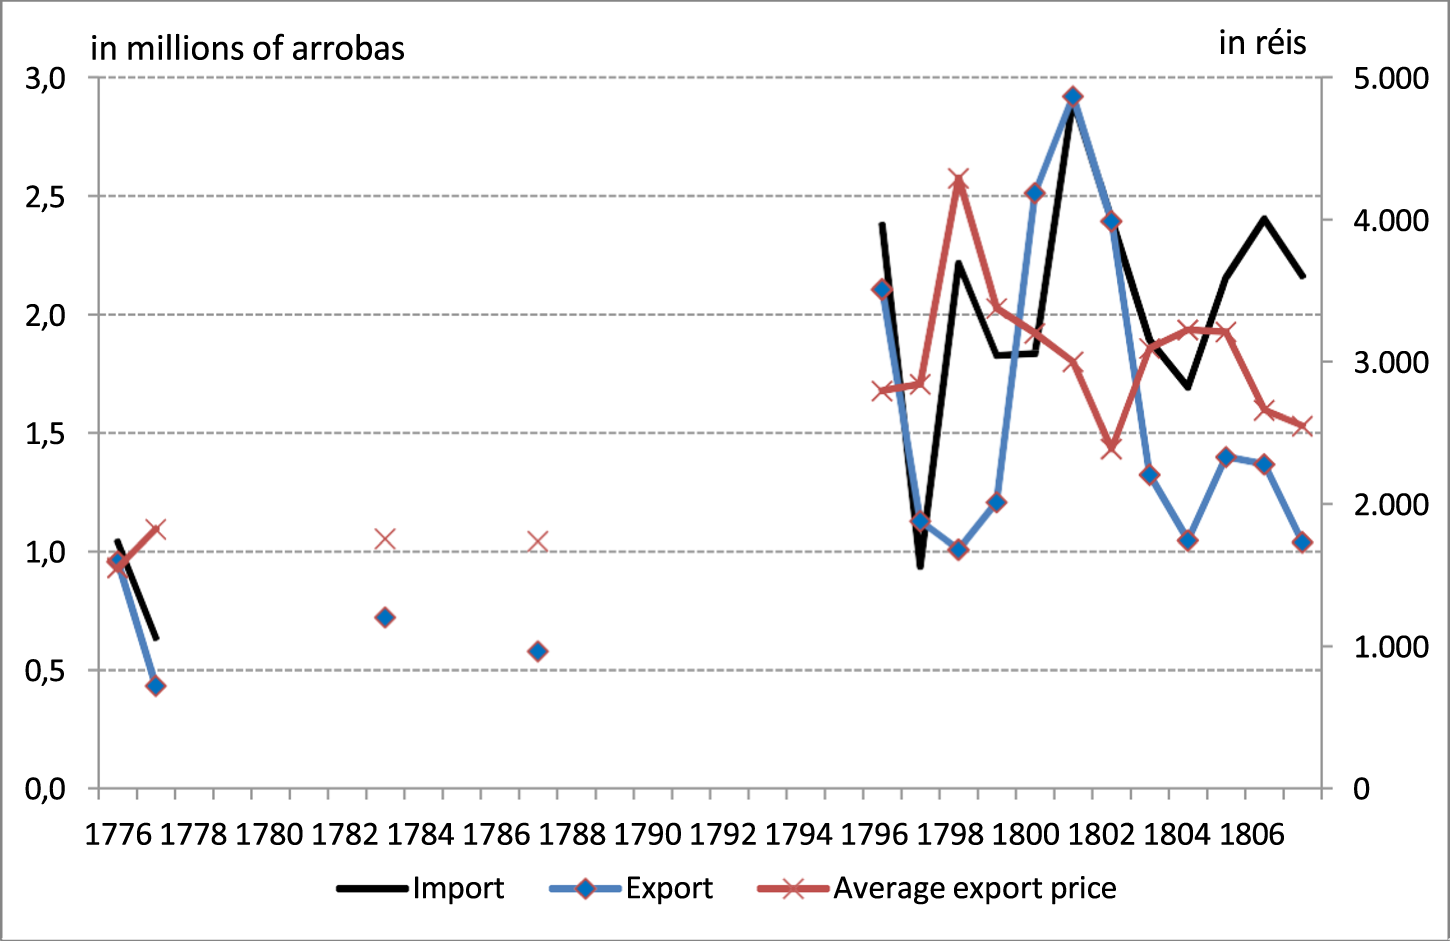
In Graph 1, we provide the quantity of Brazilian sugar imported and re-exported by Portugal for all qualities. The two series of sugar imports and exports were closely related during the period, generally moving in the same direction from year to year. The differences between them can be attributed to variations in Portuguese consumption, losses during the re-exportation process, and fluctuations in inventory. In general, Brazilian imports exceeded Portuguese exports, although in some years the opposite occurred. In 1797, 1800, and 1801, more sugar left Portugal than entered, utilizing previous stocks.Footnote 26 In 1798 and 1799, a positive balance of net sugar inflows accumulated to just over 1.8 million arrobas, with a net outflow of almost 700,000 arrobas in the following two years. In the more continuous period of information between 1796 and 1807, we observe an entry of 24.8 million arrobas of sugar and an exit of about 19.5 million. Thus, this difference amounted to just over 5.3 million arrobas, accounting for 21.5% of the entries. Most of this sum can be attributed to Portuguese sugar consumption during this period, due to the persistent difference and its significant volume. Since the Portuguese population at that time was estimated at almost three million people, we can calculate an annual per capita consumption of just over two kilograms (2.27).Footnote 27 Portuguese per capita consumption was lower than that of the British, but similar to that of other continental European countries.Footnote 28
Nominal sugar prices help explain the variations in quantities, and vice versa. As can also be seen in Figure 1, the contraction of trade in 1777 compared to 1776 was accompanied by an increase in average export prices, widening the gap between imported and exported quantities.Footnote 29 Prices remained at this level in the two reports of the 1780s, but rose significantly at the end of the eighteenth century alongside higher amounts of traded sugar. Despite the limitations of the years available for the balances, quantities exported by Portugal showed no growth trend until 1787. The revolution in Haiti led to the decline of the main producer and a more substantial increase in prices. Later, economic blockades in Europe, stemming from the French and Napoleonic Revolutionary Wars, affected sugar distribution, leading to fluctuations in prices and trade flows. Between 1796 and 1807, we observe significantly higher volumes of imports and exports compared to those recorded in the 1770s and 1780s. As reported in the literature, the expansion of Brazilian sugar production appears to have occurred between 1787 and 1796, based on trade balances, which indicate that European consumption was higher than that of Portugal.
Import and export of sugar from Portugal (1776–1807).

Figure 1 Long description
A line graph showing the import, export and average export price of sugar from 1776 to 1806. The x-axis represents the years from 1776 to 1806. The left y-axis is labeled in millions of arrobas and the right y-axis is labeled in réis. The import data is represented by a black line, the export data by a blue line and the average export price by a red line. The graph shows fluctuations in all three metrics over the years, with notable peaks and troughs. Import and export quantities vary, with significant changes around the late 1790s and early 1800s. The average export price also shows variability, with several peaks and declines throughout the period.
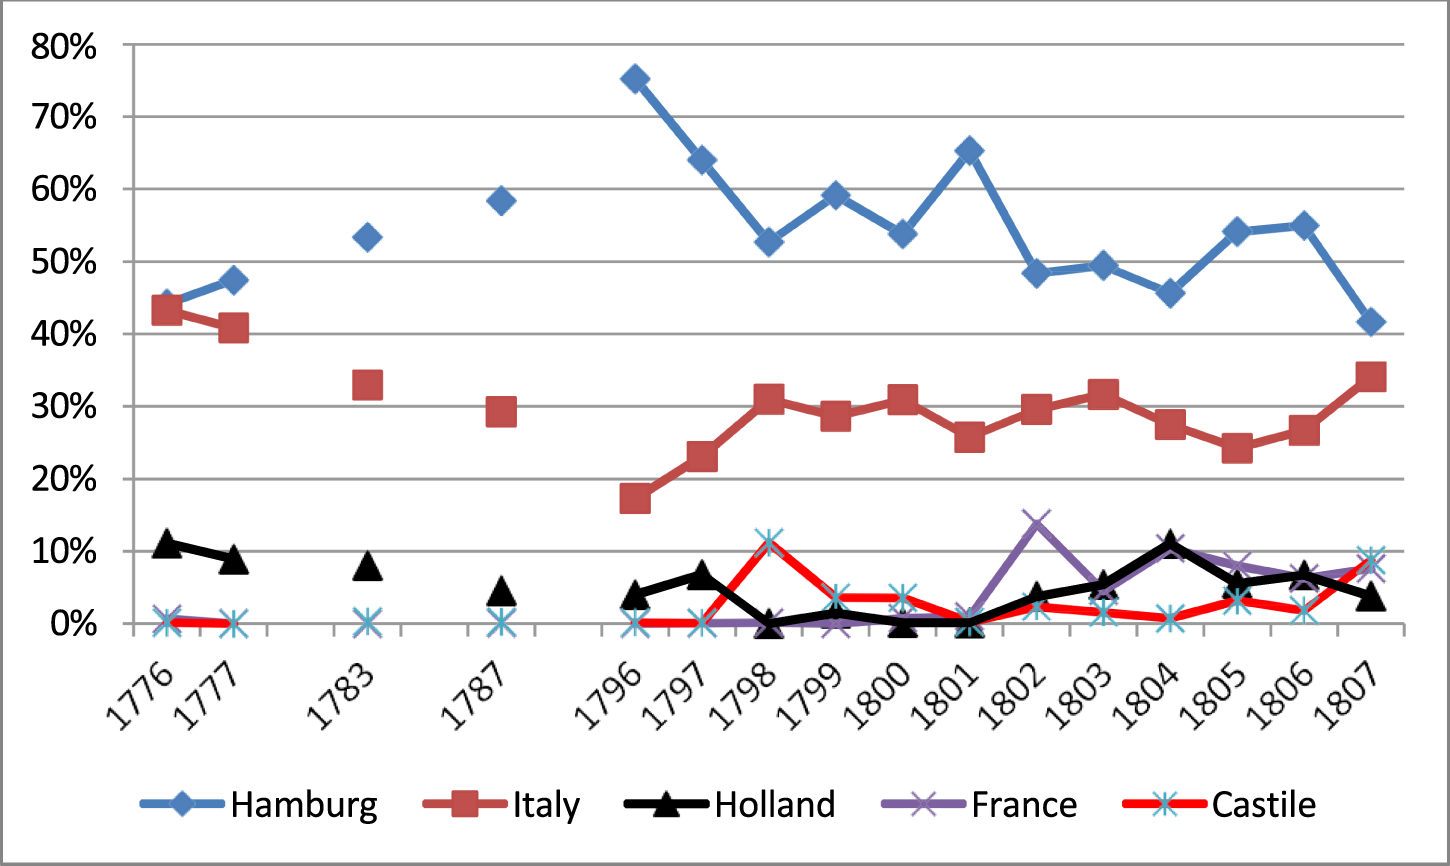
The primary destinations for re-exported sugar were Hamburg and the Italian regions, as seen in Figure 2. The former accounted for nearly half (45.2%) of Portuguese exports in 1776–1777. During the 1780s, the share of sugar exported to Hamburg rose to just over half (55.6%). Between 1796 and 1807, this destination’s share increased to 56.8%, although this trend had been decreasing over the preceding interregnum. Hamburg was a major port and redistribution center for goods in Central Europe, featuring a large number of sugar refineries and attracting key producers, primarily from France and England.Footnote 30 Portugal maintained significant trade with Hamburg since the seventeenth century, primarily exporting colonial goods.Footnote 31 In the second half of the eighteenth century, this trade expanded, benefiting from conflicts in Europe and the Caribbean that reduced the supply of French sugar in the Hamburg market.Footnote 32 Information from the Portuguese legation in Hamburg from 1790 to 1801 shows that the number of ships grew from 61 arriving from Portugal carrying 15,867 boxes of sugar in the first year to 129 ships and 36,448 boxes in 1801.Footnote 33 Despite a brief contraction in 1798, involving only 48 ships and 7,058 boxes, this was also reflected in the balances with the lowest Portuguese sugar exports in 1807, not just to Hamburg. Finally, the literature indicates that Hamburg remained the leading destination for Brazilian sugar imports in the 1830s, and it was only after 1840 that the United Kingdom became the primary importer.Footnote 34
Destination of Portuguese sugar exports (1776–1807).

Figure 2 Long description
A line graph showing the percentage of sugar exports to various destinations from 1776 to 1807. The x-axis represents the years and the y-axis represents the percentage from 0 percent to 80 percent. The destinations include Hamburg, Italy, Holland, France and Castile. Hamburg shows a fluctuating trend, starting at around 45 percent in 1776, peaking above 70 percent in 1796 and ending near 40 percent in 1807. Italy starts at about 40 percent in 1776, remains relatively stable and ends slightly above 20 percent in 1807. Holland, France and Castile have lower percentages, mostly below 10 percent, with minor fluctuations throughout the years.
The Italian regions were the second most important destination for Portuguese exports of Brazilian sugar, a trade that began in the sixteenth century. In the last quarter of the eighteenth century, Genoa was the primary market, accounting for 30.5% of exports in 1776–1777 and 22.7% in 1783 and 1787. Venice represented the second most important destination in Italy, comprising 12.1% in the first two years and 8.6% in the other two. Naples emerged as the third Italian market in terms of participation, though with much smaller shares, reaching a maximum of 1.4% in 1796.
The total of Italian ports’ sugar exports indicated a declining trend during the period. While in the years 1776–1777 the share reached 42.5%, almost rivalling Hamburg, in the two years of the 1780s, the sum reached 31.3% and later dropped to 27.2% in 1796–1807. However, during this last subperiod, there was a reversal of the general trend, with the Italian share starting to grow again.
The Netherlands was the third market for Portuguese sugar, regaining a slightly more prominent role during this time. In 1776–1777, its share was approximately one-tenth (10.4%). In the years 1783 and 1787, the share reduced to 6.5% of the total exports. Finally, between 1796 and 1807, the amounts contracted even further to approximately three percentage points (3.5%). European conflicts also hindered trade with this region. In this last subperiod, other destinations with small shares increased their participation, such as France with 4.3% and Castile with 2.6%. French growth occurred in the early years of the nineteenth century, likely due to difficulties in importing from the Caribbean resulting from the continental blockade. Moreover, there were still exports to Prussia and regions of Germany, accounting for 3.1% of the total.Footnote 35
Brazilian sugar entered Portugal through its two primary ports: Lisbon and Porto. Between 1796 and 1807, Lisbon accounted for 75.2% of the precious commodities entering Portugal, while Porto accounted for 24.8%. Viana held a tiny share of sugar entries (0.5%).Footnote 36 The share of exported sugar concentrated in Lisbon, reaching 73.4% in 1776–1777 and much more so in 1796–1807 (88.7%).Footnote 37 As previously mentioned, generally, the quantity of exported sugars was less than the import of this commodity. When specifically examining the two main ports, we observe that the net balance for Lisbon was significantly reduced between the two periods, with a considerable portion of the reduction directed towards consumption. The imperial capital accumulated a net import balance of 13.1% of the total in 1776–1777 and only 7.4% in 1796–1807. On the other hand, Porto increased its net sugar balance from a quarter of the total entered in 1776–1777 to 65.2% in 1796–1807. A small part of the sugar which entered in Porto was exported to Castile by land through Minho and Trás-os-Montes. Nevertheless, in this last period, the proportion of sugar imported by Porto that not re-exported grew, probably for consumption not only in the northern part of the country, but also unrecorded for Castile.Footnote 38 Thus, the peak of sugar imports into Portugal occurred between 1796 and 1807, destined mainly for continental Europe. Sugar became increasingly important in European consumption, demanding an increasing number of goods from Brazil.
4. Imports of sugar from Brazilian regions (1765/66–1807)
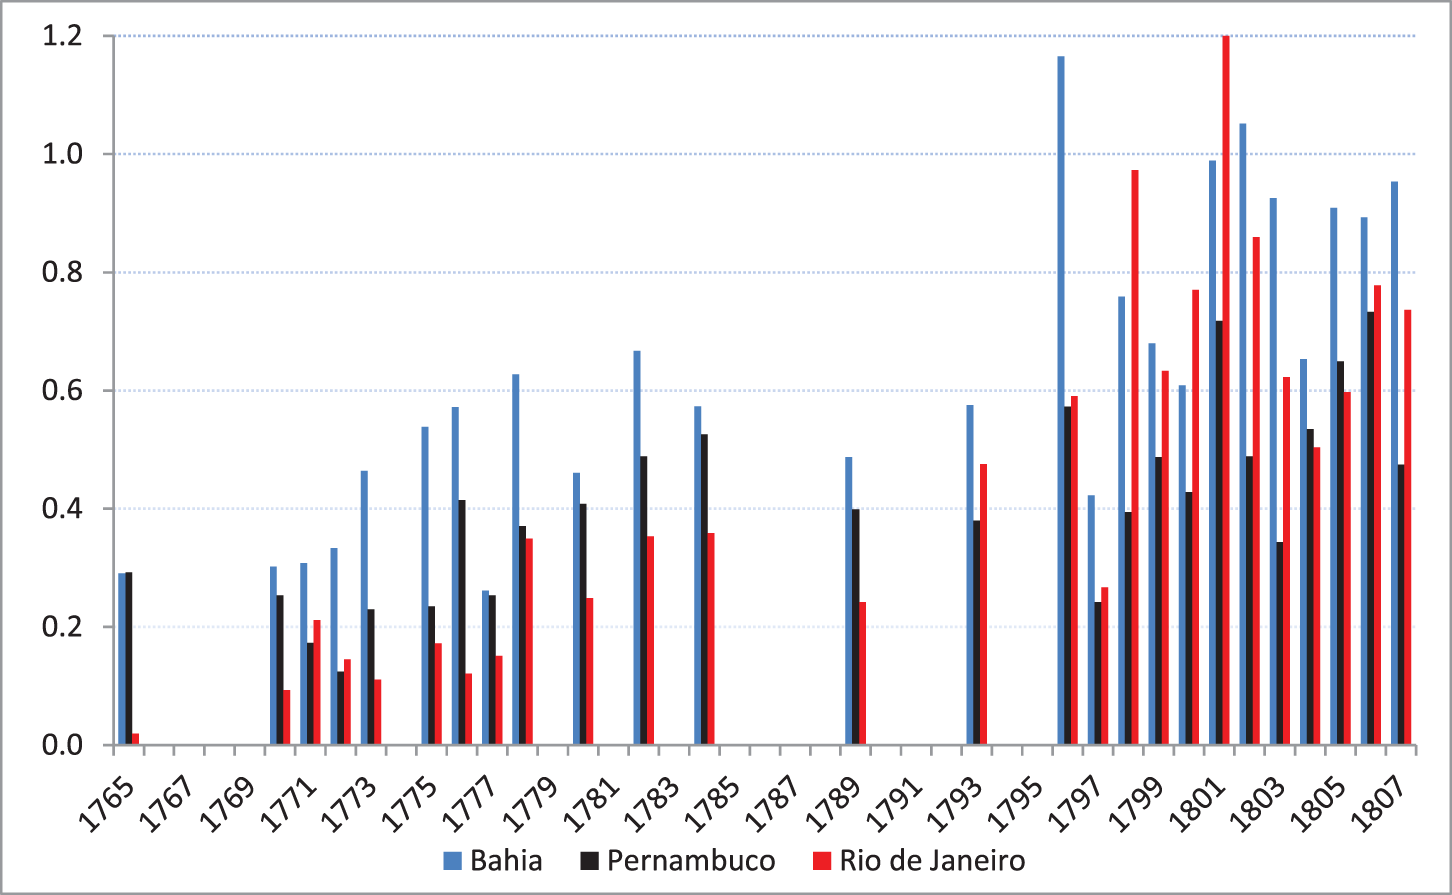
The expansion of sugar in the colony occurred differently across Brazilian regions during this period, due to specific conditions in each region. In this section, we incorporate new sources regarding the Brazilian origins of sugar arriving in Portugal into the trade balance reports, thereby expanding the analysis period, as shown in Figure 3. As had been the case since the seventeenth century, the captaincies’ shipping Brazilian sugar imported by Portugal was concentrated in the three main regions: Bahia, Pernambuco, and Rio de Janeiro.Footnote 39 A growing trend is observed in all three series, albeit with significant differences among them. The dynamic was more intense for Rio de Janeiro, which was the least relevant supplier of the three at the beginning of the period but became increasingly prominent over the years. Bahia showed a similarly significant increasing trend, slightly lower than that of Rio. Finally, as noted by other studies, Pernambuco exhibited a more limited expansion, mainly due to the growing interest in cotton in that region.Footnote 40 Although the two crops occurred in distinct ecological zones, there was a competition for labor and capital, especially in the last years under analysis.
Quantum of sugar imported by Portugal according to origin in Brazil (1765–1807).

Figure 3 Long description
The bar graph displays sugar imports to Portugal from three Brazilian regions: Bahia, Pernambuco and Rio de Janeiro, over the years 1765 to 1807. The x-axis represents the years, ranging from 1765 to 1807, while the y-axis shows the quantity of sugar imported, with values from 0.0 to 1.2. Each year features three bars, representing Bahia, Pernambuco and Rio de Janeiro. Bahia is shown with the tallest bars in most years, indicating higher sugar imports compared to the other regions. Pernambuco and Rio de Janeiro have varying import levels, with Rio de Janeiro showing significant growth towards the end of the period. The graph illustrates the dynamic changes in sugar import quantities from these regions over the specified years.
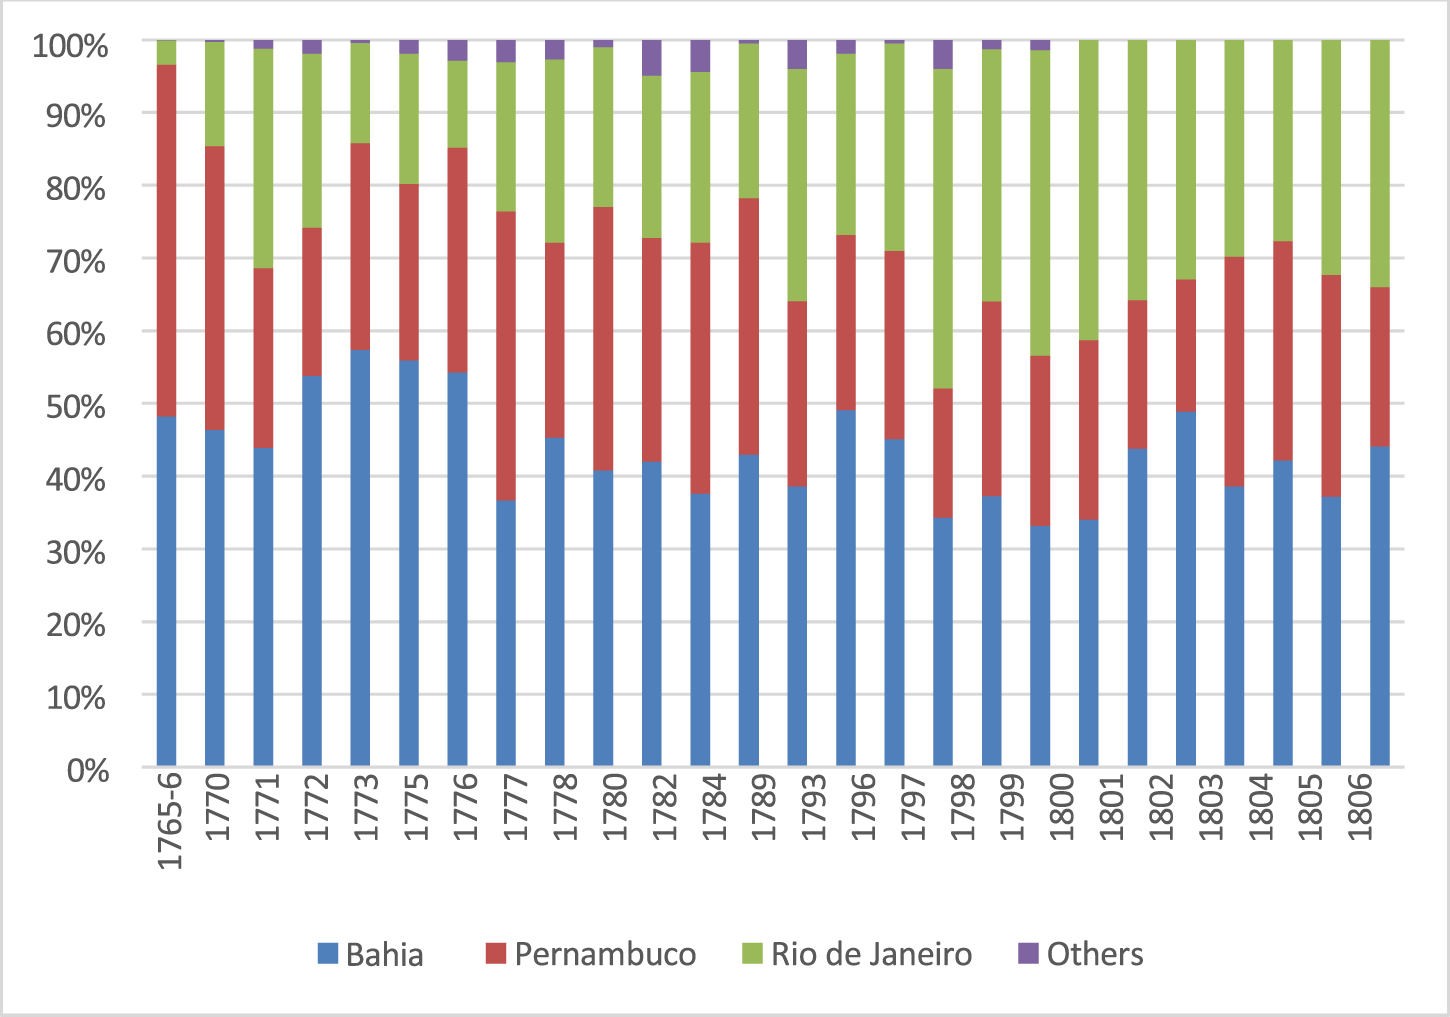
In Figure 4, we show the participation of the main Brazilian ports in the quantity of sugar unloaded in Portugal between 1765/66 and 1807. The three prominent Brazilian ports maintained fairly stable shares for most of the period under review.Footnote 41 Over the years, Bahia consistently supplied 41.8% of Brazilian sugars, Pernambuco contributed 27.2%, and Rio de Janeiro provided 29.9%. Although Bahia represented the primary sugar supplier in most years studied, exceptions occurred in 1765/66, 1777, 1800, and 1801. In 1765/66, Bahia and Pernambuco practically shared half of the sugar offerings. Rio de Janeiro had a significantly reduced share at that moment (3.3%).Footnote 42 In 1777, Pernambuco took the lead in sugar shipments, reaching 39.7%, followed by Bahia (36.7%), and to a lesser extent, Rio de Janeiro (20.5%). Finally, in 1800 and 1801, Rio de Janeiro led the origin of Brazilian imports for the first time in the years under analysis, reaching 42.0% and 41.3% of the total, respectively. Bahia maintained a third of the total in that last year, and Pernambuco just under a quarter (23.4% and 24.7%). Despite the greater growth in imports from Rio de Janeiro during the period, Bahia remained the main sugar supplier to Portugal.
Origin in Brazil of Portuguese sugar imports (1765–1807).

Figure 4 Long description
A stacked bar chart displays the percentage of sugar imports to Portugal from Brazilian ports between 1765 and 1806. The x-axis represents the years, starting from 1765-66 to 1806. The y-axis shows the percentage from 0 to 100 percent. The chart is divided into four categories: Bahia, Pernambuco, Rio de Janeiro and Others. Each category is represented by a different color. The chart illustrates the varying contributions of each port over the years, with Bahia, Pernambuco and Rio de Janeiro being the primary contributors. The proportions of each port's contribution change over time, reflecting shifts in sugar export dynamics during this period.
There is a significant difference in the Brazilian origins of sugar unloaded in Lisbon and Porto (see Table A1 in the Appendix). In the case of the former market, from 1765 to 1784, we observe that both Bahia and Pernambuco were the leading suppliers of sugar. By the end of the 1790s, Bahia had taken the lead in supplying Brazil to this market. Rio de Janeiro showed greater fluctuation in its share, assuming preeminence only in the years 1771, 1800, and 1801. In the Porto market, Bahia dominated the sugar supply until the early 1780s. From 1783, Rio de Janeiro took the lead in supplying this port. Pernambuco did not reach even a quarter of the total during the entire period analyzed for Porto.
On the other hand, Lisbon received the largest quantities of sugar from the three colonial markets in a more balanced fashion, with Pernambuco and later even Rio de Janeiro rivalling Bahia in certain years. Although the activities of the Companhia de Pernambuco e Paraíba in the early decades of the analysis occurred in both ports, it focused more on Lisbon.Footnote 43 This resulted in merchants proportionally transporting more sugar from Bahia and Rio de Janeiro to Porto. Thus, the prevalence of Rio de Janeiro sugars in the last decades among those landed in Porto demonstrated a stronger commercial relationship between the two markets.
Throughout the period, Pernambuco sugar consisted almost entirely of white sugar, which was of better quality. The concentration of this origin in a single destination market during the existence of the Companhia de Pernambuco and Paraíba favored a greater participation of the higher-quality commodity in Lisbon. Bahia sugar was divided almost equally between raw (muscovado) and white sugar, with a similar distribution in both markets throughout the entire period. Finally, Rio de Janeiro presented an intermediate quality differentiation between the markets of Pernambuco and Bahia. The differences in qualities between Brazilian regions persisted over time, regardless of the destination market in Portugal. Finally, we emphasize that the higher-quality sugar was more destined for the domestic market, and raw sugar was predominantly re-exported to be refined abroad.Footnote 44
In addition to quantities, we have the prices and values of sugars landed in Portugal. In 1776–1777, Bahia supplied almost half of the imported sugar (47.7%), followed by Pernambuco (34.2%) and Rio de Janeiro (15.2%). Finally, Paraíba held three percentage points of the total imported. When we examine the imported values, we notice a significant difference due to the distinctions in the quality of imported sugars.Footnote 45 The share of Bahia in the imported values reduced to 39.1%, very close to the share of Pernambuco (38.7%). Rio de Janeiro increased its share of the value-to-quantity ratio to 18.7% in 1776–1777. During this latter subperiod, raw sugar accounted for a higher proportion of the imported quantity from Bahia (46.4% of the total) than from Rio de Janeiro (18.8%) and, in particular, from Pernambuco (7.2%).Footnote 46 This affected the average price of imported sugar from these ports in the years 1776 and 1777, as it reached only 835 réis for Bahia, 1,155 for Pernambuco and 1,256 for Rio de Janeiro. In these two years, we still observed a prevalence of northeastern ports in the Brazilian sugar market, with Rio occupying a smaller share, one-fifth of the total, in both quantities and imported values.
A significant change in the distribution of sugar among the three main shipping ports was observed at the turn of the eighteenth to the nineteenth century. While Bahia remained the primary supplier, representing 40.3% of the total between 1796 and 1807, Rio de Janeiro assumed the role of the second-largest provider, reaching 34.4%. Pernambuco accounted for just under a quarter of the sugar imported by Portugal (24.5%). Paraíba sharply reduced its share to 0.3% of the total shipped between 1796 and 1807, being surpassed by São Paulo, which held 0.5%.Footnote 47 In terms of values compared to quantities, the differences between the ports were smaller in this subperiod compared to 1776–1777. There was a decrease in Bahia’s share and an increase in the others, mainly Pernambuco: Bahia (37.7%), Rio de Janeiro (35.5%), and Pernambuco (25.8%). The differences in the qualities of sugars from different regions were less significant at this time; however, Bahia still had the highest proportion of raw sugar (47.4% of the total), followed by Rio de Janeiro (23.4%), and finally Pernambuco (13.4%). Thus, the differentials in average prices of imported sugar also proved to be lower when compared to 1776–1777, reaching 1,977 réis for Bahia, 2,233 for Pernambuco, and 2,183 for Rio de Janeiro. The higher prices for Pernambuco and Rio de Janeiro sugars again helped reduce the significant difference in quantities in favor of Bahia. Thus, Rio de Janeiro surpassed the importance of Pernambuco in the Brazilian offer in this subperiod from 1796 to 1807, rivalling Bahia mainly in terms of values. Although there was a trend of sugar expansion for the three main ports between 1765 and 1807, it was more intense in the Rio de Janeiro region. The accumulation of resources generated by the mining economy contributed to the rise of sugar production in Rio de Janeiro, facilitated by the actions of the merchant elite, including involvement in the slave trade. The occupation of new lands in the Campos dos Goytacazes region and, to a lesser extent, in the captaincy of São Paulo allowed for an increase in exports through the port of Rio de Janeiro.Footnote 48 Despite the same general conditions of demand and supply, as we have seen, there were specificities for each of the Brazilian regions.
5. Sugar imports by Portugal (1761–1807)
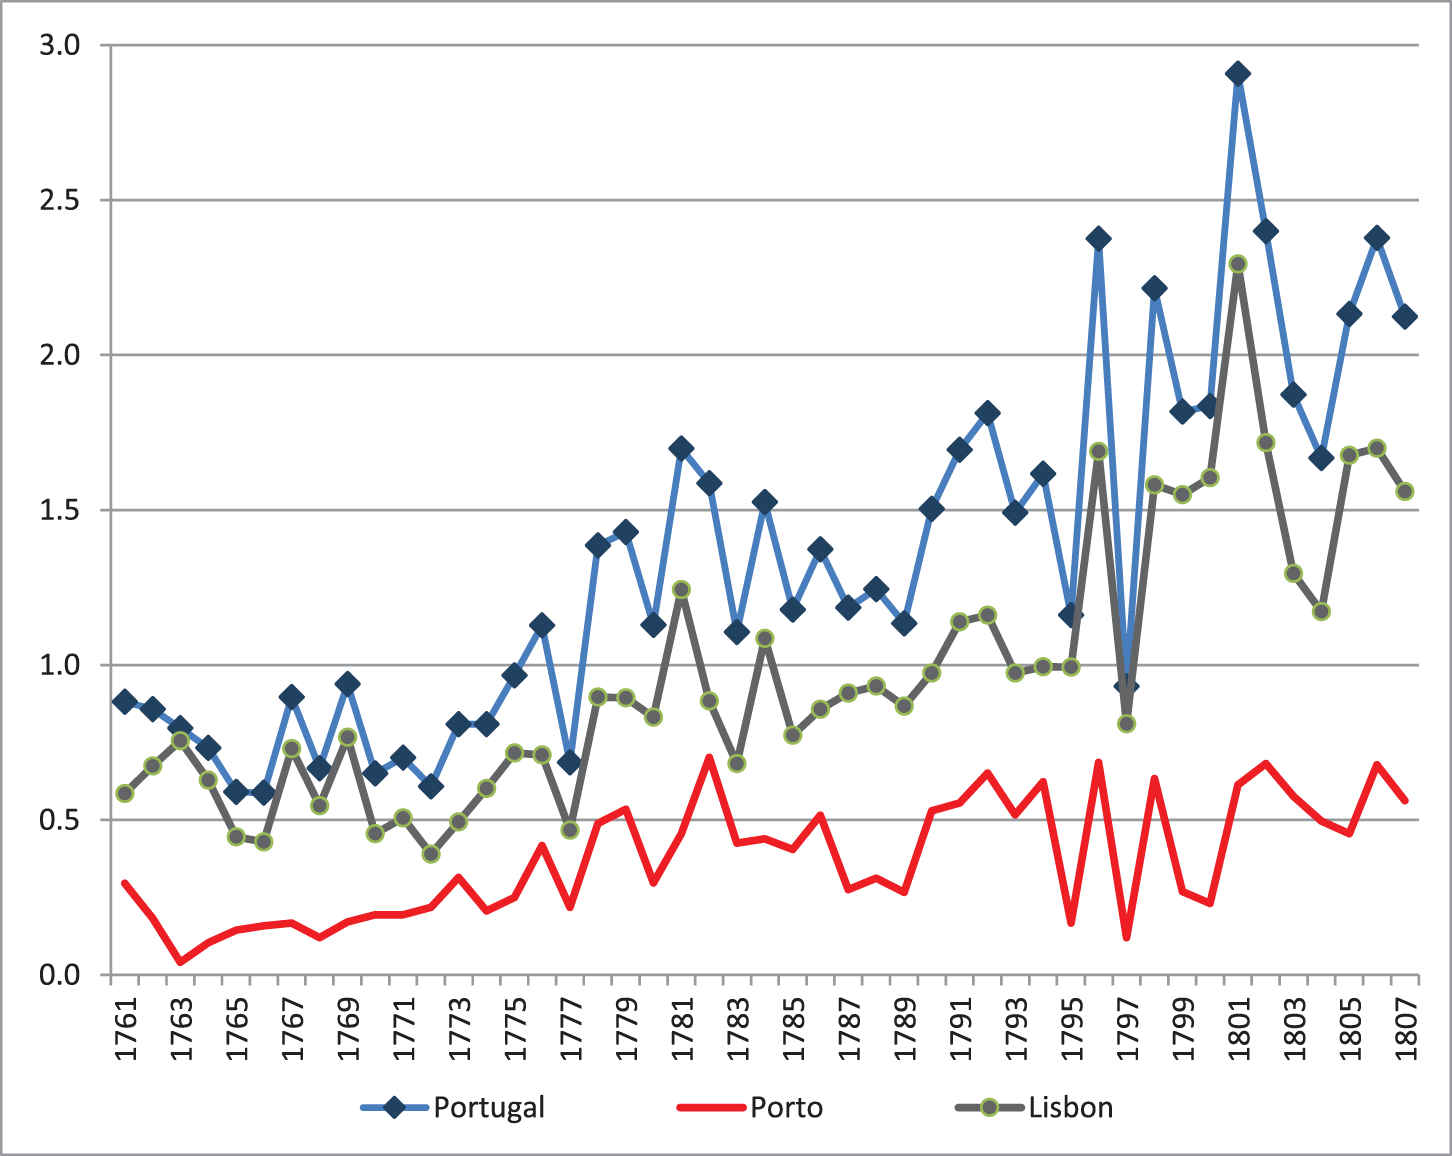
We have complemented the trade balance reports with a continuous series of sugar quantities imported by Portugal between 1761 and 1807, covering the two leading marketplaces: Lisbon and Porto.Footnote 49 In Figure 5, we present the results for both markets (Lisbon and Porto) and the total Portuguese imports. During the first decade under analysis, we observed stability in imports, but the amounts fluctuated significantly between years, especially for Lisbon. The fluctuations in annual Portuguese imports were common throughout the period under analysis and could be attributed to crop alternations, transport restrictions, and stock variations. In the 1770s, the results based on these new reports allowed us to verify a growing imported volume, even before the 1776 balance.
Sugar imported by Portugal (in arrobas, 1761–1807).

Figure 5 Long description
The graph shows sugar imports in Portugal, Porto and Lisbon from 1761 to 1807. The x-axis is labeled with years from 1761 to 1807 and the y-axis represents import quantities ranging from 0.0 to 3.0. The blue line represents Portugal, showing fluctuations with peaks around 1797 and 1801. The red line represents Porto, displaying a gradual increase with some fluctuations. The black line represents Lisbon, showing more consistent fluctuations with peaks around 1791 and 1797. Each line illustrates the import trends for the respective location over the years.
The trend of growth in Portuguese imports occurred from the early 1770s to 1781, reaching a level of 1.5 million arrobas at the end of this subperiod. This result benefited from the difficulties in Caribbean exports due to the American War of Independence. For Porto, growth began in the mid-1760s. In the overall Portuguese context, there was a reduction in the amount from 1781 to 1789. In the next decade, Portuguese imports grew, mainly for Lisbon, reaching the series’ peak in 1801 with almost three million arrobas. In the early nineteenth century, there were significant fluctuations due to European conflicts, but the level remained high, at around two million arrobas. Overall, there was a growing trend in sugar quantities imported by Portugal between 1761 and 1807, reflecting the dynamism of sugar-producing regions in Brazil, as well as the increasing consumption of sugar in Portugal and the rest of Europe. This expansion occurred in two stages, the first between the early 1770s and 1781, and the second between 1789 and 1801.
The share of Porto in the total imports represented just over a quarter in 1765 (27.8%) and in 1770–1771 (28.8%), growing to just over a third in the years 1776 and 1777 (35.1%). However, this share decreased to about a quarter at the end of the period under analysis, covering the years 1796–1807 (24.4%). Thus, the Douro estuary gained significance until the end of the 1770s, but its share in imports was reduced by the end of the period under analysis. The difficulties of re-exportation were greater for Porto than in Lisbon during these years of more intense European conflicts. As we pointed out in the previous section, most of the sugar imported through the Douro estuary from 1796 to 1807 remained in Portugal.
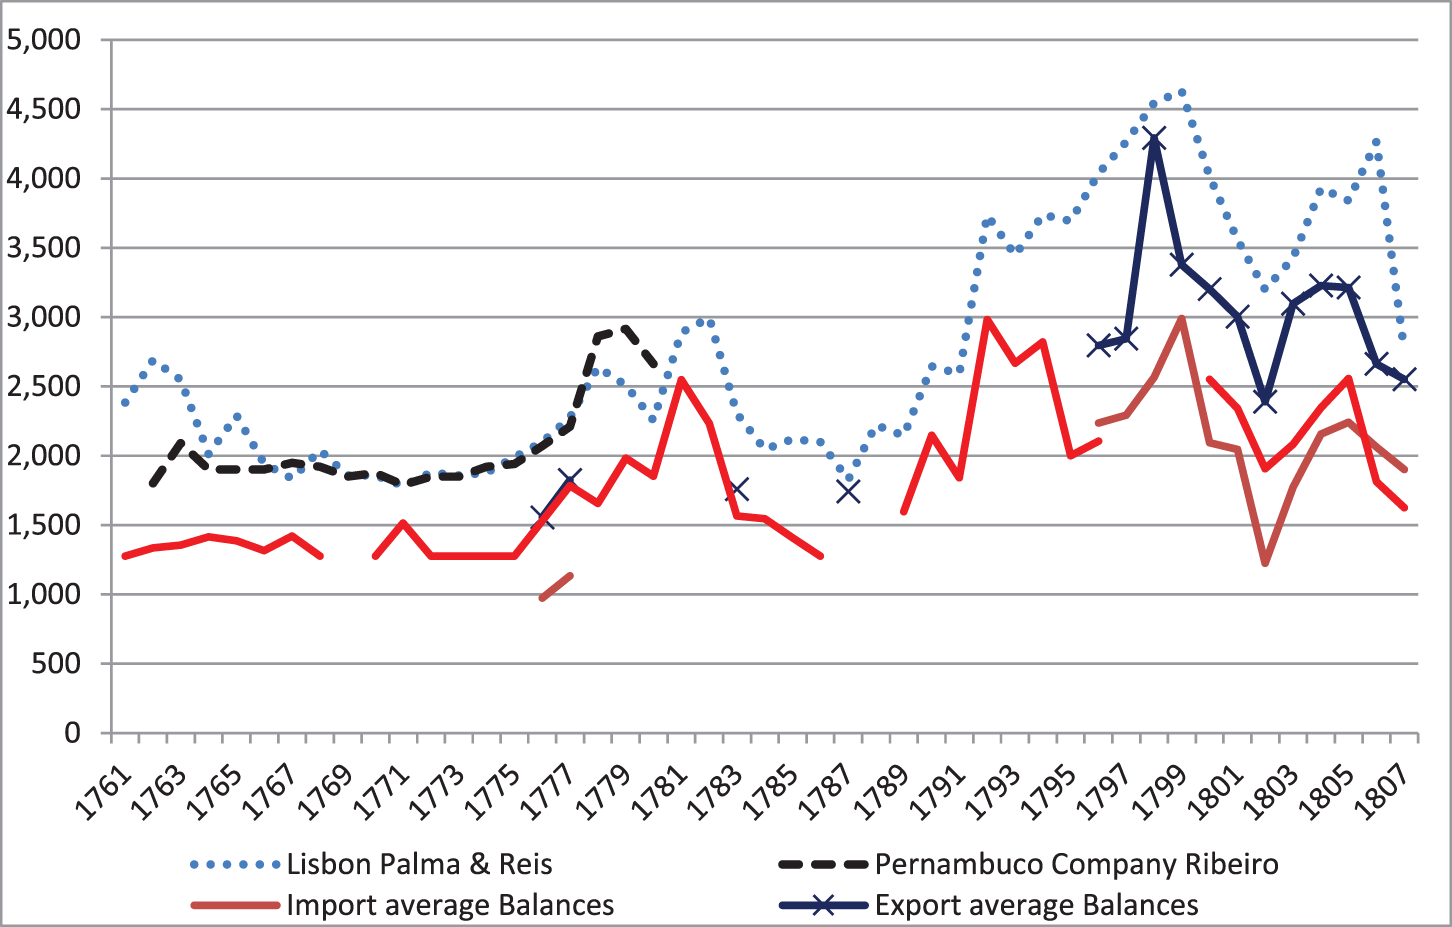
Prices are essential information for computing the values of sugar. In Figure 6, we provide the nominal prices of this commodity from different sources for the period, including the trade balance series (import and export), the one for Salvador by Kátia Mattoso (Reference Mattoso1986, Annexes, pp. 443–460), and those for Lisbon related to the sale of white sugar by the Companhia de Pernambuco e Paraíba by José Ribeiro Júnior (Reference Ribeiro Júnior1976, p. 140), and PWR (Prices, Wages, and Rents in Portugal 1300–1910).Footnote 50 As expected, the prices in Salvador were consistently lower than those in Lisbon, reflecting differences between markets arising from profits, freight costs, taxes, and other expenses. This difference varied significantly, growing at the end of the period. The high sugar prices at the beginning of the series are probably related to the effects of the Seven Years’ War and supply constraints. Subsequently, we observed more evident price growth during the period of the American Revolution and especially after the Haitian Revolution. Growing demand in Europe, slave trade and problems with competitors have made Brazilian sugar more competitive.
Nominal price of sugar per arroba for different authors (in réis, 1761–1807).

Figure 6 Long description
A line graph showing sugar prices from 1761 to 1807. The x-axis represents years from 1761 to 1807 and the y-axis represents prices in unspecified units ranging from 0 to 5,000. Three data series are plotted: Lisbon Palma and Reis (dotted line), Pernambuco Company Ribeiro (dashed line) and import-export average balances (solid lines). The Lisbon Palma and Reis series shows fluctuations with peaks around 1795 and 1803. The Pernambuco Company Ribeiro series has a peak around 1783. The import average balances series shows a gradual increase with fluctuations, while the export average balances series shows significant peaks around 1795 and 1803. The graph illustrates variations in sugar prices over the period, highlighting differences between import and export balances and regional price variations.
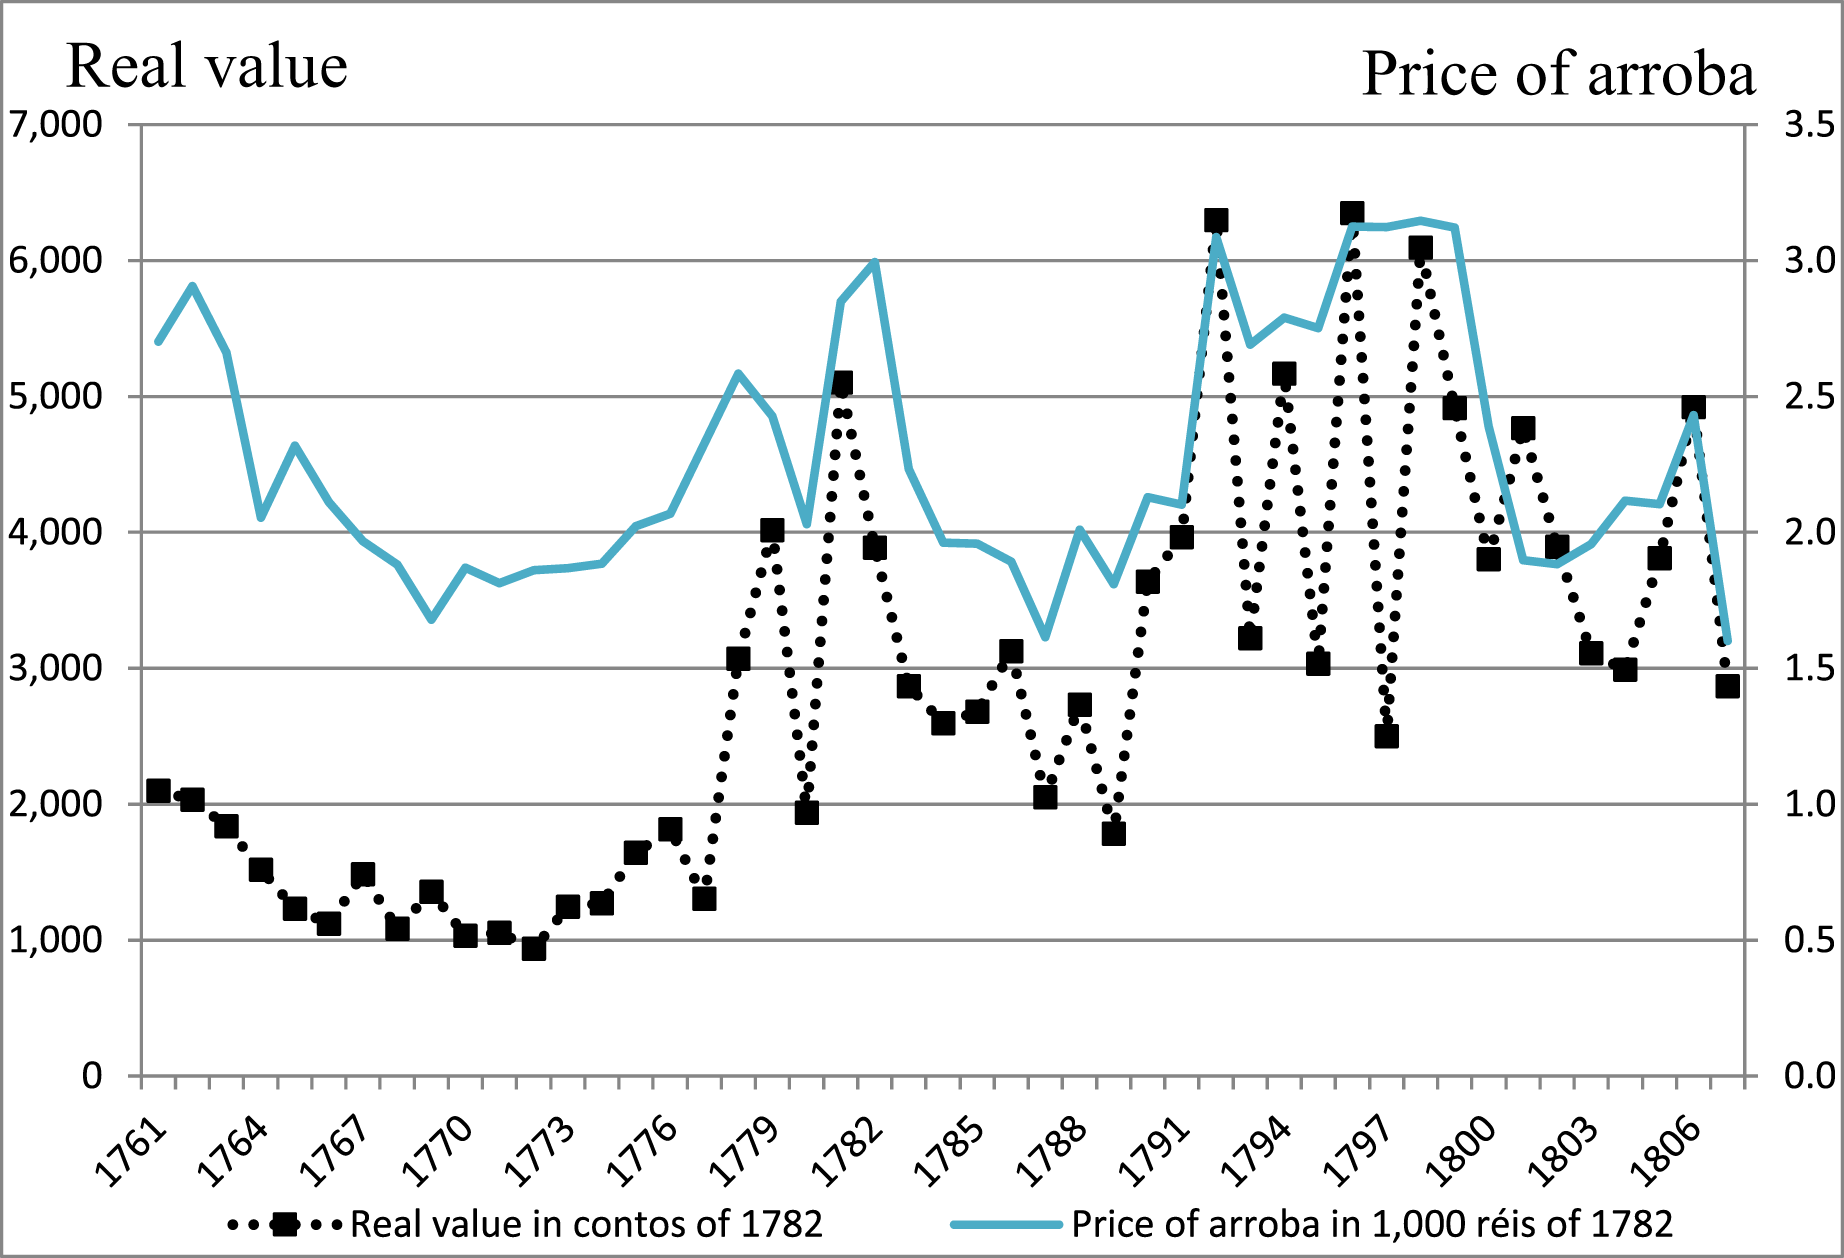
Given the similar trend in nominal prices across different sources, we opted for PWR’s data due to their high correlation with other series and their greater regularity and proximity to sugar consumption in Lisbon, the primary importer of the commodity. In Figure 7, we present the real prices per arrobaFootnote 51 and the real values of Portuguese imports of this product, deflated by the PWR overall price index.Footnote 52 The supply restriction of sugar in the Caribbean in the early 1760s led to higher real prices, which decreased at the end of the Seven Years’ War. Real sugar prices resumed growth in the mid-1770s and continued until the early 1780s, possibly due to the American War of Independence, which also affected the Caribbean’s supply. Later, there was a retraction of real prices until the end of the 1780s. From this point, there was a rapid return to the previous maximum level for almost the entire 1790s, reflecting the impact of the Haitian Revolution. In the early nineteenth century, real sugar prices contracted due to European conflicts that hindered the supply to these regions. Therefore, we did not observe a trend of overall growth in real sugar prices during the period, despite temporary constraints in Caribbean supply leading to increases in quotations and European demand for Brazilian sugar.
Real value and price of Portuguese sugar imports (1761–1807).

Figure 7 Long description
The graph shows the real value in contos of 1782 and the price of arroba in 1,000 réis of 1782 from 1761 to 1807. The x-axis represents the years from 1761 to 1807. The left y-axis shows the real value ranging from 0 to 7,000, while the right y-axis shows the price of arroba ranging from 0 to 3.5. The real value is depicted with a dotted line and square markers, while the price of arroba is shown with a solid line. The real value starts around 2,000, decreases to below 1,000 by 1770 and then fluctuates, peaking above 5,000 in the early 1790s. The price of arroba starts around 2.5, decreases to about 1.0 by 1770 and then fluctuates, peaking above 3.0 in the early 1790s. Both values show significant fluctuations throughout the period.
In Figure 7, we observe the actual sugar import values, which closely match the quantities, as the value is the price multiplied by the amount. There was also a growing trend in growth throughout the entire study period. Despite a contraction in the early 1760s, from the 1770s until 1781, there was a more significant expansion, but it retracted for most of the 1780s. Subsequently, there was a new expansion until the early nineteenth century, when it declined again. Despite real prices fluctuating in certain situations of restrictive supply or demand, the quotations showed stability over the entire period. However, we noticed a growth trend in quantity and, consequently, in the real values of sugar, to which the variation in prices contributed little. In any case, the increasing values of sugar imported by Portugal from Brazil were fundamental to the adjustment of the trade balance.
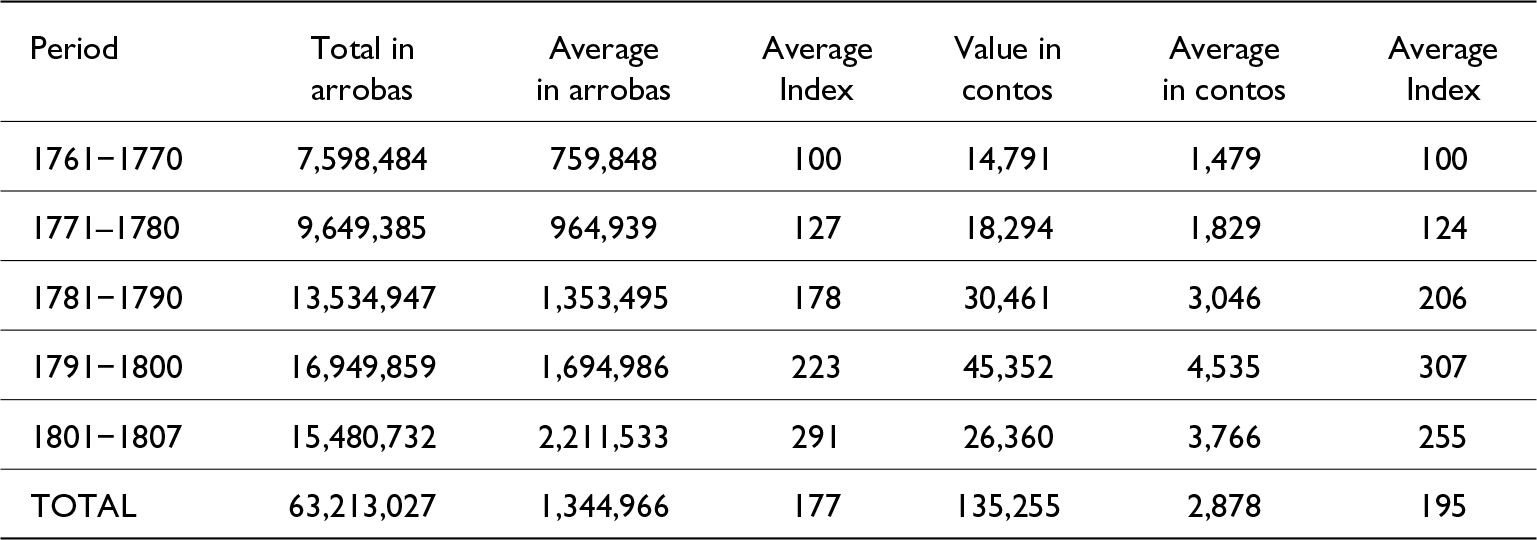
Table 1 provides a summary of our results for quantities and real values per decade. The average amount imported per decade grew continuously throughout the period (index 100 for 1761–1770 and 291 for 1801–1807). For average real values, we noted a more significant increase to quantities until the end of the century (index 100 for 1760–1770 and 307 for 1791–1800), although subject to greater fluctuations. At the beginning of the nineteenth century, there was a decline in the average annual value (index 255 for 1801–1807), despite the growth in quantities. Over the entire period, Portugal imported more than 63 million arrobas of sugar from Brazil.
Imported quantities of sugar and real values per decade (1761–1807)

Table 1 Long description
The table measures sugar import quantities and their real values per decade from 1761 to 1807. Sugar imports rose steadily, peaking at 16.9 million arrobas in 1791-1800, while real values reached their highest at 45,352 contos in the same period. The average index for both quantities and values increased over time, indicating growth in imports and their economic significance. However, in the final period of 1801-1807, both the total quantity and real value decreased, suggesting a potential shift in trade dynamics or economic conditions. The average index for values was consistently lower than that for quantities, highlighting a disparity in growth rates between physical imports and their economic valuation.
Note: Real values in contos de réis of 1782 and Index 1761–1770 = 100.
Brazil utilized its existing productive capacity to respond to market demands in Europe initially. In a second phase, production growth required more hands, mainly enslaved individuals. This expansion relied on more favorable prices for enslaved individuals, the natural reproduction of this contingent, and the increasing entry of labor through the African slave trade, increasingly directed towards agriculture. These prices represented one of the main costs of sugar production, as they were necessary for expanding crops. We used the nominal prices of healthy African enslaved men from Minas Gerais and Bahia as a reference.Footnote 53 The trend was a reduction in prices in the 1750s and 1760s, resulting from lower gold demand and the dynamics of the African supply. Later, these prices stabilized at this lower level until almost the end of the eighteenth century. The costs of captives in Brazil influenced the sugar supply; in other words, when the real prices of enslaved individuals from Minas Gerais were lower, the real value of sugar imported by Portugal increased. The relationship between the African slave trade and the sugar business can also be observed through the imported population of enslaved individuals.Footnote 54 Thus, the expansion of the sugar trade demanded an increased labor supply and benefited from the favorable prices of enslaved individuals in this period.
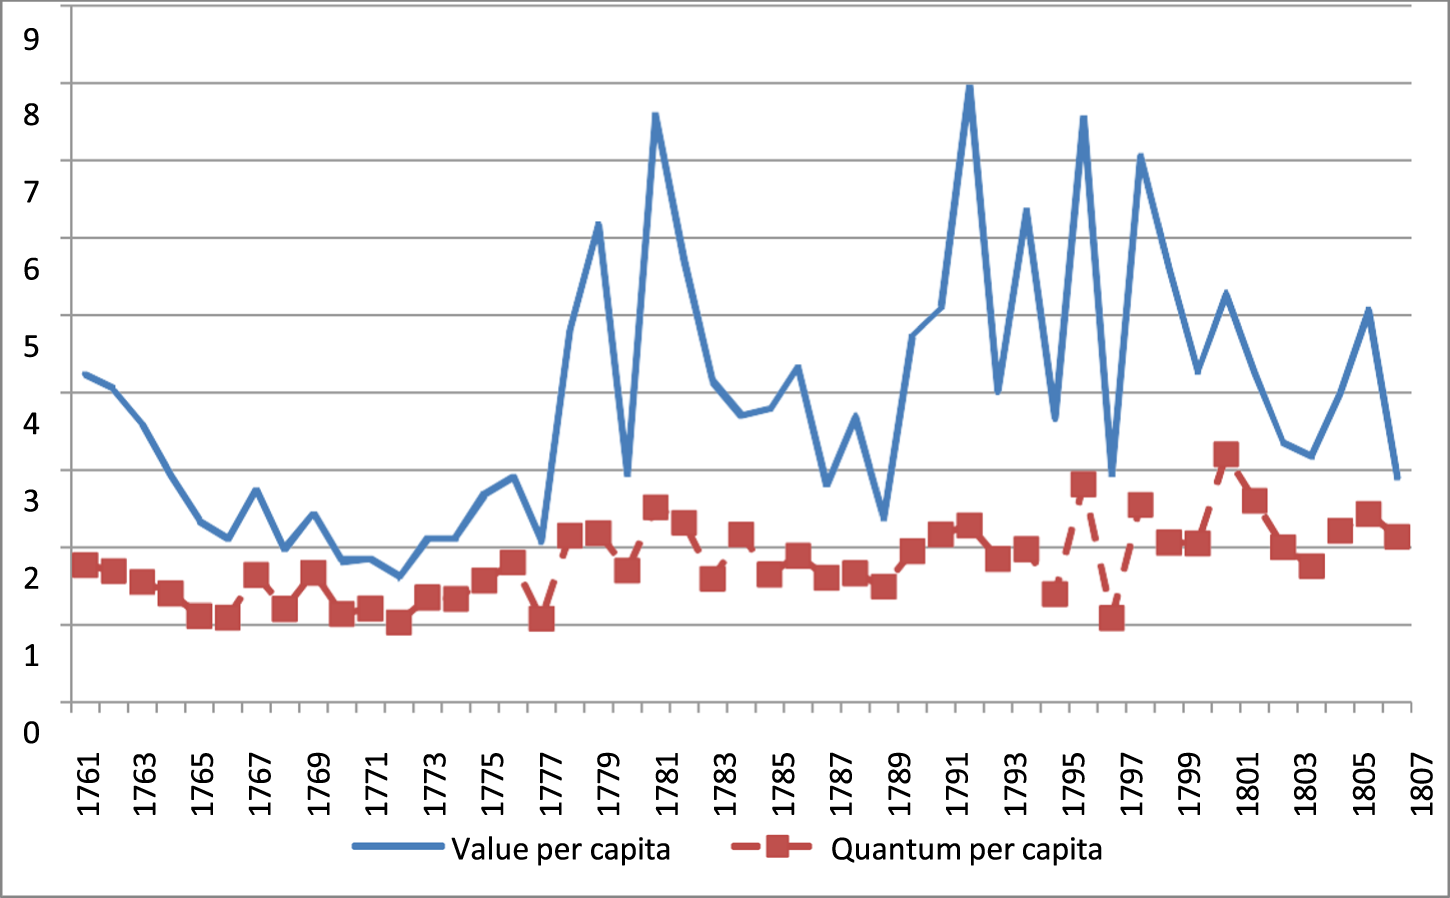
We can compare the expansion of the Brazilian sugar supply in Portugal relative to the population of the main producing regions in Brazil, as shown in Figure 8. We constructed the per capita quantity and the per capita real value.Footnote 55 The per capita quantity and real value of Portuguese sugar imports grew in the last quarter of the eighteenth century. The former exhibited a smooth growth trend throughout the period, particularly in the 1770s and during the transition from the eighteenth to the nineteenth century. On the other hand, the real value fluctuated between two and four thousand réis per capita until the early 1770s. Later, it grew to over four thousand réis and then reached seven thousand in 1782, returning to around three thousand in the following years. Later, there was a resumption of growth in the 1790s, accompanied by significant fluctuations. At the end of the period, the per capita value exceeded five thousand réis in several years at the end of the eighteenth century. This reinforces the growth of sugar-producing regions in the colony during this period, surpassing demographic expansion. However, the early years of the nineteenth century proved to be less favorable.
Quantity and real per capita value of sugar imports in Portugal (1761–1807).

Figure 8 Long description
The graph shows the value per capita and quantum per capita of sugar imports in Portugal from 1761 to 1807. The x-axis represents the years from 1761 to 1807, while the y-axis represents the values ranging from 0 to 9. The blue line represents the value per capita, which starts at around 4 in 1761, decreases to about 2 by 1770 and then fluctuates significantly, peaking at around 8 in 1782 and 1795. The red squares represent the quantum per capita, which remains relatively stable around 2 throughout the period, with minor fluctuations. The graph illustrates the trends and variations in sugar import values and quantities over the years.
Based on Portuguese customs data, we constructed a continuous series of quantities and real sugar import values that allowed us to verify a colonial economic expansion after the 1760s. This growth of sugar commerce led to an increase in customs, exchange, and re-export revenues, mainly for Lisbon.Footnote 56 It was not enough to reverse the stagnation of the Portuguese economy, but it did contribute to the adjustment of the trade balance and increase tax revenue. This result remained even when we considered the population of the producing region, indicating per capita growth. Finally, the real values of traded sugar in Portugal demonstrated the Brazilian agricultural renaissance through a growing trend, which occurred earlier than indicated in the literature.
6. Conclusions
Customs sources constitute a valuable record of Portuguese foreign trade, complementing the information already available in the historiography. We constructed a new series for quantities of imported sugar for Portugal (1761–1807). The new series in arrobas has extended the analysis period for each of the two main Portuguese ports—Lisbon and Porto—to include quality and origin in Brazil.
Based on trade balances from 1776 to 1807, Brazilian sugar landed in Portugal was primarily destined for Hamburg and Italian cities, which redistributed it to other European regions. The variation in stocks, primarily Portuguese consumption, represented a significant portion of imports from Brazil. Conflicts in America and Europe and the Revolution in Haiti produced substantial changes in the sugar market (prices and Caribbean supply). Despite the producers’ problems, Europe consumed more sugar throughout the period studied, and Brazil supplied more and more of the product.
Through customs sources and trade balances, we observed that sugar arrived from the three main Brazilian captaincies from 1765 to 1807. Despite the volatility, the growth rates of imports were distinct between regions during this period. There was a more significant increase in the participation of the captaincy of Rio de Janeiro, favored by capital accumulation during the mining period and the slave trade. The primary type of imported sugar was white, mostly originating from Pernambuco. In contrast, Pernambuco exhibited less dynamism in sugar shipments, possibly influenced by its expanding cotton exports at the end of the eighteenth century. Bahia maintained leadership in the Brazilian supply for most of the period in question, although with smaller shares of white sugar.
We have established a new series that provides the quantities of Brazilian sugar imported by Portugal between 1761 and 1807, based on trade balances and, predominantly, Portuguese customs sources. The results indicated stability in Portugal’s imports during the first decade under analysis, followed by a growth trend from the early 1770s until the end of the eighteenth century. However, there was a retraction during the 1780s. Later, there was a decrease in quantities in the early nineteenth century. In the case of Porto, the growth trend began earlier than in Lisbon, already in the 1760s, but showed stability with oscillations from the 1780s onward. Overall, the expansion in the quantities of imported sugar from 1761 to 1807 resulted from problems faced by competitors, growing European demand, and favorable conditions in Brazil, including slave prices, accumulated capital, the previous productive structure, the expansion of new lands, and Pombaline policies.
In terms of imported values, we observed a trend of growth, accompanied by more intense fluctuations than those for quantities. The Brazilian sugar expansion boosted trade, customs, and exchange revenues, as well as consumption in Portugal and re-exports to Europe. We demonstrate the revival of the sugarcane economy in Brazil since the 1770s through the increase in quantities and values imported by Portugal. This, sugar contributed to the adjustment of the Portuguese trade balance.
Acknowledgements
We would like to thank FAPESP for supporting the research (Process 2021/01389-5), the Torre do Tombo staff and the scholarship holders Camilla Russo Baptista e Karine Barbosa da Silva. The author acknowledges the comments received of Herbert Klein, Francisco Vidal Luna, Luiz Fernando Saraiva, Carlos Gabriel Guimarães, Rita Almico and journal referees.
Appendice
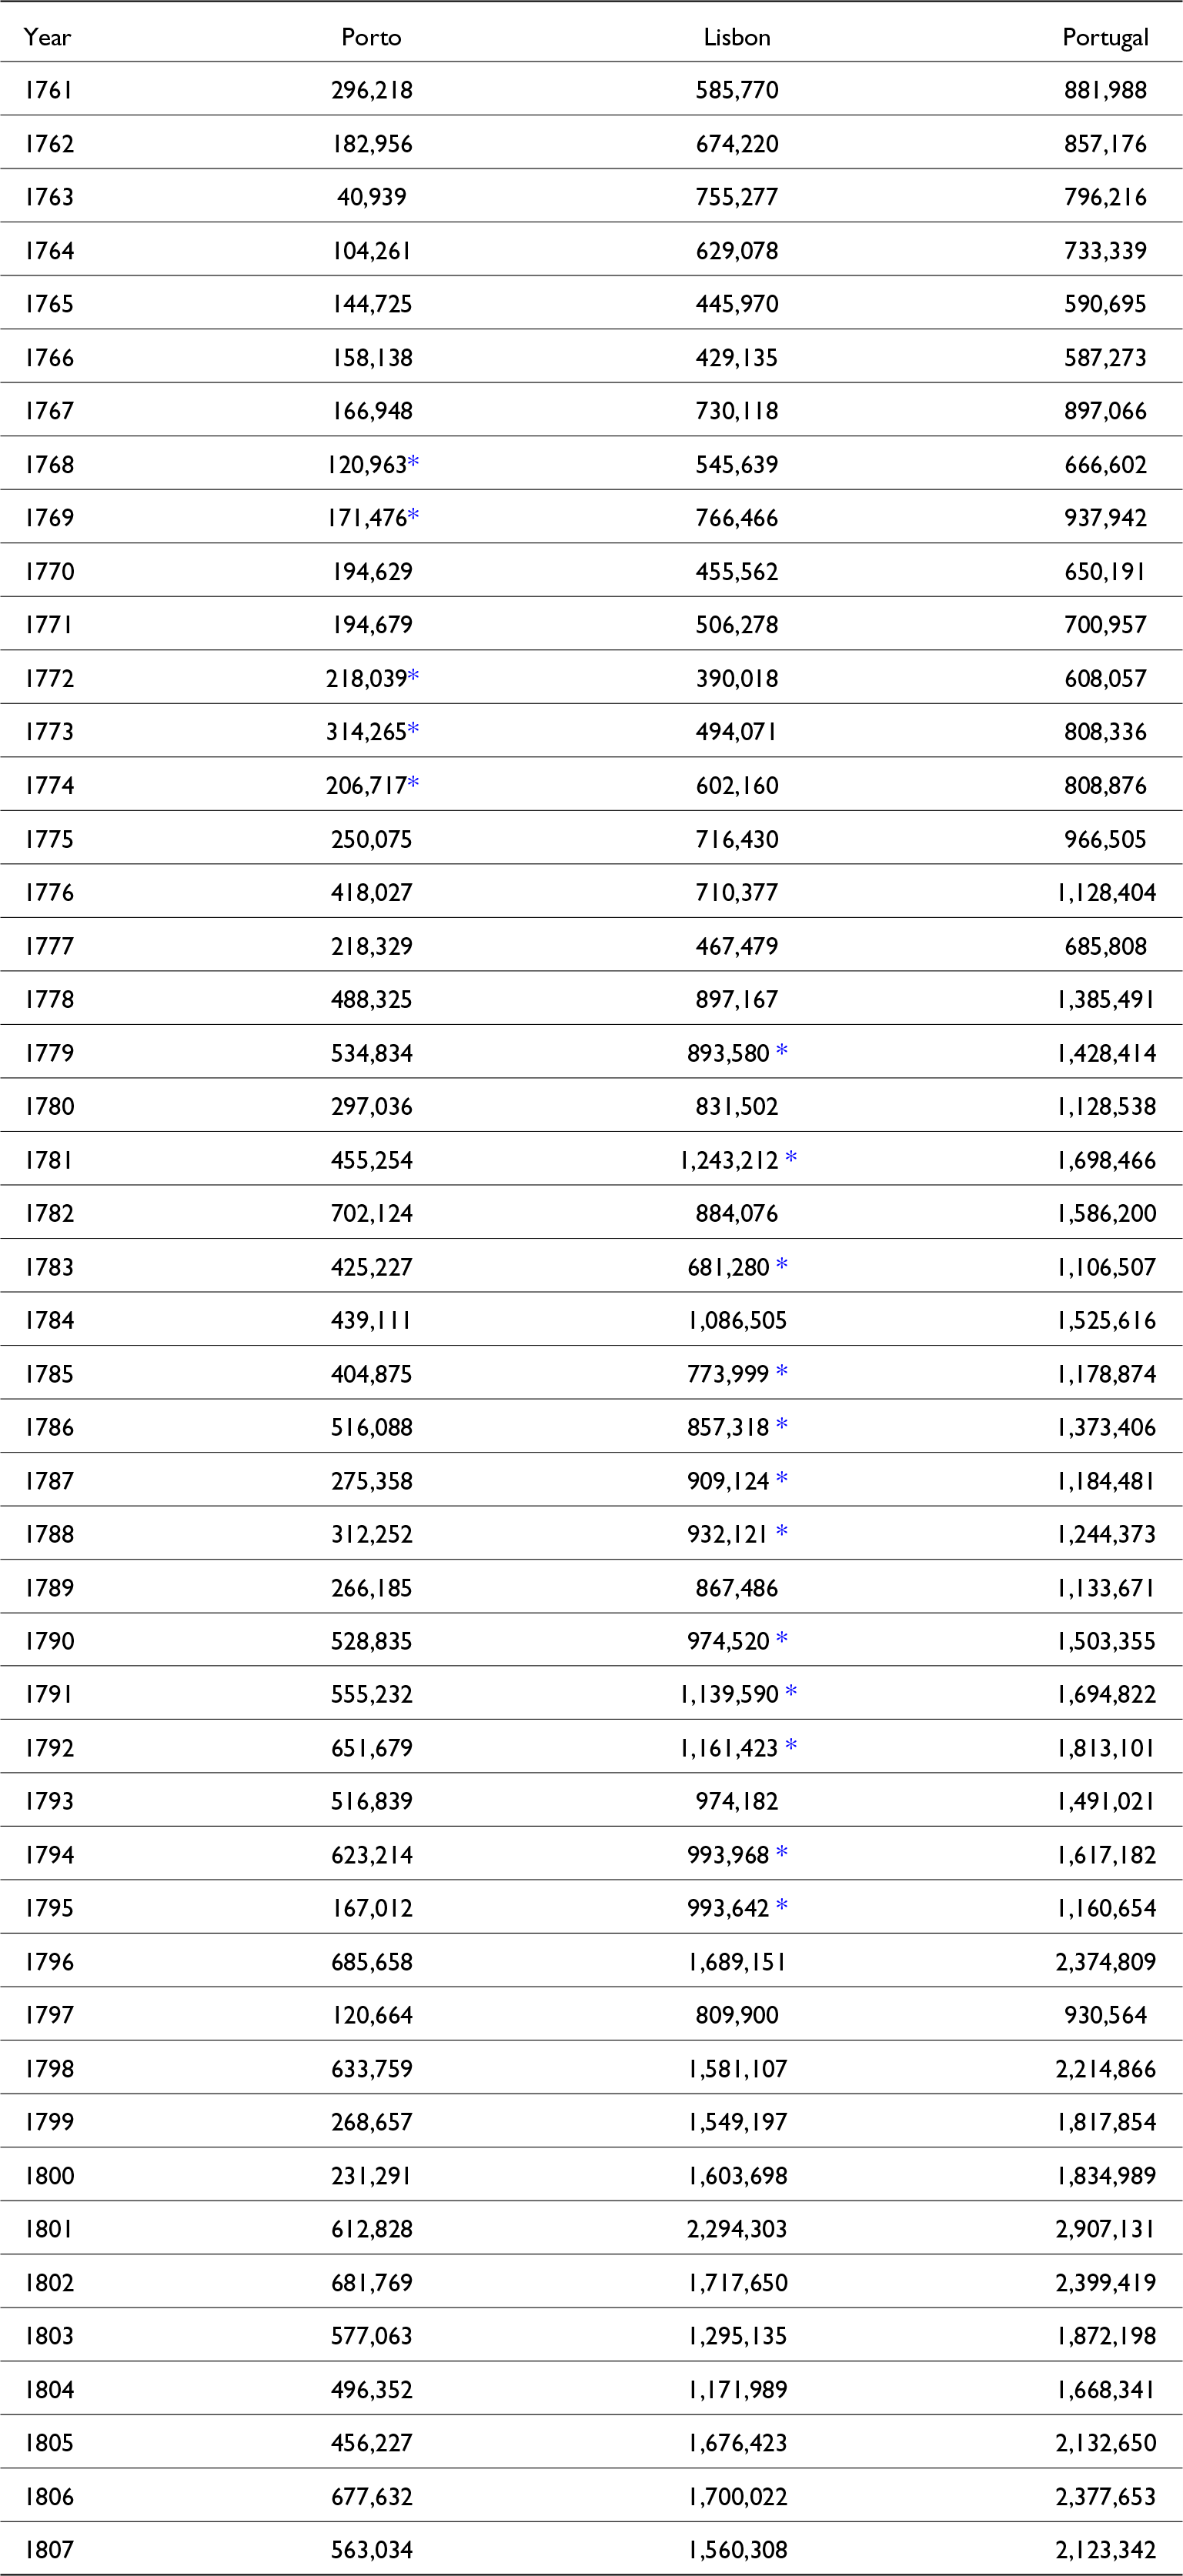
Quantum of sugar imported by Porto, Lisbon e Portugal

* Estimative. Quantum in arrobas.
Sources: Porto (1761–1765 Alfândega do Porto. Receita do Donativo do 4%. PT/TT/ER/A-H-F/001 and 1766–1995 Marcondes and Oliveira, Reference Marcondes and Oliveira2022, p. 139) and Lisbon (1761, 1765, 1778, 1780, 1782, 1784, 1789, and 1793 Alfândega de Lisboa. Receita do Açúcar. PT/TT/ER/A-A-C/009 and 1762–1764 and 1766–1775 Receita do Donativo do 4%, PT/TT/ER/A-A-C/014) and Porto and Lisbon (1776–1777 e 1796–1807 AHMOP. Balanças de Comércio, PT/AHMOP/SGC/05/01 to 06).