


INTRODUCTION
Figure 1 shows that warm air is cooled when it moves over a melting snow surface. Since most of the advected heat is extracted from the lower layers of air into the snow surface, the temperature difference between the snow surface and the overlying air layer becomes smaller, so that the heat exchange between the air and the snow surface decreases in the downwind direction. Therefore, the rate of snowmelt decreases in the downwind direction. This process is considered to play an important role in the process of climatic change with relation to the expansion or shrinkage of a snow-covered area and the growth of an ice sheet. Some field studies have been made on the meso-scale air modification. Treidl (1970) has treated the turbulent exchange over melting snow through two-dimensional boundary-layer analyses. Andreas and others (1984) studied the modification of the atmospheric boundary layer when warm air blows over the antarctic marginal ice zone. But since few observations of air modification over a small snow-covered area have been conducted, detailed measurements of temperature, humidity and wind were carried out in order to clarify the mechanism of modification, as will be discussed in this report.

OBSERVATIONS
The observations were carried out near Arai City (37˚ 03’N, 138˚ 15?, 35 m) in the Hokuriku District, Central Japan, between 1 and 23 April 1981. An observational site was established at a small snow patch surrounded by a grass-covered area, measuring 70 m long along the prevailing wind directions (SSW and NNE), and 30m wide. The surface inclination was less than 1:100, and the character of the grass-covered area was nearly uniform and less undulating over a distance of 300 m in the SSW and NNE directions. To observe downwind variation in temperature, humidity and wind speed, two masts were set up along the prevailing wind directions; one was on the grass-covered ground near the SSW side of the snow patch, and the other at a fetch (distance downwind) of 48 m from the upwind edge. At either site, profiles of dry- and wet-bulb temperatures and wind speed were obtained at 4 levels up to 3.1 m, and surface temperatures were measured on the grass and snow surfaces using ventilated and shielded platinum resistance thermometers, accurate to 0.1 °C, Photo-electric cup-type anemometers were used for wind speed. In certain cases additional measurements of dry- and wet-bulb temperatures were made near the snow surface at fetches of 2, 8 and 20 m. In the centre of the snow patch net radiation was measured with a net radiometer. Output from these sensors was automatically recorded and averaged over 10 minutes periods. Snowmelt was measured at 16 points on the snow patch. Data analyses on air modification were made for the cases with the following conditions: snowmelt, the wind from SSW, and the upwind air nearly in thermal equilibrium with the underlying surface.
MODIFICATION OF AIR MOVING OVER MELTING SNOW SURFACE
Downwind variation of air température
Figure 2 shows typical profiles of air temperature over the upwind grass-covered ground and at 48 m fetch on the snow patch. Air temperature decreased over the snow surface, with the greatest changes nearest to the surface; temperature decreases at 0.1 m and 0.5 m level were 6.0 °C and 2.3 °C respectively over the fetch of 48 m. Modification of air seems to occur in the air layer up to approximately 3 m at 48 m fetch.

A typical example of downwind variation in temperature at 0.1 m and 0.6 m level is shown in Figure 3. It is clearly seen that the temperature changes rapidly within a few metres near the leading edge, but relatively gradually over the subsequent fetch. It should be noted that atmospheric conditions change from unstable to stable quite near the leading edge within 0.6 m level. It was found that such modification of air depends on the surface temperature difference between the grass-covered ground and the snow patch. When the temperature of the upwind air was between 10°C and 20°C, with nearly neutral stratification, the temperature drop was 4 to 9°C at 0.1 m level and 2 to 4°C at 0.5 m level over the fetch of 48 m.

Other factors related to the air modification are upwind stratification and the change of surface roughness (on average 6.1 mm for the grass-covered ground and 2.3 mm for the snow). Taylor (1971) pointed out that upwind unstable conditions would enhance extensive growth of the internal boundary layer by virtue of the increase in turbulent mixing, though such an effect was not completely detected by the present observations. As for the effect of roughness change, measurements were not sufficiently systematic and detailed to go into the matter fully. However, its effect would be less important over longer fetches, since the roughness change was small, and the resultant wind acceleration was also insignificant in this study.
Downwind variation of specific humidity
Figure 3 also shows a typical example of the downwind variation of specific humidity calculated from dry- and wet-bulb temperatures. Specific humidity decreased rapidly near the leading edge, and gradually further downwind. When air temperature was 10 to 20 °C and relative humidity ranged from 50 to 80% above the upwind grass-covered ground, the decrease of specific humidity at 0.1 m level was 0.5 to 3 x 10³ kg kg1 over the fetch of 48 m. Such a decrease of specific humidity can be considered a result of condensation of water vapour at the snow surface.
HEAT EXCHANGE AT SNOW SURFACE
Calculation was made on the downwind variation of turbulent fluxes of sensible and latent heat at the snow surface. Sensible heat flux H and latent heat flux E at the snow surface can be derived from the following equations:


where ρ is the density of air, cp the specific heat of air at constant pressure, k von Karman’s constant {0.4), u* the friction velocity, T the air temperature, q the specific humidity, z the height above the snow surface, and L iv the latent heat of condensation of water. Suffixes’ “a” and “0” denote the heights where measurements of T and q were made. Fluxes toward the surface will be defined as positive. Here z0 was taken as the roughness height. The value of z0 can be evaluated after logarithmic regression from the wind speed profile. The factors фE and фE, are functions of stability and related to the Obukhov length L as follows for stable stratification (Webb 1970):
фH - фE

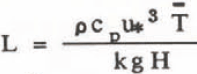
where T is the temperature representative of the air layer and g is the gravitational acceleration. According to fetch criteria established by Bradley (1968), H and E were calculated for fetches of more than 8 m using vertical temperature and humidity gradients nearest to the surface (within 0.1 m), assuming that the fluxes reached the equilibrium values there.
Figure 4 shows calculated downwind variation in sensible and latent heat fluxes, corresponding to the case shown in Figure 3. Here net radiation (R) was taken to be constant over the snow patch, assuming that the albedo of snow was constant (0.55) over the snow patch. As seen in Figure 4, both the sensible and latent heat fluxes at the surface decreased by about 30% over the range of fetch S to 48 m. The tendency of decrease is similar to that of air temperature and specific humidity, but these fluxes should be quite large near the leading edge due to the discontinuity in surface conditions. Such observational results are in good agreement with the numerical experiments by Weisman (1977). In this study the total heat flux, which is the sum of the turbulent heat fluxes and the net radiation, is the most important, since it is directly related to snowmelt. As shown in Figure 4, it decreased by about 25% over the range of fetch 8 to 48 m. Since the net radiation was 350 W m-2 at most in the daytime, and not so large in comparison with the turbulent heat fluxes during the observation period, the downwind variation of turbulent heat fluxes is expected to exert a direct effect in reduction of snowmelt, as will be described in the next section.

SPATIAL VARIATION OF SNOWMELT
Figure 5 shows the spatial variation of average snowmelt for four days (14 to 18 April 1981). As expected from the downwind variation of the total heat flux, snowmelt is smaller in the centre of the snow patch than near the edge. For comparison, let MA denote the average value of snowmelt at the four points (open circles) near the corner and MD that at three points (crosses) in the centre of the snow patch. The ratio of MB to MA was 0.63, 0.79, 0.73 and 0.S2 for each day, the average being 0.75. In the directions of the prevailing winds (SSW and NNE), the distance downwind from the edge to the centre of the snow patch is about 40 m. As described in the previous section, the total heat flux toward the snow surface decreased by 25% over the range of fetch 8 to 48 m. So this value indicates a reasonable correspondence to the decrease of snowmelt in the centre of the snow patch as shown by the ratio of MB to MA of 0.75. We conclude that such a decrease of snowmelt is the result of decrease in turbulent heat fluxes due to air modification.



