I. INTRODUCTION
Metal matrix composites (MMCs) reinforced with carbide ceramic particulates exhibit high hardness, low coefficient of thermal expansion, high wear-resistance, and corrosion-resistant properties, which are widely used in the metal machining and the mold production. Reference Upadhyaya1 From both technological and economic points of view, the fabrication of carbides reinforced coating on the mechanical parts surface is considered as one of the most efficient approaches. Reference Yuan and Li2 Tungsten carbide (WC) as one of the most widely reinforcing phases among carbides has been used in composite coatings for some of its unique properties, such as a certain amount of plasticity and good wettability with molten metals. Reference Lou, Hellman, Luhulima, Liimatainen and Lindroos3 In addition, cobalt (Co), nickel (Ni), and iron (Fe) are often used as the traditional binder for MMCs, which play an important role in the dissipation of strain energy, and accordingly result in excellent toughness of MMCs. Reference Gu and Meiners4
Some typical preparation methods of MMCs mainly include laser surfacing alloy, Reference Sun, Zhang, Liu, Luo, Tao and Li5 laser cladding, Reference Wang, Wang, Chang and Wang6–Reference Zhang and Zhang8 high-velocity oxygen-fuel (HVOF) sprayed, Reference Hong, Wu, Li, Wang, Gao and Ying9,Reference Bolelli, Berger, Bonetti and Lusvarghi10 plasma spray, Reference Zavareh, Sarhan, Razak and Basirun11,Reference Forghani, Ghazali, Muchtar, Daud, Yusoff and Azhari12 PTA welding, Reference Yuan and Li2,Reference Veinthal, Sergejev, Zikin, Tarbe and Hornung13 etc. Compared with these methods, laser cladding technology can control the heat input, produce the small and thin layer of melt pool, and finally conduct the heat quickly to the bulk substrate. This method is a typically rapid solidification process with a superfast cooling rate of 106−7 K/s. Reference Gu, Jia and Bandyopadhyay14 Therefore, laser cladding technology can fabricate high-performance coatings with lower porosity, fully dense structure, minimal heat damage to the substrate, and metallurgical bond with the substrate. Reference Yang, Liu, Fan, He, Shi, Fu, Wang and Chen7
Recently, the in situ synthesized MMCs by laser cladding have aroused interest of many researchers. Reference Gu, Jia and Bandyopadhyay14 Firstly, the prepared coatings possess the high thermal stability because the reinforcements are thermodynamically stable in the matrix. Secondly, the reinforcements and metal matrix interface are cleanliness. Last but not least, the in situ synthesized reinforcements can homogeneously distribute in the coatings. M.M. Savalani et al. investigated in situ synthesized TiC reinforced Ti matrix composite layers on a pure titanium substrate. Reference Savalani, Ng, Li and Man15 Results showed that the coatings were free of cracks and porosities, and excellent metallurgical bonding formed between the cladding coating and the substrate. M. Li et al. fabricated TiN and TiB particles reinforced coating on Ti–3Al–2V alloy by laser cladding with a Ti/h–BN powder mixture. The in situ synthesized TiN and TiB showed dendrite and needle platelet type microstructures in the clad layers and the microhardness of laser clad layer was about 5 times of the substrate.
In this paper, in view of the morphology, WC particle plays an important role in the property of the prepared coating. A detailed understanding of growth mechanism and the shape evolution of the in situ carbides is necessary. We investigate the growth mechanisms and the evolution rule of WC particle according to Gibbs–Wulff theory and Bravais–Friedel–Donnay–Harker (BFDH) law. The result provides a potential possibility of preparing the size-controlled and shape-controlled carbides by laser cladding. Moreover, the forming quality, reinforcement particles size, volume fraction, and the distribution of the carbide particle also have important impacts on the mechanical properties of the laser cladded coating. Reference Jin, Shen, Lin, Zhan and Jiang16,Reference Li, Lei and Fu17 Consequently, the relationship between the mass ratio of the raw powders and the relative volume fraction, mean size, and maximum size of WC particle has been estimated, also the phase constituents, microstructure, and microhardness are investigated.
II. MATERIALS AND METHODS
The graphite powder and the tungsten powder were blended to constitute a molar ratio of 1:1, which subsequently mixed with nickel powder in terms of 3:7, 1:1, and 7:3 mass ratios. Before cladding, three powders were homogeneously blended using a QM-3SP2 mill (Nanjing University Instrument Plan, Nanjing, China) at a rotation velocity of 300 rpm for 40 min. A mild steel plate was used as the substrate with dimensions of 100 × 60 × 20 mm, whose nominal composition is listed in Table I. Some parallel rectangular slots were machined with the size of 60 mm length and 1.5 mm depth on the substrate, following polishing and rinsing with acetone to achieve a clean surface. Taking 0.5 g W–C–Ni powder mixture deposited on these slots and flattened with a flat plate.
Chemical compositions of substrate (mass, wt%).

A 3.5 kW high power diode laser (Rofin DL-035Q, Laser Gesellschaft mit beschrankter Haftung, Hamburg, Germany) was used to product a single cladding track. The laser power and scanning speed were optimized to set as 1.2 kW and 1 mm/s, respectively. High-purity argon with a flow rate of 15 L/min was used as the shielding gas to protect the molten pool from oxidation during the process. Transverse sections of coatings were etched with the aqua regia (a solution of
 ${V_{{\rm{HCl}}}}{\rm{:}}{V_{{\rm{HN}}{{\rm{O}}_3}}} = 3{\rm{:}}1$
) solution for the microscopy characterization. Deep-corrosion samples were prepared by keeping samples in the aqua regia solution for two days.
The phase identification of the coatings was carried out by x-ray diffraction (DX-2700, Dandong Hao Yuan Instrument Co. Ltd., Dandong, China) with the Cu Kα radiation at 40 kV, 300 mA. The microstructure characterization of coatings was performed with a field-emission scanning electron microscope (SEM). Microhardness test along the depth direction was measured on a HVS-10 Vickers tester (Shanghai Shangcai Tester Co. Ltd., Shanghai, China) under a load of 2 kg for 15 s.
III. RESULTS
A. Phase identification and quantitative estimation
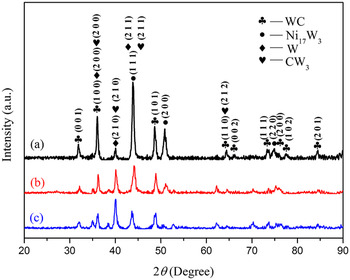
X-ray diffraction (XRD) analysis is performed to detect the phases in the cladded coatings and the results are shown in Fig. 1. It should be noted that all the coatings show the same XRD pattern of phase constituents, besides the varying of the peak intensity of each phase. As shown, the XRD patterns reveal the presence of the characteristic peaks of the WC phase, Ni17W3 phase, W phase, and CW3 phase. The presence of W phase is a clear indication that tungsten powder does not completely dissolved in Ni–W–C system during laser cladding, which is also observed by Dongdong Gu. Reference Gu and Meiners4 Here, WC and CW3 are considered as reinforcements for their higher hardness, with Ni17W3 and W as binders.
XRD spectra of laser cladded the W–C–Ni powder mixture using different mass ratios: (a) 30% (W + C) + 70% Ni; (b) 50% (W + C) + 50% Ni; (c) 70% (W + C) + 30% Ni.

According to Ref. Reference De, Murdock, Mataya, Speer and Matlock18, XRD results can reveal the total integrated intensity of all diffraction peaks of each phase, which is proportional to the volume fraction of that phase in a mixture. Then,
 $$I_i^{hkl} = {{KR_i^{hkl}{V_i}} \mathord{\left/ {\vphantom {{KR_i^{hkl}{V_i}} {2\mu }}} \right. \kern-\nulldelimiterspace} {2\mu }}\quad ,$$
where
 $$K = \left( {{{{I_0}A{\lambda ^3}} \over {32\pi r}}} \right)\left[ {\left( {{{{\mu _0}} \over {4\pi }}} \right){{{e^4}} \over {{m^2}}}} \right]\quad ,$$
 $${R_{hkl}} = \left( {{1 \over {{v^2}}}} \right)\left[ {{{\left| F \right|}^2}p\left( {{{1 + {{\cos }^2}2\theta } \over {{{\sin }^2}\theta \cos \theta }}} \right)} \right]\left( {{e^{ - 2M}}} \right)\quad .$$
Here,
 $I_i^{hkl}$
is the integrated intensity for (hkl) plane of i phase. K is the instrument factor and
 $R_i^{hkl}$
is the material scattering. V
i
is the volume fraction of phase i. μ is the linear absorption coefficient. I
0 is the intensity of the incident beam. A and λ are the cross-sectional area and wave length of incident x-ray beam, respectively. r is the radius of diffractometer circle.
 ${{\rm{e}}^{ - 2M}}$
is the temperature factor. v is the volume of unit cell. F is the structure factor for reflecting plane. p is the multiplicity factor.
Combined Eqs. (1)–(3) with ICDD data (list in Table II) and constants indexed in Ref. Reference Zhou and Wu19, the relative volume ratio of WC, Ni17W3, W, and CW3 phases can be estimated.
The Bravais lattice, space group, and international center for diffraction data of phases.
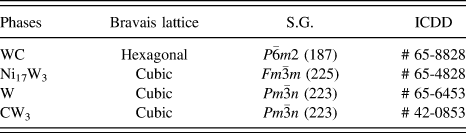
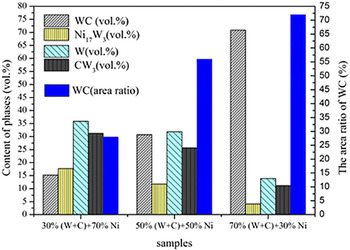
Figure 2 shows the relationship between the volume fraction of WC, Ni17W3, W, and CW3 phases and the mass ratio of (W + C):Ni in the coatings. It can be seen that the volume fractions of WC in situ synthesized are 15, 31, and 71%, respectively, which exhibit a gradual growth trend with the increasing of the mass ratio of (W + C) raw powders. However, the volume fractions of Ni17W3, W, and CW3 phases show an opposite tendency compared with that of WC phase. The area of the in situ synthesized WC particle also has been calculated by quantitatively analyzing SEM images (Fig. 3) by using ImageJ software. As shown in Fig. 2, the areas ratio of WC synthesized are 28, 56, and 72%, respectively. Obviously, the area curve variation tendency of the in situ synthesized WC is in accord with the volume fraction.
The volume fraction variations of phases and the area ratio of WC particles with three different mass ratios.

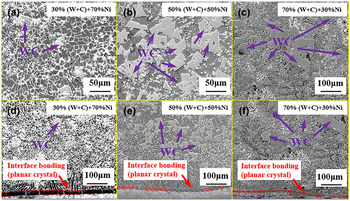
Low-magnification SEM images on the polished cross sections of three samples: (a, b, and c) are the top of the coating and (d, e, and f) are the interface bonding.

B. Microstructures and compositions
Figure 3 illustrates the transverse cross section morphology of laser cladded C–W–Ni powders, with a very small dilution from the substrate. Also, no pores and cracks were observed in the coatings, because the major ingredient Ni is a well-known austenite stabilizer, which can alleviate thermal stress, therefore effectively restrain the generation of cracks. The microstructure of the upper region is shown in Figs. 3(a)–3(c). These blocky particles are further confirmed to be WC, which is explained in detail below. The characteristic of homogeneous distribution is mainly attributed to the in situ synthesized technology. Since graphite, tungsten, and nickel powders homogeneously mix by ball-milling before cladding, a great number of WC nucleation sites also homogeneously distributed in the molten pool during solidification process. The interface near the coating-substrate is shown in Figs. 3(d)–3(f). There is a planar crystal with a thickness of ∼10 µm at the interface and some relatively coarse columnar dendrites on the side of the coating.
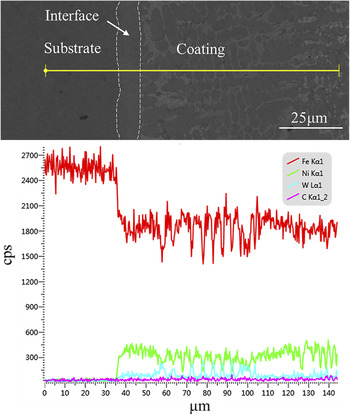
Figure 4 presents the result of line scanning at the interface. The elements curves of iron, carbon, tungsten, and nickel occur smoothly across the zone at the side of coating, while they vary abruptly at the interface. The Fe elements observed in the coating indicates a diffusion layer generated between the coating and the substrate. It can be inferred that the composites of laser cladding layer gradually transit at the interface, indicating a metallurgical bonding produced between coating and substrate.
Variations of elements existing at the interface.

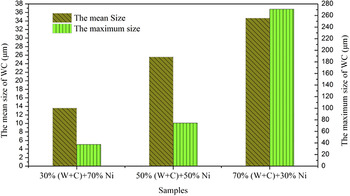
The mean size and maximum size of triangle and quadrangle shape carbide WC in the composite coatings are evaluated by analyzing SEM images using ImageJ software. The mean size and the maximum size are 14, 26, 35 µm and 37, 74, 271 µm according to the order of the increasing (W + C) raw powders (Fig. 5). On the one hand, the number of WC crystal nucleuses increases with the increasing mass ratio of (W + C) powder during the solidification, resulting in an increasing content of the synthesized WC (Fig. 2). On the other hand, abundant W and C atoms migrate into WC crystal nucleuses during the growth of grain size, which promotes the growth of WC particles.
The mean size and maximum size of WC particles of three samples.

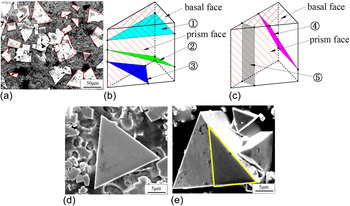
Typical micrographs in the center of the coating with high magnification are presented in Fig. 6. A large number of white triangles, quadrilaterals, or triangles plus quadrilaterals grains can be observed (typical shapes marked as dotted lines). Energy dispersive spectrometer (EDS) results confirmed that the elemental ratio of W and C in these grains are generally close to 1:1. Combined with XRD result, it is believed that these grains are basically WC particles. Figures 6(b) and 6(c) illustrate two kinds of cutting from a trigonal prism. The representative cutting planes marked as ➀–➄, respectively, which are showed as triangular or quadrangle shapes. In Fig. 6(b), ➀, ➁, and ➂ show the cross section parallel to the basal face, through three prim faces, and through two prim faces and one basal face for the formation of triangular shape, respectively. As shown in Fig. 6(c), ➃ and ➄ present the cross section through two basal faces, and through one basal face and one prism face for the formation of a quadrangle shape, respectively. According to the above analysis, we can surmise that no matter how to cut triple prisms, the cross sections always showed triangular or quadrangle shapes. These facts are well consistent with our observations in SEM picture [Fig. 6(a)]. Based on above observations, it is reasonable to infer that the three-dimensional stereo shape of WC grains is a trigonal prism.
(a) SEM of the microstructure in the prepared coating; (b) and (c) illustrate possible random cutting planes (triangle and quadrilateral); (d) and (e) are the single WC grain after deep-etching of WC/Ni coating.

To further confirm the above conclusion, deep-corrosion experiments on the coating are carried out. Figure 6(d) shows a single WC grain with the triangle shape. Although the material around WC grain is corroded away, the prism faces of trigonal prism cannot be observed. This is attributed to the fact that the cross section is parallel to the basal face, which is corresponding to Fig. 6(b)-➀. Figure 6(e) shows a relatively complete morphology of a single WC grain, which well-presented as a trigonal prism shape. The darker triangle (marked with yellow lines) should be the cross section, which showed as a triangle shape corresponding to Fig. 6(b)-➂.
C. Microhardness analysis
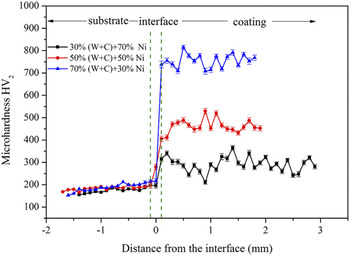
Figure 7 presents the microhardness profiles of three samples across the section from the substrate to the coating top. As shown, due to the reinforcements of in situ fabricated carbide WC, the hardness values of coatings have significant improvement than that of the substrate. The maximum hardness value is 755 HV2, which is about 2.6 times than the 30% (W + C) + 70% Ni specimen. It can be seen that the microhardness value has some fluctuations. This is due to that when the indenter of Vickers tester presses on the softer matrix (binding phase), a lower microhardness value can be observed. While the indenter presses on the harder reinforcement WC, which leads to a higher value.
Microhardness distribution of the coatings.

IV. DISCUSSION
A. The microstructure and the solidification process
The variation of microstructure is related to the solidification characteristics of molten pool, which consists mainly of the temperature gradient G and the solidification rate R. Reference Zhou and Zeng20 At the bottom of the molten pool, for the laser energy dissipation directly through the substrate material, the temperature gradient G is relatively high, while the solidification speed R is relatively low. As a result, the high ratio G/R existing in the interface induces a planar crystal growth. It is known that the dendrite growth is along the opposite direction of temperature gradient beginning from interface. With the increasing distance from the interface to the coatings center, the temperature gradient G gradually decreases meanwhile the solidification speed R gradually increases. Consequently, the lower G/R generates from the interface to the coatings center, which induces a coarse dendrites growth (Fig. 3).
B. Process of in situ synthesized WC
When laser beam scans over powder bed with W–C–Ni powder system, the energy is absorbed by powder particles, producing a molten pool consisting of W–C–Ni melts. At this time, the chemical and physical metallurgical characteristics form in the molten pool and consequently create a beneficial thermodynamic and dynamic condition for reacting to synthesize various phases between the adding elements. It is known that the melting points of W, C, and Ni are 3410, 3650, and 1453 °C, respectively, while the typical temperature in a normal laser cladding melt pool is lower than 3000 °C. Reference Zhong, Liu, Zhang and Zhu21 Therefore, W and C elements are not melting but dissolving into the molten pool. In an initial step, the Ni elements are firstly melted and formed a molten pool, which creates the conditions for a contact of W and C powders. Meanwhile, the W and C powders gradually dissolved and formed to be primary WC grains at the contact site, which served as crystal nuclei for the further growth of WC grains. At this time, the continuous supply of the W and C elements is the precondition for the rapid growth of WC carbide crystals. Because the synthesis process of WC is an exothermic process, the released heat further promotes the dissolution rate of W and C, which provides a guarantee for the supplying of W and C elements. Therefore, it is believed that the key factor for the further WC crystal growth is the enough supplements of W and C elements during laser cladding.
C. The growth mechanism of WC in the coatings
The Wulff theory indicates that the total surface energy of a crystal in the equilibrium form would be a minimum for a given volume. Reference Wulff22 Therefore, the equilibrium shape of crystal is related to the free energy of the crystal faces. As a result, the crystal growth would be bounded by crystal faces distances, which is proportional to their surface energies. In other words, the final formed crystal faces are those with the lowest surface energy, which are also with the greatest interplanar distances (d hkl ). Reference Prywer23,Reference Mullin24 The BFDH law, Reference Donnay and Harker25,Reference Hartman and Perdok26 which defines that the growth rates (R hkl ), is inversely proportional to the interplanar distances (d hkl ), can be expressed as follows:
 $${R_{hkl}} \propto {1 \mathord{\left/ {\vphantom {1 {{d_{hkl}}}}} \right. \kern-\nulldelimiterspace} {{d_{hkl}}}}\quad .$$
Equation (4) illustrates that the larger the interplanar distances will result in the smaller growth rates, which lead to a larger morphological importance (MI). The MI of a crystal face can be explained as the important level of the appeared area of a crystal face.
Reference Prywer23
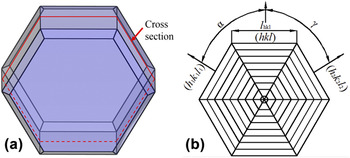
Figure 8(a) shows an assuming crystal, which is cut by cross section [Fig. 8(b)]. Therefore, the MI of a crystal can be expressed by cross-sectional size. Based on geometric principle,
 ${l_{hkl}}$
is given by the following:
 $${l_{hkl}} = {{{R_{{h_1}{k_1}{l_1}}}\sin \gamma + {R_{{h_2}{k_2}{l_2}}}\sin \alpha - {R_{hkl}}\sin \left( {\alpha + \gamma } \right)} \over {\sin \alpha \sin \gamma }}\tau \quad ,$$
where
 ${R_{hkl}}$
,
 ${R_{{h_1}{k_1}{l_1}}}$
, and
 ${R_{{h_2}{k_2}{l_2}}}$
are the normal growth rates corresponding to the hkl, h
1
k
1
l
1, and h
2
k
2
l
2 faces, respectively. α and γ are the appropriate interfacial angles presented in Fig. 8, and τ is the growth time.
(a) A hypothetical crystal structure and (b) the cutaway section.

According to BFDH law and Eq. (4), Eq. (5) takes form to be the following:
 $${l_{hkl}} = {{{1 \over {{d_{{h_1}{k_1}{l_1}}}}}\sin \gamma + {1 \over {{d_{{h_2}{k_2}{l_2}}}}}\sin \alpha - {1 \over {{d_{hkl}}}}\sin \left( {\alpha + \gamma } \right)} \over {\sin \alpha \sin \gamma }}\tau \quad .$$
According to Ref. Reference Prywer27, the instantaneous rate denoted by dl
hkl
/dτ is interpreted as the tangential growth rate. If assumed that dl
hkl
/dτ = 0, the critical interplanar distance
 $d_{hkl}^{{\rm{crit}}}$
can be obtained:
 $$d_{hkl}^{{\rm{crit}}} = {{\sin \left( {\alpha + \gamma } \right)} \over {{{\sin \gamma } \over {{d_{{h_1}{k_1}{l_1}}}}} + {{\sin \alpha } \over {{d_{{h_2}{k_2}{l_2}}}}}}}\quad .$$
The d
hkl
divided by the
 $d_{hkl}^{{\rm{crit}}}$
is expressed as D
crit, then
 $${D^{{\rm{crit}}}} = {{{d_{hkl}}} \over {d_{hkl}^{{\rm{crit}}}}} = {{{{{d_{hkl}}} \over {{d_{{h_1}{k_1}{l_1}}}}}\sin \gamma + {{{d_{hkl}}} \over {{d_{{h_2}{k_2}{l_2}}}}}\sin \alpha } \over {\sin \left( {\alpha + \gamma } \right)}}\quad .$$
D crit is called critical relative interplanar distance. The physical meaning of Eq. (8) is the following:
-
(i) If D crit > 1, it means that the corresponding hkl faces gradually develop during the crystal growth process.
-
(ii) If D crit ≤ 1, it means that the corresponding hkl faces gradually disappear during the crystal growth process.
The above equation estimates the appearance rate of a given hkl plane. Based on these principles, the total surface energy (E total) and growth rate (R hkl ) of the WC crystal are simulated by MATERIALS STUDIO (version 7.0) software.
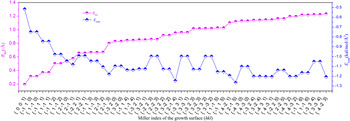
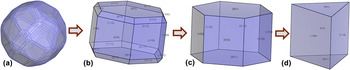
Figure 9 is the values of total surface energy (E total) and growth rate (R hkl ) of each crystal planes. The calculated E total and R hkl indicate that the sequence of MI is {0 0 1} > {−1 1 0} = {1 −1 0} > {−1 1 1} = {1 −1 1} > {−1 1 2} ⋯ ⋯. According to the above calculation, the evolution of WC grains can be deduced during the solidification process. At the initial stage of solidification, as all the crystal faces grow in the relative equilibrium condition, the surface energy is similar along their respective Miller Index direction, thus the WC grains are the close-to-sphere [Fig. 10(a)]. With the progress of the solidification, the anisotropy of surface energy gradually increases. According to the Gibbs–Wulff theory and the BFDH law, the crystal faces with higher surface energy and higher growth rate will gradually disappear. Therefore, the crystal morphology gradually develops to be octahedron shape [Fig. 10(b)]. Furthermore, the D crit of the same crystal structure is calculated by Jolanta Prywer, Reference Prywer23 which showed that the value of {−1 1 1} and {1 −1 1} faces are less than 1, indicating that the final faces are only {0 0 1}, {−1 1 0}, and {1 −1 0}. Thus, the WC grains gradually develop as hexagonal prism [Fig. 10(c)].
R hkl and E total of each surface of WC crystal structure.

(a-d) Schematic illustration of the morphology evolution of the WC grains.

It is worth mentioning that both R hkl and E total of {−1 1 0} and {1 −1 0} faces are equal, so {−1 1 0} and {1 −1 0} faces have the same MI. On the other hand, {−1 1 0} and {1 −1 0} faces have the same growth rates and surface energy, and the final morphology of WC should be hexagonal prism. However, the actual observation shows that the morphology of WC is trigonal prism (shown in Figs. 3 and 6). According to Christensen et al., Reference Christensen, Wahnstrom, Lay and Allibert28,Reference Christensen, Wahnström, Allibert and Lay29 the crystal shape also depends on the interface energy at the metal–ceramic interface, which means that the different interface energy of {−1 1 0} and {1 −1 0} faces will result in different growth rates.
It is well known that WC has a hexagonal unit cell with c/a = 0.976, space group
 $P\bar 6m2$
, which is characterized by W atoms at (0, 0, 0) sites and C atoms at (1/3, 2/3, 1/2) positions. The lattice parameters of WC are a = 0.2906 nm and c = 0.2837.
Reference Vicens, Laurent-Pinson, Chermant and Nouet30
Thus, WC has no symmetry center, the {−1 1 0} and {1 −1 0} facets are not equivalent, which caused different metal–ceramic interface bond. Christensen et al. performed interface energy calculations,
Reference Christensen, Wahnström, Allibert and Lay29
and the results showed that the surface energy of {−1 1 0} is smaller to the {−1 1 0} facets, indicating {−1 1 0} surfaces possess more morphological importance. Therefore, WC grains gradually develop into trigonal prism during the final stages of solidification [Fig. 10(d)]. According to above analysis, the conclusion can be drawn that WC grains firstly nucleate as a sphere, and then grow into a hexagonal prism, and finally develop to be the triangular prism.
V. CONCLUSIONS
WC grains are in situ synthesized by laser cladding with W–C–Ni ternary system. The obtained WC reinforced coating shows a good forming quality without cracks and pores, and a good metallurgical bond is produced at the interface between coating and substrate. The in situ synthesized WC particles distribute homogenously in the coating. The volume fraction and the area ratio of WC particles increase with the increasing of the raw W–C powders, and the largest scale WC particles formed in the 70% (W + C) + 30% Ni sample.
Unique triangular prism shape of WC is deduced by SEM and further confirmed with deep-corrosion samples. The calculation results indicate that {0 0 1}, {−1 1 0}, and {1 −1 0} faces have the lower surface energy and growth rate, therefore, they possess the higher morphological importance. Furthermore, the interface energy between the {−1 1 0}, {1 −1 0} faces and the binding phase is different, because WC has no symmetry structure, which results in different growth rates. Therefore, the actual sequence of the growth rate of crystal faces is {0 0 1} < {−1 1 0} < {1 −1 0}. Based on these results, the morphology evolution of the WC grains evolves from sphere to hexagonal prism, and finally to triangular prism. The theoretical calculation results agree well with the experiments.
ACKNOWLEDGMENTS
This work is financially supported by the National Natural Science Foundation of China (Grant No. 51171116), the Shuguang Project of Shanghai Municipal Education Committee (Grant No. 12SG15). The authors are also thanks the financial support from the Nature Science Foundation of Anhui Province (Grant No. TSKJ2015B02), the open fund of national precision engineering technology research center of small and special electric machine (Grant No. 3651HT001), and the open fund of key laboratory of advanced manufacturing technology, ministry of education (Grant No. XDSYS2016001).