







1. Introduction
Despite general agreement on the existence of self-sustained processes in wall-bounded turbulence, there are different understandings of the mechanisms involved. A common technique to tackle this problem consists in writing the Navier–Stokes (N–S) equations as a linear evolution equation with nonlinear feedback; the nonlinear feedback being a forcing that includes the instantaneous nonlinear advection terms associated with the velocity fluctuations. The flow is decomposed into a time-invariant reference state and a fluctuation component, the reference state is usually assumed to be known, and the fluctuations become the unknown variable. Thus, the system dynamics is clearly described as the combination of the energy amplification and the energy redistribution mechanisms, which are represented by the linear operator and the nonlinear forcing.
The choice of the reference state and the treatment of the nonlinear forcing in the mentioned framework is key. A set of studies bypassed the explicit computation of the nonlinear term and dealt solely with the linear evolution operator. The approach consists of taking the time-averaged field as the reference state and introducing assumptions to avoid the computation of the nonlinear forcing (Malkus Reference Malkus1956; Butler & Farrell Reference Butler and Farrell1993; Farrell & Ioannou Reference Farrell and Ioannou1993; McKeon & Sharma Reference McKeon and Sharma2010). Another approach, first proposed by Reynolds & Tiederman (Reference Reynolds and Tiederman1967), Reynolds & Hussain (Reference Reynolds and Hussain1972) and later revived by Bottaro, Souied & Galletti (Reference Bottaro, Souied and Galletti2006), del Álamo & Jimenez (Reference del Álamo and Jimenez2006), Cossu, Pujals & Depardon (Reference Cossu, Pujals and Depardon2009), Pujals et al. (Reference Pujals, García-Villalba, Cossu and Depardon2009) and Hwang & Cossu (Reference Hwang and Cossu2010a,Reference Hwang and Cossuc), consists of modelling part of the nonlinear forcing with an eddy viscosity and introducing assumptions to avoid the computation of the remainder of the nonlinear forcing. This leads to a modified linear operator. A review of these two approaches with the benefits and limitations of using an eddy-viscosity model can be found in McKeon (Reference McKeon2017) or Cossu & Hwang (Reference Cossu and Hwang2017). It is noteworthy that these approaches do not need a priori knowledge of the flow fluctuations.
A set of studies takes the time-averaged field as a reference state and treats the nonlinear forcing as an unknown (exogenous) stochastic input. This approach consists of assuming this stochastic input as uncorrelated in space and time, and in predicting the dynamics with a ‘to-be-designed’ estimator as the Kalman filter (Chevalier et al. Reference Chevalier, Hœpffner, Bewley and Henningson2006; Illingworth, Monty & Marusic Reference Illingworth, Monty and Marusic2018). The estimator consists of the original system without the nonlinear forcing (i.e. the stochastic input) but with the addition of a correction term, which is designed to minimize the variance of the prediction error. It is noteworthy that this approach requires the instantaneous knowledge of a linear combination (i.e. a measurement) of the fluctuation quantities.
Another approach, introduced by Zare, Jovanović & Georgiou (Reference Zare, Jovanović and Georgiou2017), consists of computing simultaneously the covariances of both the flow fluctuations and the stochastic input. The stochastic input is not restricted to be uncorrelated in space or time, nor it is assumed to be a function of the fluctuations. The relationship between the fluctuations and the input is enforced by the Lyapunov equation associated with the original system with the nonlinear forcing treated as an unknown (exogenous) stochastic input. The method is a constrained optimization problem. The constraints are the Lyapunov equation and the fact that the covariance of the fluctuation quantities must be consistent with available data. The objective function to minimize is the result of a ‘regularized maximum entropy formalism’, where the ‘maximum entropy formalism’ utilized is known to be equivalent to the ‘maximum likelihood formalism’ (see Goodwin & Payne (Reference Goodwin and Payne1977) or Della Pietra, Della Pietra & Lafferty (Reference Della Pietra, Della Pietra and Lafferty1997) for details).
Another approach, presented by Towne, Lozano-Durán & Yang (Reference Towne, Lozano-Durán and Yang2020), uses the resolvent to compute an approximation of the cross-spectral density (CSD) of the nonlinear forcing. The method exploits the input–output relationship described by the resolvent in the frequency domain. The approach assumes the knowledge of the output, which is taken with a number of sensors, and makes use of the singular values and singular vectors of the resolvent to reconstruct the corresponding input, which is the nonlinear forcing. The technique consists of a projection approach, equivalent to the application of the pseudo-inverse of the resolvent operator to the known statistics. Therefore, the computed forcing is the best attainable in a least-squares sense.
The aforementioned works deal with an approximation of the nonlinear forcing based on available statistics. Quantifying this forcing directly from the nonlinear advection term of the sole fluctuation velocity, which is the definition, is not sought there. Rosenberg & McKeon (Reference Rosenberg and McKeon2019) analysed this term for two ‘exact coherent states’ (i.e. invariant solutions of the N–S) of an incompressible channel flow at friction Reynolds number  $Re_{\tau }=85$ (Nagata Reference Nagata1990; Park & Graham Reference Park and Graham2015). They utilized the Orr–Sommerfeld–Squire (OSS) equations (Schmid & Henningson Reference Schmid and Henningson2001) to build the resolvent operator and focused on the solenoidal part of the nonlinear forcing, which is the only one affecting the velocity field of an incompressible flow (Chorin & Marsden Reference Chorin and Marsden1993). However, the authors focused on the variance of the solenoidal forcing, so the analysis did not distinguish between the contribution of different frequencies. Symon, Sipp & McKeon (Reference Symon, Sipp and McKeon2019) isolated the contribution of each frequency by employing the spectral proper orthogonal decomposition (SPOD) (Lumley Reference Lumley1970; Picard & Delville Reference Picard and Delville2000). However, they used data from particle image velocimetry (PIV) of the flow around a NACA0018 airfoil at a chord-based Reynolds number
 $Re =10\,250$, and the forcing is not decomposed in its solenoidal and irrotational parts.
The nonlinear forcing term is non-solenoidal by construction. To evaluate its solenoidal part, one of the variants of the Helmholtz–Hodge decomposition (HHD) can be performed (see Chorin & Marsden (Reference Chorin and Marsden1993) or Bhatia et al. (Reference Bhatia, Norgard, Pascucci and Bremer2013) for details; see Wu, Zhou & Wu (Reference Wu, Zhou and Wu1996) or Rosenberg & McKeon (Reference Rosenberg and McKeon2019) for examples of applications). The HHD requires specific boundary conditions to assure the orthogonality and the uniqueness of the resulting solenoidal and irrotational fields (Chorin & Marsden Reference Chorin and Marsden1993; Bhatia et al. Reference Bhatia, Norgard, Pascucci and Bremer2013), which amounts to imposing a priori the unknown solenoidal field be parallel to the wall. This assumption and the use of the HHD can be avoided when using the OSS because the solenoidal part of the forcing can be retrieved directly with the operators of the OSS, as presented here in appendix B.
Access to a quantitative characterization of the nonlinear forcing term can be helpful for addressing the domain of validity of modelling techniques that aim at mimicking its effects on the dynamics. Beneddine et al. (Reference Beneddine, Sipp, Arnault, Dandois and Lesshafft2016) mentioned that such quantification is convenient also to assess the validity of mean flow stability analysis, which has generally been based on the sole singular values of the resolvent. Moreover, even though there is general agreement on the existence of self-sustained coherent motions and visualizations of such motions are presented, there is no documentation of the spatiotemporal structure of the nonlinear forcing terms resulting from the fluctuation velocities for turbulent channel flows. As these nonlinear forcing terms cause the feedback mechanism in the linearized system dynamics, its quantification is of interest to further understand the ‘recycling’ of the amplified outputs in the input from the nonlinear terms.
Moreover, it is understood that the shape of the linear optimal forcing that results from resolvent analyses similar to Farrell & Ioannou (Reference Farrell and Ioannou1993) or McKeon & Sharma (Reference McKeon and Sharma2010) does not necessarily coincide with that of the nonlinear forcing term of a turbulent channel flow. Beneddine et al. (Reference Beneddine, Sipp, Arnault, Dandois and Lesshafft2016), among others, remarked on this. This linear optimal forcing is the right singular vector of the resolvent associated with the highest singular value. Morra et al. (Reference Morra, Semeraro, Henningson and Cossu2019) showed a case where using the right-singular vectors as forcing to the resolvent does not result in the same velocity field of direct numerical simulations (DNS). As the right singular vectors of the resolvent form a basis that spans the forcing space, it can be inferred that the nonlinear forcing term has significant projection onto the linear sub-optimals. However, there is no such verification.
When dealing with coherent motions in the framework of stochastic forcing and response, the resolvent operator and the SPOD prove to be useful tools. SPOD assures the resulting modes to be coherent in space and time (Towne, Schmidt & Colonius Reference Towne, Schmidt and Colonius2018), whereas the resolvent operator can describe the input–output relationship between the CSDs of the input and the output, on which the SPOD is based. The usage of the CSD allows us to isolate the dominant energetic structures, so it avoids blurring the interpretation of the results. It is known that a relation exists between the SPOD modes and the singular modes of the resolvent operator (Towne et al. Reference Towne, Schmidt and Colonius2018; Cavalieri, Jordan & Lesshafft Reference Cavalieri, Jordan and Lesshafft2019; Lesshafft et al. Reference Lesshafft, Semeraro, Jaunet, Cavalieri and Jordan2019), but investigations of turbulent channel flows have been based on assumptions, without quantifying the effects of the nonlinear forcing term as input.
In this work a quantification of the nonlinear forcing term, usually treated as an input in resolvent analyses, is accomplished for turbulent channel flows. The investigated flows have friction Reynolds numbers  $Re_{\tau }=179$ and
 $Re_{\tau }=543$. The resolvent framework is employed. The reference state upon which the resolvent is built is the time-averaged field, so the nonlinear forcing term consists of the advection term with the fluctuation velocities. The nonlinear forcing is quantified through its CSD for the most energetic near-wall and large-scale structures, such that the input–output relation of the most energetic motions is highlighted. The CSD of the nonlinear forcing term is computed directly from snapshots of DNS data by means of the Welch method, with the same technique as discussed by Nogueira et al. (Reference Nogueira, Morra, Martini, Cavalieri and Henningson2021). The complete non-solenoidal forcing and its solenoidal part are presented, and its effects on the output discussed. The expected coherence of the forcing is quantified here. Moreover, inspired by the discussion in Beneddine et al. (Reference Beneddine, Sipp, Arnault, Dandois and Lesshafft2016), a quantification of the key parameters to assess the accuracy of resolvent analyses is possible and performed here. Thus, an evaluation of the errors introduced by neglecting or modelling the nonlinear forcing is possible and presented. The aim of this work is to compensate the lack in the literature of an explicit characterization of the spatiotemporal structure of the nonlinear forcing term for turbulent channel flows, and provide a foundation for all the studies which choose to include assumptions about this nonlinear forcing term to facilitate the mathematical treatment.
This paper is structured as follows. In § 2 the governing equations of the problem addressed are summarized. In § 3 the results of the DNS are presented, the CSD of the forcing is shown and discussed. In § 4 the effects of the nonlinear forcing term are analysed and the low-rank property of the associated CSD demonstrated. In § 5 an assessment of the errors introduced when resorting to modelling the nonlinear forcing term are discussed by comparison with the nonlinear forcing term computed from DNS data. The results are summarized and discussed in § 6. Further details about the operators involved in the analysis and the Welch method are provided in appendices A, B, and C.
2. Governing equations
2.1. Evolution equations for the fluctuation quantities
This work focuses on the dynamics of perturbations about the time-averaged fields in a channel flow. The flow is incompressible and the density constant. The quantities treated here are non-dimensionalized, and the Reynolds number  $Re = (3/2) U_{bulk} h/\nu$ is based on the channel half-height
 $h$, the constant mass-averaged streamwise velocity
 $U_{bulk}$ and the fluid molecular viscosity
 $\nu$. The domain is described with Cartesian coordinates
 ${\boldsymbol {x}} = (x,y,z)^\textrm {T}$, which correspond to the streamwise, wall-normal and spanwise directions. The total velocity and pressure fields can be described as the superposition of the time-averaged fields and the fluctuations,
 $\boldsymbol {u}_{tot} = \boldsymbol {U} + \boldsymbol {u}$ and
 $p_{tot} = P + p$, as in the Reynolds decomposition. Here,
 $\boldsymbol {U} = (U(y),0,0)^{\textrm {T}}$ is the mean flow in the channel,
 $P=P(x)$ the time-averaged pressure field,
 $\boldsymbol {u} = (u(\boldsymbol {x},t),v(\boldsymbol {x},t),w(\boldsymbol {x},t))^{\textrm {T}}$ the perturbation velocity and
 $p = p(\boldsymbol {x},t)$ the perturbation pressure;
 $t$ being the non-dimensional time. Both the mean flow and the perturbation velocity are subject to the incompressibility condition
 $\boldsymbol {\nabla } \boldsymbol {\cdot } \boldsymbol {U} = 0$ and
 $\boldsymbol {\nabla } \boldsymbol {\cdot }\boldsymbol {u} = 0$, with
 $\boldsymbol{\nabla}=(\partial _{x},\partial _{y},\partial _{z})^{\textrm {T}}$ such that
 $\nabla ^2 = \boldsymbol {\nabla } \boldsymbol {\cdot } \boldsymbol {\nabla }$. Assuming
 $\boldsymbol {U}$ and
 ${P}$ to be known, the momentum equations
 \begin{equation} \frac{\partial \boldsymbol{u}}{\partial t} + (\boldsymbol{U} \boldsymbol{\cdot} \boldsymbol{\nabla}) \boldsymbol{u} + (\boldsymbol{u} \boldsymbol{\cdot} \boldsymbol{\nabla}) \boldsymbol{U} = -\boldsymbol{\nabla} p + \frac{1}{Re} \nabla^2 \boldsymbol{u} +\boldsymbol{b} + \boldsymbol{f}, \end{equation}
are the evolution equations for the fluctuations, where the density is included in the pressure term,  $\boldsymbol {b} = -\boldsymbol {\nabla } P + {Re}^{-1} \nabla ^2 \boldsymbol {U} - (\boldsymbol {U} \boldsymbol {\cdot } \boldsymbol {\nabla }) \boldsymbol {U}$ includes the contribution of time-averaged quantities only, and
 $\boldsymbol {f} = - (\boldsymbol {u} \boldsymbol {\cdot } \boldsymbol {\nabla }) \boldsymbol {u}$ the instantaneous Reynolds stresses from the fluctuations; it is assumed that there is no external body force. It is notable that (2.1) has the same structure of the perturbation equation of a flow linearized about an equilibrium solution of the N–S equations, in which case
 $\boldsymbol {b}=0$ by construction.
2.2. Harmonic and stochastic forcing analysis
As the mean flow is homogeneous in the wall-parallel directions, the Fourier transform can be applied along those directions and the same manipulations to obtain the OSS equations can be performed. Thus, by introducing  $\hat {{\boldsymbol {q}}^{\star}} = (\hat {v}(\alpha ,y,\beta ,t),\hat {\omega }_y(\alpha ,y,\beta ,t))$ as the vector containing the wall-normal velocity and vorticity Fourier modes, (2.1) can be written in terms of
 $\hat {\boldsymbol {q}^{\star}}(\alpha ,y,\beta ,t)\exp(\textrm{i}(\alpha x + \beta z))$ and
 $\hat {\boldsymbol {f}^{\star}}(\alpha ,y,\beta ,t)\exp(\textrm{i}(\alpha x+\beta z))$ Fourier modes. Moreover, by discretizing the wall-normal direction with
 $N_y$ points, and by introducing the vectors
 $\hat {\boldsymbol {q}}$,
 $2N_y\times 1$, and
 $\skew5\hat {\boldsymbol {f}}$,
 $3N_y\times 1$, as the discrete counterparts of
 $\hat {\boldsymbol {q}^{\star}}$ and
 $\hat {\boldsymbol{f}^{\star}}$, (2.1) reduces to the system
 \begin{equation} \frac{\partial \hat{\boldsymbol{q}}}{\partial t} = \boldsymbol{\mathsf{A}} \hat{\boldsymbol{q}} +\boldsymbol{\mathsf{B}}\skew5\hat{\boldsymbol{f}}, \end{equation}
where  $\boldsymbol {b}$ is not included because the focus of this study is on
 $\alpha \neq 0$ and
 $\beta \neq 0$, and
 $\boldsymbol {b}$ is constant along the wall-parallel directions. In the discretized domain the Fourier modes of the fluctuation velocity
 $\hat {\boldsymbol {u}^{\star}}(\alpha ,y,\beta ,t)\exp({\textrm {i}(\alpha x + \beta z)})$ correspond to the vector
 $\hat {\boldsymbol {u}}$,
 $3N_y\times 1$, and can be computed as
 $\hat {\boldsymbol {u}} = \boldsymbol{\mathsf{C}}\hat {\boldsymbol {q}}$, whereas
 $\hat {\boldsymbol {q}} = \boldsymbol{\mathsf{D}}\hat {\boldsymbol {u}}$. The expressions for the matrices
 $\boldsymbol{\mathsf{A}}$,
 $\boldsymbol{\mathsf{B}}$,
 $\boldsymbol{\mathsf{C}}$ and
 $\boldsymbol{\mathsf{D}}$ are given in appendix A. For the sake of readability dependencies on the wavenumbers
 $\alpha$ and
 $\beta$ are no longer written explicitly.
As  $\boldsymbol {U}$ and
 $P$ are the time-averaged fields of a turbulent channel flow, the system described by (2.2) is linearly stable (Reynolds & Tiederman Reference Reynolds and Tiederman1967), so a finite amplitude forcing can be studied by performing the Fourier transform in time on (2.2). Then, the harmonic forcing
 $\skew5\hat{\boldsymbol {f}} = \,\skew4\tilde{\boldsymbol{f}}(\omega )\,\textrm {e}^{-\textrm {i} \omega t}$ and the harmonic response
 $\hat {\boldsymbol {u}} = \tilde {\boldsymbol {u}}(\omega )\,\textrm {e}^{-\textrm {i} \omega t}$ are related by
 $\tilde {\boldsymbol {u}}(\omega ) = {\boldsymbol{\mathsf{R}}}(\omega ) \,\skew4\tilde{\boldsymbol{f}}(\omega )$, with
 \begin{equation} \boldsymbol{\mathsf{R}}(\omega) = -\boldsymbol{\mathsf{C}}(\textrm{i} \omega \boldsymbol{\mathsf{I}} + \boldsymbol{\mathsf{A}})^{-1} \boldsymbol{\mathsf{B}}, \end{equation}
the  $3N_y \times 3N_y$ matrix form of the resolvent operator (with boundary conditions
 $\tilde {v} = \partial \tilde {v}/\partial y = \tilde {\omega }_y = 0$ or, equivalently,
 $\tilde {u} = \tilde {v} = \tilde {w} = 0$, at
 $y = \pm 1$). A singular value decomposition (SVD) allows the resolvent matrix
 $\boldsymbol{\mathsf{R}}(\omega )$ to be expressed in terms of its left-singular vectors
 $\boldsymbol {\psi }_i(\omega )$, its singular values
 $\sigma _i(\omega )$ and its right-singular vectors
 $\boldsymbol {\phi }_i(\omega )$, such that
 \begin{gather} \boldsymbol{\phi}_{i}^{H} \boldsymbol{\mathsf{W}} \boldsymbol{\phi}_j = \delta_{ij}, \end{gather}
 \begin{gather}\boldsymbol{\psi}_{i}^{H} \boldsymbol{\mathsf{W}} \boldsymbol{\psi}_j = \delta_{ij} , \end{gather}
with  $^H$ the complex conjugate transpose,
 $\delta _{ij}$ the Kronecker delta and
 $\boldsymbol{\mathsf{W}}$ the positive-definite Hermitian matrix,
 $3N_y\times 3N_y$, of quadrature weights necessary to compute the energy norm on the discrete grid of the wall-normal direction.
If instead of harmonic excitation a stochastic and statistically stationary forcing is considered, the response will also be stochastic and statistically stationary. In this case the Fourier transform in time cannot be applied because  $\int _{-\infty }^{\infty }| \hat {{\boldsymbol {u}}}|^2 \,\mathrm {d}t< \infty$ (or
 $\int _{-\infty }^{\infty }| \hat {\boldsymbol {q}}|^2 \,\mathrm {d}t< \infty$) and
 $\int _{-\infty }^{\infty }| \,\skew5\hat {{\boldsymbol {f}}}|^2 \,\mathrm {d}t < \infty$ do not hold (Chibbaro & Minier Reference Chibbaro and Minier2014). A quantity that exists and can be computed for a statistically stationary process is the CSD (Stark & Woods Reference Stark and Woods1986), which is defined for the vectors
 $\hat {{\boldsymbol {u}}}$ and
 $\,\skew5\hat {{\boldsymbol {f}}}$ as
 \begin{gather} {\boldsymbol{\mathsf{S}}}(\omega) = \lim_{T \to \infty} \frac{\mathbb{E}\left[ \left( \dfrac{1}{2{\rm \pi}}\displaystyle\int_{-T}^{T} \hat{{\boldsymbol{u}}}(t) \,\textrm{e}^{-\textrm{i}\omega t} \,\mathrm{d}t \right)\left(\dfrac{1}{2{\rm \pi}} \displaystyle\int_{-T}^{T}\hat{{\boldsymbol{u}}}(t)^{H} \,\textrm{e}^{\textrm{i}\omega t}\,\mathrm{d}t \right) \right]}{2T}, \end{gather}
 \begin{gather}{\boldsymbol{\mathsf{P}}}(\omega) = \lim_{T \to \infty} \frac{\mathbb{E}\left[ \left(\dfrac{1}{2{\rm \pi}}\displaystyle\int_{-T}^{T} \hat{{\boldsymbol{f}}}(t) \,\textrm{e}^{-\textrm{i}\omega t} \,\mathrm{d}t \right)\left(\dfrac{1}{2{\rm \pi}} \displaystyle\int_{-T}^{T}\hat{{\boldsymbol{f}}}(t)^{H} \,\textrm{e}^{\textrm{i}\omega t}\,\mathrm{d}t \right) \right]}{2T}, \end{gather}
where  $T$ is the total time, the expectation
 $\mathbb {E} [\cdot ]$ is the ensemble average over different stochastic realizations and the CSDs are the
 $3N_y \times 3N_y$ matrices
 ${\boldsymbol{\mathsf{S}}}(\omega )$ and
 ${\boldsymbol{\mathsf{P}}}(\omega )$. The diagonals of
 ${\boldsymbol{\mathsf{S}}}(\omega )$ and
 ${\boldsymbol{\mathsf{P}}}(\omega )$ contain the power-spectral density (PSD) of the three velocity and forcing components at the discrete points of the wall-normal direction for a given angular frequency
 $\omega$ (and the omitted
 $\alpha$ and
 $\beta$). For the sake of readability the streamwise, wall-normal and spanwise components on the diagonal of
 ${\boldsymbol{\mathsf{S}}}(\omega )$ and
 ${\boldsymbol{\mathsf{P}}}(\omega )$ are from now on referred to with the
 $N_y\times 1$ vectors
 ${\boldsymbol {s}}_{uu}$,
 ${\boldsymbol {s}}_{vv}$,
 ${\boldsymbol {s}}_{ww}$, and
 ${\boldsymbol {p}}_{uu}$,
 ${\boldsymbol {p}}_{vv}$,
 ${\boldsymbol {p}}_{ww}$. Then, the premultiplied streamwise kinetic energy spectra can be computed as
 \begin{equation} \alpha \beta {\boldsymbol{e}}^{kin}_{uu} = \alpha \beta \int_{-\infty}^{\infty} {\boldsymbol{s}}_{uu}(\omega) \, \mathrm{d}\omega. \end{equation}
As the system in (2.2) is stable, it also holds (Stark & Woods Reference Stark and Woods1986)
 \begin{equation} {\boldsymbol{\mathsf{S}}}(\omega) = {\boldsymbol{\mathsf{R}}}(\omega){\boldsymbol{\mathsf{P}}}(\omega){\boldsymbol{\mathsf{R}}}(\omega)^{H}, \end{equation}
which is the input–output relation of the CSDs. For the sake of readability dependencies on the angular frequency  $\omega$ are no longer written explicitly.
As  ${\boldsymbol{\mathsf{S}}}$ and
 ${\boldsymbol{\mathsf{P}}}$ are CSDs, the Karhunen–Loève decomposition can be performed, which for quantities in the frequency domain is referred to as SPOD (Lumley Reference Lumley1970; Picard & Delville Reference Picard and Delville2000; Towne et al. Reference Towne, Schmidt and Colonius2018). The SPOD modes of the matrices
 ${\boldsymbol{\mathsf{S}}}$ and
 ${\boldsymbol{\mathsf{P}}}$ correspond to the
 $3N_y \times 1$ eigenvectors
 ${\boldsymbol {\xi }}_i$ and
 ${\boldsymbol {\zeta }}_i$ of the matrix eigenvalue problems
 $\boldsymbol{\mathsf{SW}}{\boldsymbol {\xi }}_i=\mu _{i}{\boldsymbol {\xi }}_i$ and
 $\boldsymbol{\mathsf{PW}}{\boldsymbol {\zeta }}_i=\eta _i {\boldsymbol {\zeta }}_i$. The eigenvectors are orthogonal in
 ${\boldsymbol {\xi }}_i^H\boldsymbol{\mathsf{W}}{\boldsymbol {\xi }}_j=\delta _{ij}$ and
 ${\boldsymbol {\zeta }}_i^H\boldsymbol{\mathsf{W}}{\boldsymbol {\zeta }}_j=\delta _{ij}$. Thus, the CSDs can be expanded as
 ${\boldsymbol{\mathsf{S}}} = \sum _i \mu _i {\boldsymbol {\xi }}_i{\boldsymbol {\xi }}^{H}_i$ and
 ${\boldsymbol{\mathsf{P}}} = \sum _i \eta _i {\boldsymbol {\zeta }}_i{\boldsymbol {\zeta }}^{H}_i$, such that the diagonal of
 ${\boldsymbol{\mathsf{S}}}$ and
 ${\boldsymbol{\mathsf{P}}}$ can be written as
 \begin{gather} \mathrm{diag}({\boldsymbol{\mathsf{S}}}) = \sum_{i} \mu_i |{\boldsymbol{\xi}}_i |^2, \end{gather}
 \begin{gather}\mathrm{diag}({\boldsymbol{\mathsf{P}}}) = \sum_{i} \eta_i |{\boldsymbol{\zeta}}_i |^2, \end{gather}
with  $| \cdot |$ the absolute value of each entry of the vector. It can be noted that because the SPOD modes are orthogonal in the inner product associated with the energy norm, the ratios
 $\mu _{i}/\sum _{i}\mu _i$ and
 $\eta _{i}/\sum _{i}\eta _i$ represent the fraction of power associated with the
 $i$th SPOD mode.
The computation of the left- and right-singular vectors of  ${\boldsymbol{\mathsf{R}}}$ allows the input–output relation
 ${\boldsymbol{\mathsf{S}}}={\boldsymbol{\mathsf{R}}}{\boldsymbol{\mathsf{P}}}{\boldsymbol{\mathsf{R}}}^H$ to be split into three steps: (i) the projection of
 ${\boldsymbol{\mathsf{P}}}$ onto the right-singular vectors
 $\boldsymbol {\phi }_i$, which results in a scalar
 \begin{equation} b_i^2 = \boldsymbol{\phi}_i^H\boldsymbol{\mathsf{W}}{\boldsymbol{\mathsf{P}}}\boldsymbol{\mathsf{W}}\boldsymbol{\phi}_i \end{equation}
for each  $\boldsymbol {\phi }_i$; (ii) the amplification or damping of the associated singular values
 $\sigma _i$ by
 $b_i$, which results in a scalar
 $a_i = \sigma _i b_i$; and (iii) the linear combination of the left-singular vectors
 $\boldsymbol {\psi }_i$ weighted with
 $a_i$ such that
 \begin{equation} \mathrm{diag}({\boldsymbol{\mathsf{S}}}) = \sum_i |\boldsymbol{\psi}_i|^2 a_i^2. \end{equation}
As  $\sigma _i$ do not depend on
 ${\boldsymbol{\mathsf{P}}}$ and
 $a_i^2 = \sigma _i^2 b_i^2$, it is the coefficients
 $b_i$ that quantify the contribution of the forcing
 ${\boldsymbol{\mathsf{P}}}$ to the output
 ${\boldsymbol{\mathsf{S}}}$. Note that if
 $b_i = 1$, then
 ${\boldsymbol{\mathsf{P}}} \equiv {\boldsymbol{\mathsf{I}}}$.
It can be remarked that  ${\boldsymbol{\mathsf{S}}}$ is built upon a solenoidal vector field because the velocity field is divergence free in incompressible flows, whereas
 ${\boldsymbol{\mathsf{P}}}$ is built upon a non-solenoidal vector field because the divergence of the nonlinear forcing
 $\boldsymbol {f}$ is non-zero. Moreover, if the flow is incompressible only the solenoidal part of the forcing affects the velocity field (Chorin & Marsden Reference Chorin and Marsden1993). Therefore, if the forcing is written as the sum of a solenoidal and an irrotational vector field, the irrotational part gives a null response in (2.7). This implies that
 ${\boldsymbol{\mathsf{R}}}$ is singular, and that its null space spans the set of all possible non-solenoidal fields.
It follows that there must be an injective linear transformation between the velocity field and the solenoidal part of the nonlinear forcing field, which may be exploited to extract the solenoidal part of  ${\boldsymbol{\mathsf{P}}}$ when
 ${\boldsymbol{\mathsf{S}}}$ is known. In appendix B it is shown that
 \begin{equation} {\boldsymbol{\mathsf{L}}} = -{\boldsymbol{\mathsf{C}}}(\textrm{i} \omega {\boldsymbol{\mathsf{I}}} + {\boldsymbol{\mathsf{A}}}){\boldsymbol{\mathsf{D}}} \end{equation}
constitutes such a linear relationship. The solenoidal part of  ${\boldsymbol{\mathsf{P}}}$ can be retrieved as
 ${\boldsymbol{\mathsf{L}}}{\boldsymbol{\mathsf{S}}}{\boldsymbol{\mathsf{L}}}^{H}$. It should be noted that
 ${\boldsymbol{\mathsf{L}}}$ is not exactly the inverse of
 ${\boldsymbol{\mathsf{R}}}$ in (2.7) because
 ${\boldsymbol{\mathsf{R}}}$ is singular. In appendix B it is also shown that if the forcing
 $\skew5\hat {{\boldsymbol {f}}}$ is known, its solenoidal part can be computed also as
 ${\boldsymbol{\mathsf{C}}} {\boldsymbol{\mathsf{B}}}\skew5\hat {{\boldsymbol {f}}}$, which can be employed to evaluate the solenoidal part of
 ${\boldsymbol{\mathsf{P}}}$ as
 $({\boldsymbol{\mathsf{C}}} {\boldsymbol{\mathsf{B}}}) {\boldsymbol{\mathsf{P}}} ({\boldsymbol{\mathsf{C}}} {\boldsymbol{\mathsf{B}}})^{H}$. Resorting to
 ${\boldsymbol{\mathsf{L}}}$ or
 ${\boldsymbol{\mathsf{C}}} {\boldsymbol{\mathsf{B}}}$ to compute the solenoidal part of the forcing is equivalent. A more detailed discussion about
 ${\boldsymbol{\mathsf{L}}}$ and
 ${\boldsymbol{\mathsf{C}}} {\boldsymbol{\mathsf{B}}}$ is presented in appendix B.
2.3. Modelling the nonlinear forcing terms
The input–output relationship described by (2.7) includes the contribution of the nonlinear terms, those responsible for the Reynolds stresses, in the input  ${\boldsymbol{\mathsf{P}}}$. The nonlinear terms are usually unknown, and the input
 ${\boldsymbol{\mathsf{P}}}$ is modelled. The lack of knowledge about the nonlinear terms implies that the accuracy of these modelling techniques cannot be based on a direct comparison with them. Instead, the error in the prediction of the velocity field or its statistics is evaluated. As this work aims at presenting the actual
 ${\boldsymbol{\mathsf{P}}}$ that appears in the N–S, its direct comparison with a modelled
 ${\boldsymbol{\mathsf{P}}}$ can be evaluated. Moreover,
 ${\boldsymbol{\mathsf{P}}}$ has never been quantified from instantaneous realizations
 $\skew5\hat {{\boldsymbol {f}}}$ of a turbulent channel flow. Thus, a comparison with the results from often used modelling methods is clearly of interest.
The two modelling approaches discussed in this work are: (i) the assumption that the nonlinear terms are uncorrelated in space  ${\boldsymbol{\mathsf{P}}} = \gamma _{\nu } {\boldsymbol{\mathsf{I}}}$ (with
 $\gamma _{\nu }$ a normalization scalar, and
 ${\boldsymbol{\mathsf{I}}}$ the identity); and (ii) the introduction of an eddy-viscosity
 $\nu _t$ to model a part of the nonlinear terms via the Boussinesq expression. In (ii) the unmodelled part of the nonlinear terms is treated as uncorrelated in space. The two approaches lead to the predictions
 \begin{gather} {\boldsymbol{\mathsf{S}}}_{{\boldsymbol{\mathsf{R}}}_{\nu}} = \gamma_{\nu} {\boldsymbol{\mathsf{R}}} {\boldsymbol{\mathsf{R}}}^H, \end{gather}
 \begin{gather}{\boldsymbol{\mathsf{S}}}_{{\boldsymbol{\mathsf{R}}}_{\nu_t}} = \gamma_{\nu_t} {\boldsymbol{\mathsf{R}}}_{\nu_t} {\boldsymbol{\mathsf{R}}}_{\nu_t}^H, \end{gather}
where  ${\boldsymbol{\mathsf{R}}}_{\nu _t}$ is a modified resolvent that includes the eddy-viscosity modelling (details about the operator are given in appendix A), and
 $\gamma _{\nu _t}$ a normalization scalar.
The forcing necessary to obtain the prediction  ${\boldsymbol{\mathsf{S}}}_{{\boldsymbol{\mathsf{R}}}_{\nu _t}}$ by means of
 ${\boldsymbol{\mathsf{R}}}$, such that
 ${\boldsymbol{\mathsf{S}}}_{{\boldsymbol{\mathsf{R}}}_{\nu _t}} = {\boldsymbol{\mathsf{R}}}{\boldsymbol{\mathsf{P}}}_{\nu _t}{\boldsymbol{\mathsf{R}}}^H$, can be computed as
 \begin{equation} {\boldsymbol{\mathsf{P}}}_{\nu_t} = {\boldsymbol{\mathsf{L}}} {\boldsymbol{\mathsf{S}}}_{{\boldsymbol{\mathsf{R}}}_{\nu_t}} {\boldsymbol{\mathsf{L}}}^{H}, \end{equation}
which quantifies how the eddy-viscosity approach models  ${\boldsymbol{\mathsf{P}}}$. The effects of the modelling with
 ${\boldsymbol{\mathsf{P}}} = \gamma _{\nu } {\boldsymbol{\mathsf{I}}}$, of the eddy-viscosity approach with
 ${\boldsymbol{\mathsf{P}}} = {\boldsymbol{\mathsf{P}}}_{\nu _t}$, are compared with the
 ${\boldsymbol{\mathsf{P}}}$ computed from instantaneous realizations of
 $\skew5\hat {{\boldsymbol {f}}}$ via the coefficients
 $b_i$ in (2.9).
The normalization scalars  $\gamma _{\nu }$ and
 $\gamma _{\nu _t}$ are function of the wavenumbers
 $\alpha$,
 $\beta$ and the angular frequency
 $\omega$. They are computed here from the PSDs as
 \begin{gather} \gamma_{\nu}(\alpha,\beta,\omega) = \frac{|| \mathrm{diag}({\boldsymbol{\mathsf{S}}}) ||_{\infty}} {|| \mathrm{diag}({\boldsymbol{\mathsf{R}}}_{\nu} {\boldsymbol{\mathsf{R}}}^H_{\nu}) ||_{\infty}}, \end{gather}
 \begin{gather}\gamma_{\nu_t}(\alpha,\beta,\omega) = \frac{|| \mathrm{diag}({\boldsymbol{\mathsf{S}}}) ||_{\infty}} {|| \mathrm{diag}({\boldsymbol{\mathsf{R}}}_{\nu_t}{\boldsymbol{\mathsf{R}}}^H_{\nu_t}) ||_{\infty}}, \end{gather}
and represent a rescaling factor to compensate for the lack of knowledge on the amplitude of the modelled forcing term such that the responses match the DNS  $\mathrm {diag}({\boldsymbol{\mathsf{S}}})$ in the
 $\infty$-norm. The scalars also give an indication of the offset of the prediction of the amplitude; in fact, if the modelled forcing were to coincide with that computed from the DNS data,
 $\gamma _{\nu } = 1$ or
 $\gamma _{\nu _t}=1$. For the sake of readability, from now on the explicit dependency of the scalars
 $\gamma _{\nu }$,
 $\gamma _{\nu _t}$ on
 $\alpha$,
 $\beta$,
 $\omega$ is dropped. The
 $\infty$-norm of a vector
 $\boldsymbol {g}$ is intended as
 $|| \boldsymbol {g} ||_{\infty } = \max _i |g_i|$ with
 $i$ the
 $i$th term of the vector.
3. Direct numerical simulations
The flow cases analysed are at  $Re_{\tau } = 179$ and
 $Re_{\tau } = 543$ with the box details presented in table 1. The mean velocity profile and the root-mean-square (rms) of the three velocity components are presented in figure 1, where it is shown that the profiles are in agreement with the results of del Álamo & Jiménez (Reference del Álamo and Jiménez2003). The CSD are computed with Welch's method (Welch Reference Welch1967), as in Towne et al. (Reference Towne, Schmidt and Colonius2018) or Pintelon & Schoukens (Reference Pintelon and Schoukens2012). Note that the input–output relationship is based on the windowed data. The presence of the window, which is a function of time, needs to be accounted for in the time derivative. Consequently, the input–output relationship in (2.2) is not valid (Martini et al. Reference Martini, Cavalieri, Jordan and Lesshafft2019). A compensation term of the form
 $-\hat {\boldsymbol {q}}\,\textrm {d}{W}(t)/\textrm {d}t$, with
 $W(t)$ the Hann window, is added to the forcing in order to preserve the identity in (2.2). The same procedure investigated in Nogueira et al. (Reference Nogueira, Morra, Martini, Cavalieri and Henningson2021) is followed here. More details can be found in appendix C.
Reynolds number, box dimensions and details about the resolution used in the DNS.

Comparison of mean velocity  $U^+$ and rms values from DNS data (symbols) and the results presented in del Álamo & Jiménez (Reference del Álamo and Jiménez2003) (lines). (a) Mean velocity
 $U^+$ in inner units; black is
 $Re_{\tau} = 179$, red is
 $Re_{\tau} = 543$; (b)
 $u_{rms}^+$,
 $v_{rms}^+$,
 $w_{rms}^+$ in inner units for
 $Re_{\tau }=179$; black is
 $u_{rms}^+$, red is
 $v_{rms}^+$, blue is
 $w_{rms}^+$; (c)
 $u_{rms}^+$,
 $v_{rms}^+$,
 $w_{rms}^+$ in inner units for
 $Re_{\tau }=543$; black is
 $u_{rms}^+$, red is
 $v_{rms}^+$, blue is
 $w_{rms}^+$.

3.1. Computation of CSDs:  $Re_{\tau } = 179$

The focus is on dominant structures of streamwise velocity in the buffer layer and at  $y=0.5$. Therefore, the corresponding wavenumbers are chosen by inspecting the premultiplied streamwise kinetic energy spectra
 $\alpha \beta {\boldsymbol {e}}^{kin}_{uu}$ at
 $y^+ = 15$ and
 $y = 0.5$, shown in figure 2. The maxima of the premultiplied spectral densities are at
 $(\lambda _x^+,\lambda _z^+) = (1130,113)$ for the near-wall structures and
 $(\lambda _x,\lambda _z) = (4.19,1.26)$ for the large-scale structures; where
 $\lambda _x$ and
 $\lambda _z$ are streamwise and spanwise wavelengths normalized by the outer scale
 $h$, and the
 $^+$ superscript is used when quantities are normalized by the viscous scale. These wavenumbers represent energetically significant self-sustaining dynamics of the near-wall and large-scale motions. Figures 3(a) and 3(b) show the PSD of the streamwise velocity fluctuation
 ${\boldsymbol {s}}_{uu}$ for the near-wall structures
 $(\lambda _x^+,\lambda _z^+) = (1130,113)$ (figure 3a) and the large-scale structures
 $(\lambda _x,\lambda _z) = (4.19,1.26)$ (figure 3b). The near-wall structures have a peak at
 $y^+ \approx 15$ with
 $\omega _{max}^+ = 0.065$ that corresponds to a time in viscous scale
 $\lambda _t^+ \approx 100$, whereas the large scales have a peak around
 $y= 0.35$ with
 $\omega _{max} = 1.05$. These peaks correspond to a wave speed
 $c^+_{max}\approx 12$ for the near-wall structures and
 $c^+_{max}\approx 16$ for the large-scale structures; the peaks are located in the region where the mean velocity equals the wave speed
 $U^+ = c^+$.
Premultiplied streamwise energy spectra  $\alpha \beta {\boldsymbol {e}}^{kin}_{uu}$, with
 $Re_{\tau } = 179$: (a)
 $y^+ = 15$ plane, spectra in inner units; (b)
 $y = 0.5$ plane, spectra in outer units.

Streamwise velocity PSDs  ${\boldsymbol {s}}_{uu}$ and
 ${\boldsymbol {p}}_{uu}$ versus phase speed
 $c^+=\omega ^+/\alpha ^+$, with
 $Re_{\tau } = 179$. Dashed black line, mean velocity
 $U^+$ in wall units; (a)
 ${\boldsymbol {s}}_{uu}$, near-wall structures,
 $(\lambda _x^+,\lambda _z^+) = (1130,113)$; (b)
 ${\boldsymbol {s}}_{uu}$, large-scale structures,
 $(\lambda _x,\lambda _z) = (4.19,1.26)$; (c)
 ${\boldsymbol {p}}_{uu}$, near-wall structures,
 $(\lambda _x^+,\lambda _z^+) = (1130,113)$; (d)
 ${\boldsymbol {p}}_{uu}$, large-scale structures,
 $(\lambda _x,\lambda _z) = (4.19,1.26)$.

Figures 3(c) and 3(d) show the PSD of the streamwise forcing  ${\boldsymbol {p}}_{uu}$ for the same near-wall and large-scale structures. Both the forcing terms have the peak at the
 $\omega _{max}$ (or
 $c^+_{max}$) of the corresponding
 ${\boldsymbol{\mathsf{S}}}_{11}$. Moreover, it is notable that both the near-wall and the large-scale structures are forced by a near-wall forcing. This phenomenon can be appreciated also in figure 4, where the forcing
 ${\boldsymbol{\mathsf{P}}}$ computed from the DNS data is used to predict
 ${\boldsymbol{\mathsf{S}}} = {\boldsymbol{\mathsf{R}}}{\boldsymbol{\mathsf{P}}}{\boldsymbol{\mathsf{R}}}^H$. The fact that the curves and the symbols in figures 4(a) and 4(b) are on top of each other is evidence of the accuracy of the computed
 ${\boldsymbol{\mathsf{P}}}$. Figures 4(c) and 4(d) show both the forcing
 ${\boldsymbol{\mathsf{P}}}$ based on the nonlinear terms and its solenoidal part. The streamwise component is nearly unchanged, whereas the wall-parallel components are different. In particular, the amplitude of the wall-parallel components of the solenoidal part of the forcing is lower than it is for the total forcing and the solenoidal forcing is non-zero on the wall, but it is parallel to it.
PSD, with  $Re_{\tau } = 179$: (a,b) symbols,
 ${\boldsymbol{\mathsf{S}}} = {\boldsymbol{\mathsf{R}}}{\boldsymbol{\mathsf{P}}}{\boldsymbol{\mathsf{R}}}^H$, output
 ${\boldsymbol{\mathsf{S}}}$ with
 ${\boldsymbol{\mathsf{P}}}$ from DNS; lines, output
 ${\boldsymbol{\mathsf{S}}}$ from DNS; triangles (black), streamwise component; squares (red), wall-normal component; circles (blue), spanwise component; (c,d) solid lines,
 ${\boldsymbol{\mathsf{P}}}$ from DNS; dashed lines, solenoidal part of
 ${\boldsymbol{\mathsf{P}}}$; colour legend as in (a,b); (a)
 ${\boldsymbol {s}}_{uu}$,
 ${\boldsymbol {s}}_{vv}$,
 ${\boldsymbol {s}}_{ww}$ near-wall,
 $\omega _{max}^+ = 0.065$ (
 $c^+_{max}\approx 12$); (b)
 ${\boldsymbol {s}}_{uu}$,
 ${\boldsymbol {s}}_{vv}$,
 ${\boldsymbol {s}}_{ww}$ large scale,
 $\omega _{max} = 1.05$ (
 $c^+_{max}\approx 16$); (c)
 ${\boldsymbol {p}}_{uu}$,
 ${\boldsymbol {p}}_{vv}$,
 ${\boldsymbol {p}}_{ww}$ near-wall,
 $\omega _{max}^+ = 0.065$ (
 $c^+_{max}\approx 12$); (d)
 ${\boldsymbol {p}}_{uu}$,
 ${\boldsymbol {p}}_{vv}$,
 ${\boldsymbol {p}}_{ww}$ large scale,
 $\omega _{max} = 1.05$ (
 $c^+_{max}\approx 16$).

3.2. Computation of CSDs: $Re_{\tau } = 543$

Figure 5 shows the premultiplied streamwise kinetic energy spectra  $\alpha \beta {\boldsymbol {e}}^{kin}_{uu}$ at
 $y^+ = 15$ and
 $y=0.5$ for
 $Re_{\tau }=543$. In this case the highest energetic activity is for
 $(\lambda _x^+,\lambda _z^+) = (1137,100)$ for the near-wall structures and
 $(\lambda _x,\lambda _z) = (6.28,1.57)$ for the large-scale structures, so these wavenumbers are chosen for the following analysis.
Figures 6(a) and 6(b) present the PSD of the streamwise velocity fluctuation
 ${\boldsymbol {s}}_{uu}$ for both the near-wall and large-scale structures. The near-wall structures have a peak at
 $\omega _{max} = 0.065$ (
 $\lambda _t^+ \approx 100$) and at
 $y^+ = 15$, whereas large-scale structures have a peak at
 $\omega _{max} = 0.65$ and
 $y = 0.45$. These peaks correspond to a wave speed
 $c^+_{max}\approx 12$ for the near-wall structures and
 $c^+_{max}\approx 18$ for the large-scale structures; the peaks are located in the region where the mean velocity equals the wave speed
 $U^+ = c^+$. An appreciable amount of scale separation is present for this Reynolds number. Moreover, the large-scale structure has a local maximum at
 $y^+=12$, which disappears when frequencies or wavenumbers are aggregated because of its low amplitude. A similar peak emerges also for the turbulent channel flow at
 $Re_{\tau }=1007$ in Morra et al. (Reference Morra, Semeraro, Henningson and Cossu2019), where the frequency and wavenumber separation is taken as in this paper. It is shown in § 4.1 that this peak is generated by the streamwise component of the nonlinear forcing.
Premultiplied streamwise energy spectra  $\alpha \beta {\boldsymbol {e}}^{kin}_{uu}$, with
 $Re_{\tau } = 543$: (a)
 $y^+ = 15$ plane, spectra in inner units; (b)
 $y = 0.5$ plane, spectra in outer units.

Streamwise velocity PSDs  ${\boldsymbol {s}}_{uu}$ and
 ${\boldsymbol {p}}_{uu}$ versus phase speed
 $c^+=\omega ^+/\alpha ^+$, with
 $Re_{\tau } = 543$. Dashed black line: mean velocity
 $U^+$ in wall units; (a)
 ${\boldsymbol {s}}_{uu}$, near-wall structures,
 $(\lambda _x^+,\lambda _z^+) = (1137,100)$; (b)
 ${\boldsymbol {s}}_{uu}$, large-scale structures,
 $(\lambda _x,\lambda _z) = (6.28,1.57)$; (c)
 ${\boldsymbol {p}}_{uu}$, near-wall structures,
 $(\lambda _x^+,\lambda _z^+) = (1137,100)$; (d)
 ${\boldsymbol {p}}_{uu}$, large-scale structures,
 $(\lambda _x,\lambda _z) = (6.28,1.57)$.

Figures 6(c) and 6(d) present the PSD of the streamwise forcing  ${\boldsymbol {p}}_{uu}$ for both near-wall and large-scale structures. The peaks of the forcing of both types of structures are localized in the inner layer. The near-wall structures show a peak at
 $\omega _{max}^+ = 0.065$ (
 $\lambda _t^+ \approx 100$) and
 $y^+ = 15$, whereas the large-scale structures show a peak at
 $\omega _{max} = 0.65$ and
 $y^+ = 6$. The input
 ${\boldsymbol{\mathsf{P}}}$ and the output
 ${\boldsymbol{\mathsf{S}}}$ show a peak at the same
 $\omega$. The shape of all the three components of
 ${\boldsymbol{\mathsf{P}}}$ and
 ${\boldsymbol{\mathsf{S}}}$ at the respective
 $\omega _{max}$ is shown in figure 7, where also the relationship
 ${\boldsymbol{\mathsf{S}}} = {\boldsymbol{\mathsf{R}}}{\boldsymbol{\mathsf{P}}}{\boldsymbol{\mathsf{R}}}^H$ (the symbols in figures 7a and 7b) is presented to demonstrate the accuracy of the computed input
 ${\boldsymbol{\mathsf{P}}}$. Figures 7(c) and 7(d) show the input
 ${\boldsymbol{\mathsf{P}}}$. The near-wall structures present a peak of the streamwise component at
 $y^+ = 17$ and at
 $y^+ = 20$ for the wall-normal and the spanwise components. The large-scale structures have a peak in
 ${\boldsymbol{\mathsf{P}}}$ at
 $y^+ = 6$ for the streamwise component, at
 $y^+ = 12$ for the wall-normal component, and at
 $y^+ = 9$ for the spanwise component. However, in addition to this near-wall peak, the forcing of large-scale structures is spatially extended throughout the channel. It is demonstrated in § 4.3 that it is the spatial extension of the streamwise component of this forcing which is responsible for the bulk of the response, whereas the near-wall peak solely accounts for the near-wall local maximum in the response. The solenoidal part of the input is also presented in figures 7(c) and 7(d) (red lines without symbols). The streamwise component is nearly unchanged, whereas the transverse components are different, as occurs for
 $Re_{\tau } = 179$. Moreover, the amplitude of the wall-parallel components of the solenoidal part of the forcing is lower than it is for the total forcing and the solenoidal forcing is non-zero on the wall, i.e. there is a component parallel to the wall. The occurrence of a very localized peak for the streamwise component of the Reynolds shear stresses is also documented in Kawata & Alfredsson (Reference Kawata and Alfredsson2018) and Cho, Hwang & Choi (Reference Cho, Hwang and Choi2018).
PSD, with  $Re_{\tau } = 543$: (a,b) symbols,
 ${\boldsymbol{\mathsf{S}}} = {\boldsymbol{\mathsf{R}}}{\boldsymbol{\mathsf{P}}}{\boldsymbol{\mathsf{R}}}^H$, output
 ${\boldsymbol{\mathsf{S}}}$ with
 ${\boldsymbol{\mathsf{P}}}$ from DNS; lines, output
 ${\boldsymbol{\mathsf{S}}}$ from DNS; triangles (black), streamwise component; squares (red), wall-normal component; circles (blue), spanwise component; (c,d) solid lines,
 ${\boldsymbol{\mathsf{P}}}$ from DNS; dashed lines, solenoidal part of
 ${\boldsymbol{\mathsf{P}}}$; colour legend as in (a,b); (a)
 ${\boldsymbol {s}}_{uu}$,
 ${\boldsymbol {s}}_{vv}$,
 ${\boldsymbol {s}}_{ww}$ near-wall,
 $\omega _{max}^+ = 0.065$
 $(\lambda _t^+\approx 100, c^+_{max}\approx 12)$; (b)
 ${\boldsymbol {s}}_{uu}$,
 ${\boldsymbol {s}}_{vv}$,
 ${\boldsymbol {s}}_{ww}$ large scale,
 $\omega _{max} = 0.65$
 $(c^+_{max}\approx 18)$; (c)
 ${\boldsymbol {p}}_{uu}$,
 ${\boldsymbol {p}}_{vv}$,
 ${\boldsymbol {p}}_{ww}$ near-wall,
 $\omega _{max}^+ = 0.065$
 $(\lambda _t^+\approx 100, c^+_{max}\approx 12)$; (d)
 ${\boldsymbol {p}}_{uu}$,
 ${\boldsymbol {p}}_{vv}$,
 ${\boldsymbol {p}}_{ww}$ large scale,
 $\omega _{max} = 0.65$
 $(c^+_{max}\approx 18)$ (inset: enlarged view of the near-wall region, spanwise component only).

4. Input–output analysis
4.1. Effect of the sub-blocks of the input on the output
Here, the effects of the sub-blocks of the input  ${\boldsymbol{\mathsf{P}}}$ on the output
 ${\boldsymbol{\mathsf{S}}}$ are analysed. As
 ${\boldsymbol{\mathsf{P}}}$ is the CSD matrix of the forcing vector
 $\skew5\hat {{\boldsymbol {f}}}$, it can be split into nine sub-blocks of equal dimensions. Each sub-block is a CSD. The three sub-blocks on the diagonal are the CSD of the streamwise, wall-normal and spanwise components alone, whereas the six off-diagonal sub-blocks are the CSD of pairs of different components. As the input–output relationship is described in terms of CSD, quantifying the effect of each sub-block on the output
 ${\boldsymbol{\mathsf{S}}}$ amounts to a component-wise analysis, which here provides insights into the nonlinear feedback mechanism of the self-sustained processes of wall-bounded turbulence. Moreover, the influence of the off-diagonal terms on the output is of interest for modelling the nonlinear forcing because some sub-blocks may be negligible.
The effects of the sub-blocks of the input  ${\boldsymbol{\mathsf{P}}}$ on the output
 ${\boldsymbol{\mathsf{S}}}$ can be analysed by expanding
 ${\boldsymbol{\mathsf{P}}}$ into a sum of nine matrices as
 \begin{equation} {\boldsymbol{\mathsf{P}}} = {\boldsymbol{\mathsf{P}}}_{11} + {\boldsymbol{\mathsf{P}}}_{12} + {\boldsymbol{\mathsf{P}}}_{13} + {\boldsymbol{\mathsf{P}}}_{21} + {\boldsymbol{\mathsf{P}}}_{22} + {\boldsymbol{\mathsf{P}}}_{23} + {\boldsymbol{\mathsf{P}}}_{31} + {\boldsymbol{\mathsf{P}}}_{32} + {\boldsymbol{\mathsf{P}}}_{33}, \end{equation}
with the  ${\boldsymbol{\mathsf{P}}}_{ij}$ matrices having only the
 $ij$th sub-block different from zero. The
 ${\boldsymbol{\mathsf{P}}}_{ij}$ matrices that contain the CSD of the streamwise, wall-normal and spanwise components alone are
 ${\boldsymbol{\mathsf{P}}}_{11}$,
 ${\boldsymbol{\mathsf{P}}}_{22}$ and
 ${\boldsymbol{\mathsf{P}}}_{33}$. The matrices
 ${\boldsymbol{\mathsf{P}}}_{ij}$ with
 $i \neq j$ have the only non-zero sub-block that correspond to the CSD between pairs of different components. In other words,
 ${\boldsymbol{\mathsf{P}}}_{ij}$ is
 \begin{equation} {\boldsymbol{\mathsf{P}}}_{ij} = \lim_{T \to \infty} \frac{ \mathbb{E}\left[ \left(\dfrac{1}{2{\rm \pi}} \displaystyle\int_{-T}^{T}\hat{{\boldsymbol{f}}}_{i}(t) \,\textrm{e}^{-\textrm{i}\omega t} \, \mathrm{d}t \right)\left(\dfrac{1}{2{\rm \pi}}\displaystyle\int_{-T}^{T}\hat{{\boldsymbol{f}}}_{j}(t)^{H} \,\textrm{e}^{\textrm{i}\omega t}\, \mathrm{d}t \right) \right]}{2T}, \end{equation}
with  $\,\skew5\hat {{\boldsymbol {f}}}_i$ a
 $3N_y\times 1$ vector made solely of the
 $i$th
 $N_y\times 1$ component of the
 $3N_y\times 1$ vector
 $\skew5\hat {{\boldsymbol {f}}}$ and the other components set to zero; with
 $i=1,2,3$ corresponding to the streamwise, wall-normal and parallel directions. Here, the focus is on the portion of the output that corresponds to each sub-block,
 ${\boldsymbol{\mathsf{R}}}{\boldsymbol{\mathsf{P}}}_{ij}{\boldsymbol{\mathsf{R}}}^H$. Note that the output
 ${\boldsymbol{\mathsf{R}}} {\boldsymbol{\mathsf{P}}}_{ij}{\boldsymbol{\mathsf{R}}}^{H}$ where
 $i\neq j$ implies the output given by
 ${\boldsymbol{\mathsf{R}}} ({\boldsymbol{\mathsf{P}}}_{ij} + {\boldsymbol{\mathsf{P}}}_{ji}){\boldsymbol{\mathsf{R}}}^{H}$ because
 ${\boldsymbol{\mathsf{P}}}$ is Hermitian.
For the case with  $Re_{\tau }=179$ the results are presented in figure 8 for
 ${\boldsymbol {s}}_{uu}$. For both near-wall and large-scale structures the terms with
 $i \neq j$ give a negative contribution. In particular, for the large-scale structures in figure 8(b) only the terms related to the spanwise direction (
 $\,j=3$) provide a negative contribution, whereas for the near-wall structures all the terms with
 $i\neq j$ give a negative contribution. Moreover, even though the magnitude of the streamwise component of the solenoidal part of the forcing is around one order of magnitude higher than the wall-normal and spanwise components, the forcing cannot be approximated by the streamwise component only. In fact, the amplitudes of the outputs associated with the wall-normal and spanwise components have the same order of magnitude of the output associated with the streamwise component. This can be attributed to the lift-up effect, which greatly enhances the efficiency of forcing in the wall-normal or spanwise directions, leading to streamwise vortices that, in turn, form amplified streaks (Moffatt Reference Moffatt, Yaglom and Tatarsky1967; Ellingsen & Palm Reference Ellingsen and Palm1975; Landahl Reference Landahl1980; Hwang & Cossu Reference Hwang and Cossu2010c, Reference Hwang and Cossu2011; Brandt Reference Brandt2014). It is seen here that the wall-normal and spanwise components of the forcing, associated with lift-up, lead to high-amplitude outputs when considered in isolation (see the curves associated with
 ${\boldsymbol{\mathsf{P}}}_{22}$ and
 ${\boldsymbol{\mathsf{P}}}_{33}$ in figures 8a and 8b), but a complex phase relationship between the three forcing components leads to cancellations in such a way that the DNS output is of lower magnitude than what is predicted by considering a single forcing component. This is a first indication of relevance of forcing colour to the channel dynamics, as incoherent forcing components would lead to output PSDs that could simply be summed to form the full PSD. The high magnitude of cross terms shows that this is not the case: forcing components are coherent between them, and neglecting such coherence would lead to appreciable errors in the prediction of the output. Similar effects were observed for a minimal Couette flow unit by Nogueira et al. (Reference Nogueira, Morra, Martini, Cavalieri and Henningson2021).
Response  ${\boldsymbol{\mathsf{S}}} = {\boldsymbol{\mathsf{R}}}{\boldsymbol{\mathsf{P}}}_{ij}{\boldsymbol{\mathsf{R}}}^H$ from sub-blocks of
 ${\boldsymbol{\mathsf{P}}}_{ij}$, with
 $Re_{\tau } = 179$: solid lines, response from
 ${\boldsymbol{\mathsf{P}}}_{1j}$ (sub-blocks related to the streamwise component); dashed lines, response from
 ${\boldsymbol{\mathsf{P}}}_{ij}$ with
 $i\neq 1$; (a)
 ${\boldsymbol {s}}_{uu}$ near-wall,
 $\omega _{max}^+ = 0.065$; (b)
 ${\boldsymbol {s}}_{uu}$ large scale,
 $\omega _{max} = 1.05$.

For the case with  $Re_{\tau }=543$ the contribution of the terms
 ${\boldsymbol{\mathsf{P}}}_{ij}$ on the output
 ${\boldsymbol{\mathsf{S}}}$ are presented in figure 9. As occurs for
 $Re_{\tau } = 179$, the off-diagonal terms (
 $i\neq j$) provide a negative contribution to the output, indicating that coherence between the forcing components, or forcing colour, is an important feature of the dynamics, as discussed previously. Similar to
 $Re_{\tau }=179$, the forcing cannot be approximated by the streamwise component only, even though its peak amplitude is one order of magnitude higher than it is for the wall-normal and the spanwise components. In fact, as shown in figures 9(a) and 9(b), the amplitudes of the outputs associated with the wall-normal and spanwise components of the forcing are larger than the output associated with the streamwise component, owing to the higher efficiency associated with the lift-up effect. Moreover, at
 $Re_{\tau } = 543$ the large-scale structures show a low-amplitude near-wall peak in the PSD of the streamwise velocity component
 ${\boldsymbol {s}}_{uu}$ at
 $y^+ =12$. This low-amplitude near-wall peak is demonstrated to be generated by the streamwise component of the forcing
 ${\boldsymbol{\mathsf{P}}}$. In fact, in figure 9(c) it is clear that it is only the components of
 ${\boldsymbol{\mathsf{P}}}$ associated with the streamwise forcing (
 $i = 1$) that are responsible for the peak around
 $y^+ = 12$ (compare the solid and the dashed lines in figure 9c). Thus, the low-amplitude near-wall peak at
 $y^+=12$ in
 ${\boldsymbol {s}}_{uu}$ must be related to the near-wall peak at
 $y^+=6$ in
 ${\boldsymbol {p}}_{uu}$.
Response  ${\boldsymbol{\mathsf{S}}} = {\boldsymbol{\mathsf{R}}}{\boldsymbol{\mathsf{P}}}_{ij}{\boldsymbol{\mathsf{R}}}^H$ from sub-blocks
 ${\boldsymbol{\mathsf{P}}}_{ij}$, with
 $Re_{\tau } = 543$: solid lines, response from
 ${\boldsymbol{\mathsf{P}}}_{1j}$ (sub-blocks related to the streamwise component); dashed lines, response from
 ${\boldsymbol{\mathsf{P}}}_{ij}$ with
 $i\neq 1$; (a)
 ${\boldsymbol {s}}_{uu}$ near-wall,
 $\omega _{max}^+ = 0.065$
 $(\lambda _t^+\approx 100)$; (b)
 ${\boldsymbol {s}}_{uu}$ large-scale,
 $\omega _{max} = 1.05$; (c) zoom of (b) in the near-wall region (note that
 ${\boldsymbol{\mathsf{P}}}_{1j}$ are the only components contributing to the near-wall peak).

4.2. Low-rank approximation
Effort has been made to reconstruct the input  ${\boldsymbol{\mathsf{P}}}$ from sensor measurements with system identification techniques (Jovanovic & Bamieh Reference Jovanovic and Bamieh2001; Zare et al. Reference Zare, Jovanović and Georgiou2017; Illingworth et al. Reference Illingworth, Monty and Marusic2018; Towne et al. Reference Towne, Lozano-Durán and Yang2020). Here, a low-rank approximation of
 ${\boldsymbol{\mathsf{P}}}$, referred to as
 ${\boldsymbol{\mathsf{P}}}_{lr}$, is computed a posteriori by retaining the first two SPOD modes of
 ${\boldsymbol{\mathsf{P}}}$, so that
 \begin{equation} {\boldsymbol{\mathsf{P}}}_{lr} = \eta_1 {\boldsymbol{\zeta}}_{1}{\boldsymbol{\zeta}}^{H}_{1} + \eta_2 {\boldsymbol{\zeta}}_{2}{\boldsymbol{\zeta}}^{H}_{2}. \end{equation}
The second SPOD mode is also included because in a channel flow the modes are paired because of the symmetry of the flow case. The approximated output  ${\boldsymbol{\mathsf{S}}}_{{\boldsymbol{\mathsf{P}}}_{lr}}$ is computed with
 ${\boldsymbol{\mathsf{R}}}$ and compared with the output
 ${\boldsymbol{\mathsf{S}}}$ from DNS data in figure 10. It is remarkable that considering only the first two SPOD modes of
 ${\boldsymbol{\mathsf{P}}}$ leads to a recovery of most of the output in all the cases presented. It can be remarked that for the large-scale structure of the flow at
 $Re_{\tau }=543$ even the local maximum at
 $y^+=12$ is mostly retrieved. This shows that the forcing is highly structured and coherent, as already suggested by the results in § 3, and its dominant structure, which is represented by the first two symmetrical and anti-symmetrical SPOD modes, is responsible for the bulk of the flow response for both near-wall and large-scale motions in both
 $Re_{\tau } = 179$ and
 $Re_{\tau } = 543$. This result suggests a direction for the modelling of the structures considered here: the identification of the nonlinear processes that lead to the observed coherent forcing may form a foundation for reduced-order models of self-sustaining mechanisms in turbulent channel flows, similarly to the developments of Hamilton, Kim & Waleffe (Reference Hamilton, Kim and Waleffe1995) and Farrell & Ioannou (Reference Farrell and Ioannou2012) for low Reynolds turbulent Couette flow in minimal boxes.
PSD of the velocity fluctuations from the low-rank approximation: solid lines,  ${\boldsymbol{\mathsf{S}}}$ from DNS data; dashed lines,
 ${\boldsymbol{\mathsf{S}}}_{lr}$ from low-rank approximation of
 ${\boldsymbol{\mathsf{P}}}_{lr}$; black, streamwise component; red, wall-normal component; blue, spanwise component; (a)
 $Re_{\tau } = 179$, small scale; (b)
 $Re_{\tau } = 179$, large scale; (c)
 $Re_{\tau } = 543$, small scale; (d)
 $Re_{\tau } = 543$; large scale.

Assessing the low-rank behaviour of the forcing is helpful for those techniques that account for the forcing through system identification methods, in a similar fashion to Jovanovic & Bamieh (Reference Jovanovic and Bamieh2001), Zare et al. (Reference Zare, Jovanović and Georgiou2017) or Illingworth et al. (Reference Illingworth, Monty and Marusic2018). The low-rank behaviour of the forcing can be a benefit because identification techniques may lose accuracy when the number of unknown parameters increases (Hjalmarsson & Mårtensson Reference Hjalmarsson and Mårtensson2007). In this case identifying the first eigenvector of the cross-power spectral density  ${\boldsymbol{\mathsf{P}}}$ instead of the whole
 ${\boldsymbol{\mathsf{P}}}$ reduces the number of unknowns from
 $3N_y(3N_y+1)/2$ to
 $3N_y$ (
 $N_y$ is the number of discrete point in the wall-normal direction). Thus, in this case the number of unknowns would be reduced by two orders of magnitude. The second SPOD mode can be retrieved later by exploiting the symmetry of the flow case.
As most of the output can be obtained from the presented low-rank approximation of the input  ${\boldsymbol{\mathsf{P}}}$, the field given by the first SPOD mode
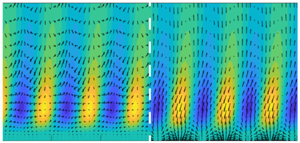
 ${\boldsymbol {\zeta }}_{1}$ is of interest, so it is presented in figure 11 together with its solenoidal part. The second SPOD mode
 ${\boldsymbol {\zeta }}_{2}$ is not presented because the modes are symmetric and anti-symmetric with respect to the center line of the channel and their behaviour on one wall is sufficient. Even though the mode
 ${\boldsymbol {\zeta }}_1$ does not clearly appear to force the lift-up mechanism, its solenoidal part, which is the only one responsible for the velocity field, is actually accelerating the flow in the directions and areas typical for the occurrence of the lift-up mechanism. In fact, the solenoidal field takes the shape of oblique vortices that appear to push near-wall fluid particles away from the wall and further fluid particles towards the wall. This occurs for both
 $Re_{\tau }=179$ and
 $Re_{\tau }= 543$, and for both large- and small-scale structures. Thus, it appears that the feedback of the nonlinear terms arising from the fluctuations of the velocity field presents a significant vortical structure forcing the lift-up mechanism. It is also notable that the magnitude of the streamwise component of the solenoidal part of the forcing is higher than it is for the wall-normal and the spanwise components. This behaviour is opposite to that predicted by the linear optimal forcing, which coincides with the first right-singular vector of the resolvent (Hwang & Cossu Reference Hwang and Cossu2010b).
First SPOD mode of  ${\boldsymbol{\mathsf{P}}}$,
 ${\boldsymbol {\zeta }}_1$: (a–d)
 $Re_{\tau } = 179$; (e–h)
 $Re_{\tau } = 543$; (a,b,e,f) small scales; (c,d,g,h) large scale; (a,c,e,g) full
 ${\boldsymbol {\zeta }}_1$; (b,d,f,h) solenoidal part of
 ${\boldsymbol {\zeta }}_1$. Contours: streamwise component of
 ${\boldsymbol {\zeta }}_1$. Vectors: spanwise and wall-normal components of
 ${\boldsymbol {\zeta }}_1$.

Figure 11 suggests that the streamwise component counteracts the effect of the wall-normal and spanwise components, as appears in figures 8 and 9 and is discussed in § 4.1. In figure 11 it can be observed that in regions where the wall-normal and spanwise components of the forcing would generate a negative velocity fluctuation, the streamwise component pushes the flow in the positive direction, and vice versa, in a destructive interference. This is in accordance with the fact that the energy amplification predicted with an approach that focuses only on the linear operator is much higher than that observed in DNS of the nonlinear N–S. In fact, focusing solely on the linear operator implies assuming that the forcing is mainly the linear optimal forcing, or the first right-singular vector of  ${\boldsymbol{\mathsf{R}}}$, whose streamwise component has a negligible magnitude with respect to the other two (Hwang & Cossu Reference Hwang and Cossu2010b). In other words, focusing the analysis of a turbulent channel flow solely on the non-normal linear operator can be definitely misleading, as pointed out already by Waleffe (Reference Waleffe1995). Nevertheless, because expanding the N–S system in a reference state and its relative fluctuations is entirely general, as already clarified by Henningson (Reference Henningson1996), rewriting the system in terms of a (non-normal) linear operator without dropping the nonlinear forcing terms in the analysis can be helpful to shed light on the ‘recycling’ of the amplified outputs in the input from the nonlinear terms.
Effect of the inner layer on the large-scale motion of  $Re_{\tau }=543$. PSD: symbols,
 ${\boldsymbol{\mathsf{S}}} = {\boldsymbol{\mathsf{R}}}{\boldsymbol{\mathsf{P}}}{\boldsymbol{\mathsf{R}}}^H$; triangle, streamwise component; circle, spanwise component; square, wall-normal component; black lines. DNS: red lines,
 ${\boldsymbol{\mathsf{S}}}_{h} = {\boldsymbol{\mathsf{R}}}{\boldsymbol{\mathsf{P}}}_{h}{\boldsymbol{\mathsf{R}}}^H$ (a, outer layer),
 ${\boldsymbol{\mathsf{S}}}_{y^+} = {\boldsymbol{\mathsf{R}}}{\boldsymbol{\mathsf{P}}}_{y^+}{\boldsymbol{\mathsf{R}}}^H$ (b, inner layer); solidline, streamwise component; dotted line, spanwise component; dashed line, wall-normal component; grey area, interval of
 $y$ where the
 ${\boldsymbol{\mathsf{P}}}$ is not zero.

4.3. Influence of the near-wall forcing on the large-scale output: $Re_{\tau } = 543$

Flores & Jiménez (Reference Flores and Jiménez2006) and Flores, Jiménez & del Álamo (Reference Flores, Jiménez and del Álamo2007) showed with one-point statistics that changes in the wall boundary conditions in the DNS of a turbulent channel flow, which completely alter the near-wall statistics, did not influence the statistics in the outer layer. Hwang & Cossu (Reference Hwang and Cossu2010c) demonstrated, with the aid of large-eddy simulations, that large-scale motions are still present in a turbulent channel flow even when the smaller scales typical of near-wall motions are filtered out; the filtering was possible by adjusting the constant of the Smagorinsky eddy-viscosity model employed. Flores & Jimenez (Reference Flores and Jimenez2010) and Hwang & Cossu (Reference Hwang and Cossu2011) further confirmed that the dynamics of large-scale structures, although affected by smaller near-wall eddies, is mostly related to processes with similar length scales. These results suggest that the response  ${\boldsymbol{\mathsf{S}}}$ is weakly influenced by the structure of the input
 ${\boldsymbol{\mathsf{P}}}$ near the wall. However, for the large-scale structure
 $(\lambda _x,\lambda _z)=(6.28,1.57)$ at
 $Re_{\tau }=543$ the streamwise component of the nonlinear forcing
 ${\boldsymbol {p}}_{uu}$ presents a high-amplitude absolute maximum at
 $y^+=6$, and in § 4.1 it is shown that
 ${\boldsymbol{\mathsf{P}}}_{11}$ is non-negligible to retrieve the correct response. The analysis in § 4.1 only shows that the low-amplitude peak at
 $y^+=12$ in the streamwise component of the response
 ${\boldsymbol {s}}_{uu}$ is caused solely by
 ${\boldsymbol{\mathsf{P}}}_{11}$, but no conclusion can be drawn on how the near-wall peak in
 ${\boldsymbol{\mathsf{P}}}_{11}$ influences the bulk of the response. However, according to the conclusions of the aforementioned studies and the results in § 4.1 it is reasonable to speculate that the structure of
 ${\boldsymbol{\mathsf{P}}}$ near the wall does not strongly influence the bulk of the response
 ${\boldsymbol{\mathsf{S}}}$.
In order to verify this statement all the points of the input  ${\boldsymbol{\mathsf{P}}}$ from DNS data that are close to the wall, with
 $y^+<30$, are set to zero, a new input
 ${\boldsymbol{\mathsf{P}}}_{h}$ is computed, and the output
 ${\boldsymbol{\mathsf{S}}}_{h} = {\boldsymbol{\mathsf{R}}} {\boldsymbol{\mathsf{P}}}_{h} {\boldsymbol{\mathsf{R}}}^{H}$ is evaluated. The PSD of the resulting output
 ${\boldsymbol{\mathsf{S}}}_{h}$ is presented in figure 12(a), where the symbols represent the original output from the DNS data, the shaded area is the area where the forcing is non-zero and the red lines are the PSDs of the output
 ${\boldsymbol{\mathsf{S}}}_{h}$. The curves of the PSDs of
 ${\boldsymbol{\mathsf{S}}}_{h}$ are almost unaltered when compared with those of
 ${\boldsymbol{\mathsf{S}}}$ for
 $y^+\ge 30$, where the forcing is not set to zero. In the near-wall region
 $y^+<30$, where the forcing is set to zero, the PSDs of
 ${\boldsymbol{\mathsf{S}}}_{h}$ do not match the DNS data, and clearly the peak in the streamwise component is absent. In order to verify the effects of the near-wall portion of the forcing, another forcing
 ${\boldsymbol{\mathsf{P}}}_{y^+}$ is computed by setting to zero the points in
 $y^+\ge 30$, and the output
 ${\boldsymbol{\mathsf{S}}}_{y^+}={\boldsymbol{\mathsf{R}}} {\boldsymbol{\mathsf{P}}}_{y^+}{\boldsymbol{\mathsf{R}}}^H$ is evaluated. The PSD of the output
 ${\boldsymbol{\mathsf{S}}}_{y^+}$ is presented in figure 12(b), where it appears that the near-wall peak in the velocity is present, but the PSDs are not matching the DNS data for
 $y^+\ge 30$. It follows that the low-amplitude peak at
 $y^+=12$ in
 ${\boldsymbol {s}}_{uu}$ of the DNS data must be caused by the near-wall portion of the streamwise forcing
 ${\boldsymbol{\mathsf{P}}}_{11}$, and that the response
 ${\boldsymbol{\mathsf{S}}}$ is not strongly influenced by the structure of the input
 ${\boldsymbol{\mathsf{P}}}$ near the wall.
5. Role of forcing statistics in linear resolvent analyses
Having access to  ${\boldsymbol{\mathsf{P}}}$ allows to quantify its projection onto the right-singular vectors of the resolvent
 ${\boldsymbol{\mathsf{R}}}$, which are the key quantity to assess the accuracy of linear resolvent analyses (Beneddine et al. Reference Beneddine, Sipp, Arnault, Dandois and Lesshafft2016). These projections are quantified here for the first time for the turbulent channel flows presented. The resolvent
 ${\boldsymbol{\mathsf{R}}}$ is decomposed into its left- and right-singular vectors, and the projections of the forcing term onto the right-singular vectors of
 ${\boldsymbol{\mathsf{R}}}$ are computed. These projections are evaluated for the forcing
 ${\boldsymbol{\mathsf{P}}}_{\nu _t}$, modelled with eddy viscosity, and for the forcing
 ${\boldsymbol{\mathsf{P}}}$ from DNS data. The effects of the modelling choice on the predictions are also discussed.
5.1. Forcing uncorrelated in space
The assumption  ${\boldsymbol{\mathsf{P}}} = \gamma _{\nu } {\boldsymbol{\mathsf{I}}}$ leads to the prediction
 ${\boldsymbol{\mathsf{S}}}_{{\boldsymbol{\mathsf{R}}}_{\nu }} = \gamma _{\nu } {\boldsymbol{\mathsf{R}}} {\boldsymbol{\mathsf{R}}}^H$. In this case, the PSD of the output can be written as
 $\mathrm {diag}({\boldsymbol{\mathsf{S}}}_{{\boldsymbol{\mathsf{R}}}_{\nu }}) = \gamma _{\nu } \sum _{i} \sigma _i^2| \boldsymbol {\psi }_i |^2$, which is the sum of the left singular vectors of
 ${\boldsymbol{\mathsf{R}}}$ times the square of the corresponding singular values. As
 $b_i^2 = \mathrm {diag}(\boldsymbol {\phi }_i^H\boldsymbol{\mathsf{W}}{\boldsymbol{\mathsf{P}}}\boldsymbol{\mathsf{W}}\boldsymbol {\phi }_i)$,
 $\mathrm {diag}({\boldsymbol{\mathsf{S}}}_{{\boldsymbol{\mathsf{R}}}_{\nu }}) = \sum _i |\boldsymbol {\psi }_i|^2 a_i^2$ and
 $a_i = \sigma _i b_i$ from (2.9) and (2.10), this modelling corresponds to setting
 $b_i = \gamma _{\nu }$ or
 $a_i = \sigma _i \gamma _{\nu }$. If there are sufficiently large gains
 $\sigma _i$ to neglect the others, the shape of
 $\mathrm {diag}({\boldsymbol{\mathsf{S}}}_{{\boldsymbol{\mathsf{R}}}_{\nu }})$ is mainly given by the
 $\boldsymbol {\psi }_i$ corresponding to such
 $\sigma _i$. It is shown in Morra et al. (Reference Morra, Semeraro, Henningson and Cossu2019) and Pickering et al. (Reference Pickering, Towne, Jordan and Colonius2020) that for turbulent channel flows and for turbulent jets predictions with a diagonal input matrix can lead to significant errors in the output. In Morra et al. (Reference Morra, Semeraro, Henningson and Cossu2019)
 ${\boldsymbol{\mathsf{P}}}$ is not presented, and the conclusions are drawn by comparing
 ${\boldsymbol{\mathsf{S}}}_{{\boldsymbol{\mathsf{R}}}_\nu }$ with
 ${\boldsymbol{\mathsf{S}}}$ from the DNS results. The reason for the mismatch between the prediction
 ${\boldsymbol{\mathsf{S}}}_{{\boldsymbol{\mathsf{R}}}_{\nu }} = \gamma _{\nu } {\boldsymbol{\mathsf{R}}} {\boldsymbol{\mathsf{R}}}^H$ and the DNS results is clear once the nonlinear forcing
 ${\boldsymbol{\mathsf{P}}}$ from the DNS is projected onto the basis of the right-singular vectors
 $\boldsymbol {\phi }_i$, as shown in figure 13.
Singular values  $\sigma _i$ of
 ${\boldsymbol{\mathsf{R}}}$, projection coefficients
 $b_i$, weights
 $a_i=\sigma _i b_i$. The values are rescaled by their value at
 $i=1$ (see table 2): triangle, projection of
 ${\boldsymbol{\mathsf{P}}}$ onto the right-singular vectors
 $\boldsymbol {\phi }_i$ of
 ${\boldsymbol{\mathsf{R}}}$ (
 $b_i$ coefficients); filled symbols, DNS data; empty symbols, eddy-viscosity model; square, singular values
 $\sigma _i$ of
 ${\boldsymbol{\mathsf{R}}}$; circle,
 $a_i = \sigma _i b_i$; filled symbols, DNS data; empty symbols, eddy-viscosity model; (a,c)
 $Re_{\tau } = 179$; (b,d)
 $Re_{\tau } = 543$; (a,b) small scales; (c,d) large scales.

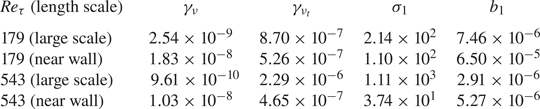
In figure 13 the trends are normalized by their value at the first mode  $i=1$; the reference value for the normalization and the
 $\gamma _{\nu }$ used are summarized in table 2. The resolvent gains
 $\sigma _i$ are plotted as red squares for both near-wall and large-scale structures and for both
 $Re_{\tau }=179$ and
 $Re_{\tau } = 543$. In turbulent channel flows the resolvent modes appear in pairs with nearly identical gains because of the symmetrical or anti-symmetrical behaviour of the flow at the walls. It appears that for all considered cases there is a notable gain separation between the leading pair of gains
 $\sigma _1$ and
 $\sigma _2$ and the subsequent ones. However, there are other two worthwhile observations. First, for both
 $Re_{\tau }=179$ and
 $Re_{\tau }=543$ and for both near-wall and large-scale structures the coefficients
 $b_i$ are such that the forcing has a non-negligible projection onto the right-singular vectors of
 ${\boldsymbol{\mathsf{R}}}$,
 $\boldsymbol {\psi }_i$, which correspond to the
 $\sigma _i$ with lower magnitude. In figure 13 note that the magnitude of
 $b_1$ and
 $b_2$ is lower than it is for all other
 $b_i$ with
 $i>2$, and compare
 $b_i$ with
 $\sigma _i$ for
 $i>2$ (black-filled triangle symbols in figure 13). Second, for both
 $Re_{\tau }=179$ and
 $Re_{\tau }=543$ the average magnitude of this projection onto higher-order right eigenfunctions is more significant for large-scale structures than for small-scale structures. The first observation explains why the assumption
 ${\boldsymbol{\mathsf{P}}} = \gamma _{\nu }{\boldsymbol{\mathsf{I}}}$ can lead to an erroneous prediction
 $\mathrm {diag}({\boldsymbol{\mathsf{S}}}_{{\boldsymbol{\mathsf{R}}}_{\nu }})= \gamma _{\nu } \,\mathrm {diag}({\boldsymbol{\mathsf{R}}} {\boldsymbol{\mathsf{R}}}^H) = \gamma _{\nu } \sum _{i} \sigma _i^2| \boldsymbol {\psi }_i |^2$. The magnitude of the projections of the forcing
 ${\boldsymbol{\mathsf{P}}}$ onto the right-singular vector
 $\boldsymbol {\phi }_i$, which is
 $b_i$, can compensate a small singular value
 $\sigma _i$ and increase the relative weight
 $a_i = \sigma _i b_i$ of a left-singular vector
 $\boldsymbol {\psi }_i$ in the linear combination that leads to the output. The coefficients
 $a_i$ are shown with blue-filled circle symbols in figure 13. The second observation explains why the assumption
 ${\boldsymbol{\mathsf{P}}}=\gamma _{\nu } {\boldsymbol{\mathsf{I}}}$ gives less erroneous predictions
 ${\boldsymbol{\mathsf{S}}}_{{\boldsymbol{\mathsf{R}}}_{\nu }} = \gamma _{\nu } \sum _{i} \sigma _i^2| \boldsymbol {\psi }_i |^2$ for near-wall structures: the magnitude of the projection
 ${\boldsymbol{\mathsf{P}}}$ onto
 $\boldsymbol {\phi }_i$ is such that the trend of the weights
 $a_i$, which multiply the left-singular vector
 $\boldsymbol {\psi }_i$ in the linear combination, is less modified than it is for large-scale structures. This can be seen by comparing figures 13(a) and 13(b) with figures 13(c) and 13(d): for the near-wall structures the trend of the blue-filled circle symbols, which are
 $a_i$, is more similar to the square red symbols, which represent
 $\sigma _i$, than it is for the large-scale structures.
Normalization factors  $\gamma _{\nu }$ and
 $\gamma _{\nu _t}$; first singular value
 $\sigma _1$; first projection coefficient
 $b_1$;
 $Re_{\tau }=179$ and
 $Re_{\tau }=543$. Large-scale and near-wall structures.
PSD. Streamwise component  ${\boldsymbol {s}}_{uu}$: (a,b)
 $Re_{\tau } = 179$; (c,d)
 $Re_{\tau } = 543$; (a,c) small scale; (b,d) large scales. Black line with triangles: DNS data. Red line with squares:
 $\boldsymbol{\mathsf{S}}_\nu = \gamma_{\nu}\boldsymbol{\mathsf{RR}}^H$. Blue line with circles:
 $\boldsymbol{\mathsf{S}}_{\nu_t} = \gamma_{\nu_t}\boldsymbol{\mathsf{R}}_{\nu_t}\boldsymbol{\mathsf{R}}_{\nu_t}^H$.

The discussion about the coefficients  $a_i$,
 $b_i$, and the singular values
 $\sigma _i$ and their effect on the output is consistent with the results shown in figure 14, where the streamwise component of
 ${\boldsymbol{\mathsf{S}}}_{{\boldsymbol{\mathsf{R}}}_{\nu }}$ is presented. In particular, the assumption
 ${\boldsymbol{\mathsf{P}}} = \gamma _{\nu } {\boldsymbol{\mathsf{I}}}$ leads to very localized large-scale structures, which do not resemble the DNS data, whereas the near-wall structures approximate better the shape of the DNS data, as presented by Morra et al. (Reference Morra, Semeraro, Henningson and Cossu2019) for a turbulent channel at
 $Re_{\tau }=1007$. This occurs owing to the discrepancy, which is more pronounced for the large-scale structures than the near-wall structures, between
 $\sigma _i$ and
 $a_i = \sigma _i b_i$. It is noticeable that for both the
 $Re_{\tau }$ presented and for both small-scale and large-scale structures the prediction based on the assumption that the forcing arising from the nonlinear terms is uncorrelated in space is erroneous because the assumption is not verified in a turbulent flow, as the shapes of
 ${\boldsymbol{\mathsf{P}}}$ in figures 3 and 6 show.
5.2. Forcing from the eddy-viscosity model
In eddy-viscosity modelling the nonlinear forcing term is modelled by means of the Boussinesq expression, which states that the unknown Reynolds stresses are proportional to the rate of strain tensor given by the known field through a scalar  $\nu _t$. Here
 $\nu _t$ is the eddy (or turbulent) viscosity, whose structure is prescribed by the chosen modelling approach. In the most general case
 $\nu _t$ is not constant in space, so its effect on the dynamics are (i) modifying the local dissipation rate by a factor
 $1 + \nu _t/\nu$ and (ii) introducing some additional terms proportional to the (partial) derivatives of
 $\nu _t$ and linear in the velocity fluctuations.
The focus of this work is neither a discussion on the choice of the eddy-viscosity modelling strategy nor a detailed study on the specific effects of a specific eddy-viscosity model. Here, the eddy-viscosity model employed in the resolvent analyses of Hwang & Cossu (Reference Hwang and Cossu2010a,Reference Hwang and Cossuc) and Morra et al. (Reference Morra, Semeraro, Henningson and Cossu2019) is used as an example, and its effects are compared with those produced by the forcing  ${\boldsymbol{\mathsf{P}}}$ computed from the DNS data. It is noteworthy that the model for the eddy viscosity
 $\nu _t$ adopted here, taken from Cess (Reference Cess1958), is tuned at
 $Re_{\tau } = 2000$, so its performance at lower
 $Re_{\tau }$ is not assured. This eddy-viscosity modelling approach was first proposed by Reynolds & Hussain (Reference Reynolds and Hussain1972) and is based on the assumption that the fluctuations around the mean flow can be decomposed into a coherent and an incoherent part. The incoherent part is assumed to be unknown, so its contribution to the Reynolds stresses is modelled, whereas the coherent part is assumed to be known and it is used for the modelling (see Reynolds & Hussain (Reference Reynolds and Hussain1972) for more details). The results from the eddy-viscosity modelling are discussed by comparing
 ${\boldsymbol{\mathsf{P}}}$ from DNS data with
 ${\boldsymbol{\mathsf{P}}}_{\nu _t}$, where
 ${\boldsymbol{\mathsf{P}}}_{\nu _t}$ is the equivalent forcing introduced by the eddy-viscosity model such that
 ${\boldsymbol{\mathsf{S}}}_{{\boldsymbol{\mathsf{R}}}_{\nu _t}} = {\boldsymbol{\mathsf{R}}} {\boldsymbol{\mathsf{P}}}_{\nu _t}{\boldsymbol{\mathsf{R}}}^H=\gamma _{\nu _t}{\boldsymbol{\mathsf{R}}}{\boldsymbol{\mathsf{R}}}^H$ and is computed as in (2.13). The normalization scalars are presented in table 2.
The square root of the coefficients  $b_i^2 = \mathrm {diag}(\boldsymbol {\phi }_i^H\boldsymbol{\mathsf{W}}{\boldsymbol{\mathsf{P}}}_{\nu _t}\boldsymbol{\mathsf{W}}\boldsymbol {\phi }_i)$, which quantify the projection of
 ${\boldsymbol{\mathsf{P}}}_{\nu _t}$ onto the right-singular vectors
 $\boldsymbol {\phi }_i$ of
 ${\boldsymbol{\mathsf{R}}}$, are presented in figure 13 with black empty triangles. The coefficients
 $a_i=\sigma _i b_i$ which define the shape of the prediction
 $\mathrm {diag}({\boldsymbol{\mathsf{S}}}_{{\boldsymbol{\mathsf{R}}}_{\nu _t}}) = \sum _i |\boldsymbol {\psi }_i|^2 a_i^2$ are also presented in figure 13 as blue empty circles. These quantities are presented for both
 $Re_{\tau } = 179$ and
 $Re_{\tau } = 543$, and for both near-wall and large-scale structures. The trends presented in figure 13 are normalized by their value for the first mode; the reference for the normalization is presented in table 2. It appears that the equivalent forcing
 ${\boldsymbol{\mathsf{P}}}_{\nu _t}$, provided by the eddy-viscosity modelling, is able to modify the relative weights
 $a_i = \sigma _i b_i$ in the linear combination
 $\mathrm {diag}({\boldsymbol{\mathsf{S}}}_{{\boldsymbol{\mathsf{R}}}_{\nu _t}}) = \sum _i |\boldsymbol {\psi }_i|^2 a_i^2$ of the right-singular vectors
 $\boldsymbol {\psi }_i$ of
 ${\boldsymbol{\mathsf{R}}}$ similarly to
 ${\boldsymbol{\mathsf{P}}}$ from DNS data, as shown in figure 13. In this figure DNS data are represented by the black filled triangles and blue filled circles. This occurs because
 ${\boldsymbol{\mathsf{P}}}_{\nu _t}$ provides coefficients
 $b_i$ whose magnitude is comparable with that of the coefficients
 $b_i$ given by
 ${\boldsymbol{\mathsf{P}}}$ from DNS data.
The discussion about the coefficients  $a_i$,
 $b_i$ and the singular values
 $\sigma _i$ and their effect on the output is consistent with the results shown in figure 14, where the streamwise component of
 ${\boldsymbol{\mathsf{S}}}_{{\boldsymbol{\mathsf{R}}}_{\nu _t}}$ is presented. Here
 ${\boldsymbol{\mathsf{S}}}_{{\boldsymbol{\mathsf{R}}}_{\nu _t}}$ is in better accordance with
 ${\boldsymbol{\mathsf{S}}}$ than
 ${\boldsymbol{\mathsf{S}}}_{{\boldsymbol{\mathsf{R}}}_{\nu }}$, as shown in Morra et al. (Reference Morra, Semeraro, Henningson and Cossu2019) for a turbulent channel at
 $Re_{\tau }=1007$. In particular, the eddy-viscosity modelling gives an improved approximation of the output also for near-wall structures. This is expected from the trend of the coefficients
 $a_i$ (and
 $b_i$) in figure 13: the empty circles (and triangles) which represent
 $a_i$ (and
 $b_i$) from
 ${\boldsymbol{\mathsf{P}}}_{\nu _t}$ are closer to the filled circles (and triangles) which represent
 $a_i$ (and
 $b_i$) for
 ${\boldsymbol{\mathsf{P}}}$ from DNS data than they are for
 ${\boldsymbol{\mathsf{P}}}=\gamma _{\nu }{\boldsymbol{\mathsf{I}}}$. Note that for
 ${\boldsymbol{\mathsf{P}}}=\gamma _{\nu }{\boldsymbol{\mathsf{I}}}$ it is
 $a_i = \sigma _i \gamma _{\nu }$ and
 $a_i/a_1 = \sigma _i/\sigma _1$ in figure 13 coincide with the red-filled squares.
It is noteworthy that the prediction improves when the relative weight  $a_i$ for
 $i>2$ is
 $a_i > \sigma _i$ in all the cases presented, which is expected by inspecting the trend of
 $a_i$ and
 $b_i$ based on
 ${\boldsymbol{\mathsf{P}}}$ from DNS data. The right-singular vectors of
 ${\boldsymbol{\mathsf{R}}}$ with
 $i>2$ correspond to sub-optimals in linear analyses based on the resolvent
 ${\boldsymbol{\mathsf{R}}}$. Thus, if a significant part of the forcing is spanned by linear sub-optimals, such linear analyses can be inaccurate. It is remarked in Beneddine et al. (Reference Beneddine, Sipp, Arnault, Dandois and Lesshafft2016) that the assessment of the accuracy of linear analyses based solely on the resolvent
 ${\boldsymbol{\mathsf{R}}}$ should not hinge solely on the trend of the singular values
 $\sigma _i$ but on the coefficients
 $a_i=\sigma _i b_i$, which include the projection of the forcing onto the right-singular vectors of
 ${\boldsymbol{\mathsf{R}}}$. Here, this statement is quantified for the presented channel flows.
Thus, the results with the eddy-viscosity model indicate that accounting for the nonlinear forcing term  ${\boldsymbol{\mathsf{P}}}$ improves accuracy for all the cases presented here, not only for large-scale structures, which is in accordance with the discussion in Pickering et al. (Reference Pickering, Towne, Jordan and Colonius2020) and Morra et al. (Reference Morra, Semeraro, Henningson and Cossu2019). However, it is notable that also in this case the prediction is erroneous because the provided forcing is not exactly the
 ${\boldsymbol{\mathsf{P}}}$ computed from the DNS data. In fact, in figure 13 the filled symbols and the empty symbols for
 $a_i$ and
 $b_i$, which represent the projections
 $b_i$ and the coefficients
 $a_i$ of the linear combination of
 $\phi _i$ for
 ${\boldsymbol{\mathsf{P}}}$ and for
 ${\boldsymbol{\mathsf{P}}}_{\nu _t}$ are not superposed. Nevertheless, it is clear that the accuracy of the prediction is improved if the modelled forcing term mimics the coefficients
 $b_i$ from the projection of
 ${\boldsymbol{\mathsf{P}}}$ computed from the DNS data. Thus, an eddy-viscosity modelling approach may be tempting for these sort of predictions, as it leads to an effective forcing
 ${\boldsymbol{\mathsf{P}}}_{\nu _t}$ whose structure, or colour, leads to outputs close to the observations from DNS data.
6. Conclusions
In this work the CSD of the nonlinear forcing term associated with the velocity fluctuation, which is the input to the resolvent operator based on the mean flow, is quantified for the first time for turbulent channel flows. The computation is based on snapshots of DNS of turbulent channel flows at  $Re_{\tau } = 179$ and
 $Re_{\tau } = 543$. The nonlinear forcing is computed at fixed time instants and the realizations are used with the Welch method. The CSD of the velocity fluctuations is computed with the same technique. The CSDs are computed for highly energetic structures typical of buffer-layer motions,
 $(\lambda _x^+,\lambda _z^+) = (1130,113)$ at
 $Re_{\tau }=179$ and
 $(\lambda _x^+,\lambda _z^+) = (1137,100)$ at
 $Re_{\tau }=543$, and large-scale motions,
 $(\lambda _x,\lambda _z) = (4.19,1.26)$ at
 $Re_{\tau }=179$ and
 $(\lambda _x,\lambda _z) = (6.28,1.57)$ at
 $Re_{\tau } = 543$. The accuracy of the computed nonlinear forcing term is assessed by computing its response with the resolvent. This response is then compared with the velocity fluctuations from DNS data. The two PSDs appear to be indistinguishable, which shows the evaluation to be accurate. The computed CSD of the forcing owing to the nonlinear terms is shown not to be uncorrelated (or white) in space, which implies the forcing is structured.
As the nonlinear forcing is non-solenoidal by construction and the velocity field of the incompressible N–S is affected only by the solenoidal part of the forcing (Chorin & Marsden Reference Chorin and Marsden1993), the PSD associated with the solenoidal part of the nonlinear forcing is evaluated and presented. It is seen that the wall-normal and the spanwise components of the nonlinear forcing are very different from their solenoidal counterpart for all the cases presented. In particular, in the solenoidal part of the forcing these two components have the shape of quasi-streamwise vortices, which are typical of the lift-up mechanism. On the other hand, the streamwise component of the forcing is almost unchanged in its solenoidal counterpart. For all the cases presented, it is shown that the transverse components of the forcing generate a response which is counteracted by the response of the streamwise component of the forcing, as in a destructive interference. It is also demonstrated that the high-amplitude peak at  $y^+=6$ in the streamwise component of the forcing for the large-scale structure
 $(\lambda _x,\lambda _z) = (6.28,1.57)$ at
 $Re_{\tau } = 543$ is necessary to recover the local maximum at
 $y^+=12$ of the streamwise component of the velocity, thus, the streamwise shear, but it is not relevant for the bulk of the response. This explicitly verifies the conclusions of Flores & Jimenez (Reference Flores and Jimenez2010); Hwang & Cossu (Reference Hwang and Cossu2011) that the dynamics of large-scale motions, although affected by smaller near-wall structures, is mostly related to similar length scales. This last statement is also verified by the fact that a low-rank approximation of the forcing, which includes only the pair of most energetic symmetric and antisymmetric SPOD modes that have the same length scale of the response, leads to the bulk of the response for both near-wall and large-scale structures and for both Reynolds numbers.
The projection of the nonlinear forcing term onto the right-singular vectors of the resolvent is evaluated. It appears that the multiplication of the singular values  $\sigma _i$ of the resolvent with the projection coefficients
 $b_i$ modifies the relative importance of the left-singular vectors of the resolvent in the linear combination that defines the shape of the response. It is seen that the left-singular vectors of the resolvent associated with very low-magnitude singular values are non-negligible because the nonlinear forcing term has a non-negligible projection onto the linear sub-optimals of the resolvent analysis introduced by McKeon & Sharma (Reference McKeon and Sharma2010). This occurs for both near-wall and large-scale structures at both Reynolds numbers, but the effect is stronger for large-scale structures. As the response is given by the linear combination of the left-singular vectors of the resolvent weighted with the terms
 $a_i = \sigma _i b_i$, the evaluation of
 $b_i$ is an explicit quantification of the accuracy of resolvent analysis, as discussed in Beneddine et al. (Reference Beneddine, Sipp, Arnault, Dandois and Lesshafft2016). The same coefficients
 $b_i$ are computed when the stochastic forcing is modelled with an eddy-viscosity approach. It is here clarified that this modelling leads to an improvement in the accuracy of the prediction of the response (Morra et al. Reference Morra, Semeraro, Henningson and Cossu2019) because the resulting coefficients
 $b_i$ are closer to those associated with the nonlinear forcing term evaluated from DNS data.
These findings corroborate the conjecture that the nonlinear forcing term of turbulent channel flows have spatiotemporal coherence, and indicate that the level of coherence is high. Spatiotemporal coherence was already hypothesized by Reynolds & Hussain (Reference Reynolds and Hussain1972) but has never been quantified explicitly for a turbulent channel flow, even though it has been used as ‘ansatz’ in many studies. Instead, the question of ‘how much’ coherent may be the forcing has been addressed by some recent studies on turbulent jets (Schmidt et al. Reference Schmidt, Towne, Rigas and Colonius2018; Lesshafft et al. Reference Lesshafft, Semeraro, Jaunet, Cavalieri and Jordan2019). These studies show reasonable predictions of the flow quantities with the assumption of a forcing uncorrelated in space. However, because here a rank-2 approximation of the forcing leads to the bulk of the response, it can be concluded that the forcing has high coherence for the present turbulent channel flows.
The found coherence affects positively the techniques that account for the forcing through system identification methods, in a similar fashion to Jovanovic & Bamieh (Reference Jovanovic and Bamieh2001), Zare et al. (Reference Zare, Jovanović and Georgiou2017) or Illingworth et al. (Reference Illingworth, Monty and Marusic2018). In fact, the low-rank characteristic of the forcing reduces the number of unknown parameters to identify, which reduces the complexity of the identification problem and increases the accuracy of the estimation (Hjalmarsson & Mårtensson Reference Hjalmarsson and Mårtensson2007). Moreover, the found low-rank approximation of the forcing can be helpful to the control community for the design or placement of a counteracting forcing as actuator, following ideas similar to Sasaki et al. (Reference Sasaki, Morra, Cavalieri, Hanifi and Henningson2020).
Finally, these findings are valid for the presented Reynolds numbers and cannot be used to infer the level of spatiotemporal coherence of the nonlinear forcing for flows with higher Reynolds number. Investigations along these directions are under way.
Acknowledgements
The authors would like to thank C. Cossu for fruitful discussions. The authors would like to acknowledge the Swedish–Brazilian Research and Innovation Centre CISB and the European Research Council (ERC) under grant agreement 694452-TRANSEP-ERC-2015-AdG for funding. The simulations were performed on resources provided by the Swedish National Infrastructure for Computing (SNIC) at NSC, HPC2N and PDC.
Declaration of interests
The authors report no conflict of interest.
Appendix A. Resolvent operators
The linear system in (2.2) is derived from the (2.1), as in Schmid & Henningson (Reference Schmid and Henningson2001). The matrices  ${\boldsymbol{\mathsf{A}}}$ and
 ${\boldsymbol{\mathsf{B}}}$ are defined as
 \begin{equation} {\boldsymbol{\mathsf{A}}} = \begin{bmatrix} \varDelta^{-1} \mathcal{L}_{\mathcal{OS}} & 0\\ -\textrm{i}\beta U' & \mathcal{L}_{\mathcal{SQ}} \\ \end{bmatrix}, \quad {\boldsymbol{\mathsf{B}}} = \begin{bmatrix} -\textrm{i}\alpha \varDelta^{-1}\mathcal{D} & -k^2\varDelta^{-1} & -\textrm{i}\beta \varDelta^{-1} \mathcal{D}\\ \textrm{i}\beta & 0 & -\textrm{i}\alpha \\ \end{bmatrix}, \end{equation}
where the discretized version of the generalized OSS operators (Cossu et al. Reference Cossu, Pujals and Depardon2009; Pujals et al. Reference Pujals, García-Villalba, Cossu and Depardon2009) are
 \begin{gather} \mathcal{L}_{\mathcal{OS}} = -\textrm{i} \alpha (U\varDelta-U'') + \nu_{T}\varDelta^2+2\nu_T' \varDelta\mathcal{D} + \nu_T''(\mathcal{D}^2 + k^2), \end{gather}
 \begin{gather}\mathcal{L}_{\mathcal{SQ}}= -\textrm{i} \alpha U + \nu_T \varDelta + \nu_T'\mathcal{D}, \end{gather}
with  $\mathcal {D}$ and
 $'$ representing
 $\mathrm {d}/\mathrm {d} y$,
 $k^2 = \alpha ^2+\beta ^2$,
 $\varDelta = \mathcal {D}^2-k^2$, and
 $U(y)$ the reference flow.
 $\nu _{T} = \nu + \nu _t$ with
 $\nu$ the molecular viscosity and
 $\nu _t$ the eddy-viscosity model. Note that setting
 $\nu _t = 0$ reduces (A 2) and (2.2) to the standard OSS equations. The eddy-viscosity used is that proposed by Cess (Reference Cess1958), as reported by Reynolds & Tiederman (Reference Reynolds and Tiederman1967),
 \begin{equation} \frac{\nu_t}{\nu} = \frac{1}{2}\left[ 1 + \frac{\kappa^2 Re_{\tau}^2}{9}(1-y^2)^2(1+2y^2)^2(1- \exp({-Re_{\tau}(1-|y|)/A}))^2 \right]^{{1}/{2}} - \frac{1}{2}, \end{equation}
with  $Re_{\tau } = u_{\tau } h/\nu$ the Reynolds number based on the friction velocity. The von Kármán constant is
 $\kappa =0.426$ and the constant
 $A=25.4$ as in Pujals et al. (Reference Pujals, García-Villalba, Cossu and Depardon2009) and Hwang & Cossu (Reference Hwang and Cossu2010b). This model is tuned for
 $Re_{\tau }=2000$. Here
 $\nu _t = 0$ results in (2.12a), whereas
 $\nu _{t}$ as in (A 3) results in (2.12b). Homogeneous boundary conditions are enforced on both walls:
 $\hat {v}(\pm 1) = \partial _y \hat {v}(\pm 1) = \hat {\omega }_y(\pm 1) = 0$. The matrices relating
 $\hat {{\boldsymbol {u}}}$ and
 $\hat {\boldsymbol {q}}$ are
 \begin{equation} {\boldsymbol{\mathsf{C}}} = \frac{1}{k^2} \begin{bmatrix} \textrm{i}\alpha \mathcal{D} & -\textrm{i}\beta \\ k^2 & 0 \\ \textrm{i}\beta\mathcal{D} & \textrm{i}\alpha \end{bmatrix}, \quad {\boldsymbol{\mathsf{D}}}= \begin{bmatrix} 0 & 1 & 0 \\ \textrm{i}\beta & 0 & -\textrm{i}\alpha \end{bmatrix}. \end{equation}
Appendix B. Solenoidal part of the forcing with ${{L}}$ or ${{C}} {{B}}$


Take a general forcing field  $\boldsymbol {f}$ as the sum of a solenoidal field
 $\boldsymbol {f}^s$ and an irrotational field
 $\boldsymbol {f}^{r}$, such that
 $\boldsymbol {\nabla } \boldsymbol {\cdot } \boldsymbol {f}^{s} = 0$ and
 $\boldsymbol {\nabla } \times \boldsymbol {f}^{r} = 0$. Take
 $\boldsymbol {f}^{r} = \boldsymbol {\nabla } \chi$, with
 $\chi$ a scalar field. For given wavenumbers
 $(\alpha ,\beta )$ the Fourier modes of
 $\boldsymbol {f}$,
 $\boldsymbol {f}^s$ and
 $\boldsymbol {f}^r$, discretized with
 $N_y$ points in the wall-normal direction are the
 $3N_y \times 1$ vectors
 $\skew5\hat {{\boldsymbol {f}}}$,
 $\hat {{\boldsymbol {f}}^s}$,
 $\hat {{\boldsymbol {f}}^r}$ and the Fourier mode of
 $\chi$ discretized with
 $N_y$ points in the wall-normal direction is the
 $N_y \times 1$ vector
 $\hat {\boldsymbol {\chi }}$. Applying
 ${\boldsymbol{\mathsf{B}}}$ to
 $\skew5\hat {{\boldsymbol {f}}}$ corresponds to
 ${\boldsymbol{\mathsf{B}}}\skew5\hat {{\boldsymbol {f}}} = {\boldsymbol{\mathsf{B}}}\hat {{\boldsymbol{f}^{s}}} + {\boldsymbol{\mathsf{B}}}\hat {{\boldsymbol {f}^{r}}}$. It holds that
 \begin{equation} {\boldsymbol{\mathsf{B}}}\hat{{\boldsymbol{f}^{r}}} = \begin{bmatrix} k^2\mathcal{D} \hat{\boldsymbol{\chi}} - k^2\mathcal{D} \hat{\boldsymbol{\chi}}\\ -\alpha \beta \hat{\boldsymbol{\chi}} + \beta \alpha \hat{\boldsymbol{\chi}} \end{bmatrix} = 0, \end{equation}
and
 \begin{equation} {\boldsymbol{\mathsf{B}}}\hat{{\boldsymbol{f}^{s}}} = \begin{bmatrix} \hat{{\boldsymbol{f}_y^s}}\\ \textrm{i} \beta \hat{{\boldsymbol{f}_x^s}} - \textrm{i} \alpha \hat{{\boldsymbol{f}_z^s}} \end{bmatrix} \equiv {\boldsymbol{\mathsf{D}}}\hat{\boldsymbol{f}^s}, \end{equation}
with  $\hat {{\boldsymbol{f}_x^s}}$,
 $\hat {{\boldsymbol {f}_y^s}}$ and
 $\hat {{\boldsymbol {f}_z^s}}$ the
 $N_y\times 1$ vectors of the streamwise, wall-normal and spanwise components of
 $\hat {{\boldsymbol {f}^s}}$.
As  $\hat {{\boldsymbol {u}}}={\boldsymbol{\mathsf{C}}}\hat {\boldsymbol {q}}$ and
 $\hat {\boldsymbol {q}}={\boldsymbol{\mathsf{D}}}\hat {{\boldsymbol {u}}}$, it follows that
 $\hat {{\boldsymbol {u}}}={\boldsymbol{\mathsf{C}}} {\boldsymbol{\mathsf{D}}} \hat {{\boldsymbol {u}}}$. Thus,
 $\hat {{\boldsymbol {f}^s}}={\boldsymbol{\mathsf{C}}} {\boldsymbol{\mathsf{D}}} \hat {{\boldsymbol {f}^s}} = {\boldsymbol{\mathsf{C}}} {\boldsymbol{\mathsf{B}}} \skew5\hat {{\boldsymbol {f}}}$, which provides a first way to isolate the solenoidal part of the forcing.
The Fourier transform in time of (2.2) leads to  $-(\textrm {i}\omega {\boldsymbol{\mathsf{I}}} + {\boldsymbol{\mathsf{A}}}) \tilde {\boldsymbol {q}} = {\boldsymbol{\mathsf{B}}}\skew4\tilde {{\boldsymbol {f}}}$, which is equivalent to
 $-(\textrm {i}\omega {\boldsymbol{\mathsf{I}}} + {\boldsymbol{\mathsf{A}}}) {\boldsymbol{\mathsf{D}}}\tilde {{\boldsymbol {u}}} = {\boldsymbol{\mathsf{D}}}\tilde {{\boldsymbol {f}^{s}}}$. Thus,
 ${\boldsymbol{\mathsf{L}}}\tilde {{\boldsymbol {u}}} = {\boldsymbol{\mathsf{C}}}{\boldsymbol{\mathsf{D}}}\tilde {{\boldsymbol {f}^{s}}} = \tilde {{\boldsymbol {f}^{s}}}$, with
 ${\boldsymbol{\mathsf{L}}}=-{\boldsymbol{\mathsf{C}}}(\textrm {i}\omega {\boldsymbol{\mathsf{I}}} + {\boldsymbol{\mathsf{A}}}) {\boldsymbol{\mathsf{D}}}$.
It follows that  ${\boldsymbol{\mathsf{L}}}\tilde {{\boldsymbol {u}}} = \tilde {{\boldsymbol {f}^{s}}} = {\boldsymbol{\mathsf{C}}} {\boldsymbol{\mathsf{B}}} \skew4\tilde {{\boldsymbol {f}}}$, which leads to the solenoidal part of the forcing from the velocity field. Thus, using
 ${\boldsymbol{\mathsf{L}}}$ or
 ${\boldsymbol{\mathsf{C}}} {\boldsymbol{\mathsf{B}}}$ to compute the solenoidal part of the forcing is equivalent.
Appendix C. DNS and data analysis details
The simulations were performed by means of the SIMSON code (see Chevalier et al. (Reference Chevalier, Schlatter, Lundbladh and Henningson2007) for details) for the simulation of the turbulent channel at  $Re_{\tau }=179$ and by means of Channelflow code (see www.channelflow.ch (2018) for details) for the simulation of the turbulent channel at
 $Re_{\tau }=543$.
The initial transient of the simulation is discarded. Welch's method with Hann windowing and  $75$ % overlap is used to compute the CSDs
 $\boldsymbol{\mathsf{S}}$ and
 ${\boldsymbol{\mathsf{P}}}$ using a total of
 $N_s = 10001$ snapshots of the DNS solutions with sampling interval
 ${\rm \Delta} t_s = 0.5$ for a total acquisition time
 $T_{max} = 5000$ for
 $Re_{\tau }=179$, and using
 $N_s = 2000$ snapshots sampled every
 ${\rm \Delta} t_s = 0.15$ for a total acquisition time
 $T_{max} = 299.85$ for
 $Re_{\tau }=543$. Data have also been averaged between the two walls.


 Open access

