1. Introduction
The collision between India and Asia and their continued convergence have led to the uplift of the world's largest plateau. One important approach for studying Tibetan tectonics is to reconstruct the palaeoelevation of the plateau through time from collision to the present day. However, the uplift history and the timing of the highest elevation reached by the plateau are controversial because of different palaeoenvironmental methods and the absence of precise ages. Coleman & Hodges (Reference Coleman and Hodges1995) proposed that the Tibetan Plateau reached its highest elevation at 14 Ma at the transition from compressional to extensional deformation marked by N–S-trending tectonic grabens and normal faults in the interior of Tibet. However, Fielding (Reference Fielding1996) and Harrison et al. (Reference Harrison, Copeland, Kidd and Lovera1995) suggested that the greatest elevation of the plateau was at 8 Ma. Williams et al. (Reference Williams, Turner, Kelley and Harris2001) and Turner et al. (Reference Turner, Arnaud, Liu, Rogers, Hawkesworth, Harris, Kelley, van Calsteren and Deng1996) suggested tectonic uplift at 18 Ma and 13 Ma, respectively, by dating Neogene volcanic eruptions on the high Tibetan Plateau. Spicer et al. (Reference Spicer, Harris, Widdowson, Herman, Guo, Valdes, Wolfe and Kelley2003) argued that the elevation of the southern plateau remained unchanged over the past 15 Ma using leaf physiognomy.
Oxygen isotopes in sediments are increasingly used for estimating the palaeoelevation of Tibet. This approach uses the calculated δ18O values of the proxy of meteoric water to estimate palaeoaltitude (Garzione et al. Reference Garzione, Dettman, Quade, Decelles and Butler2000a,b; Rowley, Pierrehumbert & Currie, Reference Rowley, Pierrehumbert and Currie2001). The most recent study of Rowley & Currie (Reference Rowley and Currie2006) suggested that the palaeoelevation of central Tibet exceeded 4000 m above sea level from 35 Ma to the Pliocene. This is the oldest age estimate for the Tibetan Plateau reaching its present elevation. However, the ages used by Rowley & Currie (Reference Rowley and Currie2006) were based on previous estimated ages from microfossils in the sediments, which have large uncertainties. Therefore, it is necessary to have new age controls for the Cenozoic deposits of the Lunpola basin in order to more precisely evaluate the palaeoaltimetric evolution history in this region.
2. Geological setting and sampling
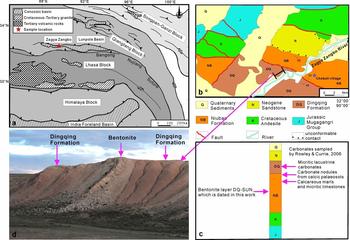
The Lunpola basin is primarily a Tertiary rift basin situated in the central part of the Bangong–Nujiang Suture Zone (Yuan & Xu, Reference Yuan and Xu2000), which stretches E–W for a distance of approximately 200 km and has a width of roughly 20 km (Fig. 1a). The Cenozoic deposits in the basin are up to 4000 m thick and have been deformed by thrusting and folding that occurred within the basin. The thick sediments consist of two stratigraphic units. The Niubao Formation, with a thickness of about 3000 m, forms the lower section and is marked by reddish clastic deposits, dominated by mudstone, sandstone and gravels, mostly representing a fluvial to marginal lake environment. It was assigned an age of Paleocene to Eocene based on previous microfossil studies (Bureau of Geology and Mineral Resources Xizang Autonomous Region, 1993). The Dingqing Formation, which forms the upper section, is characterized by fine-grained grey mudstone, fine siltstone and limestone, with a thickness of approximately 1000 m. The depositional environment of the Dingqing Formation is interpreted as a typical lake environment. Based on the characters of the ostracode and palynological assemblages, the age of the Dingqing Formation has been interpreted as Oligocene (Xia, Reference Xia1982), Miocene (Wang et al. Reference Wang, Yang, Li and Li1975), Miocene–Pliocene (Xu, Reference Xu1980) or late Oligocene to Pliocene (Xia, Reference Xia1983). Obviously, these early age assignments have great uncertainties. One of the age assignments of Miocene–Pliocene by Xu (Reference Xu1980) was also used by Rowley & Currie (Reference Rowley and Currie2006), when they estimated the palaeoelevation of the Lunpola basin.
(a) Schematic tectonic map showing the Lunpola basin in the Himalaya–Tibet region. Our sampling site is located on the northern margin of the basin. (b) Geological map showing the distribution of strata near the studied Chebuli section (modified from Bureau of Geology and Mineral Resources Xizang Autonomous Region, 1993). (c) Stratigraphic column of the Lunpola basin. Rowley & Currie's sample sites are also marked. (d) Photo showing the strata bearing the bentonite layer in the middle to lower Dingqing Formation at the Chebuli section.

In the present work, we focus on the middle to lower part of the Dingqing Formation. Samples were collected along the north bank of the Zagya Zangbo River, located near the northern margin of the Lunpola basin, with an outcrop width of 500 m adjacent to Chebuli village (Fig. 1b, c). The middle to lower part of the Dingqing Formation contains a bentonite layer approximately 40 cm thick (Fig. 1d), from which sample DQ-SUN (32° 4′ N, 89° 37′ E) was collected for SIMS U–Pb zircon analyses. The bentonite layer is conformably interbedded in the silty mudstones; both the lower and upper contacts of the bentonite layer are sharp and planar (Fig. 1d). Hence, the dating of the bentonite provides a depositional age for the sedimentary layers that bracket the layer. Thin-section studies show that sample DQ-SUN is weathered, with feldspar and biotite altered to clay minerals, not suitable for 40Ar–39Ar dating. Thus we separated zircons for SIMS U–Pb zircon dating.
3. Analytical method and result
Sample DQ-SUN was processed by conventional magnetic and density techniques to concentrate non-magnetic, heavy fractions. Zircon grains, together with zircon standard TEMORA 2 were mounted in epoxy, which was then polished to section the crystals for analysis. All zircons were documented with transmitted and reflected light micrographs as well as cathodoluminescence (CL) images to reveal their internal structures, and the mount was vacuum-coated with high-purity gold.
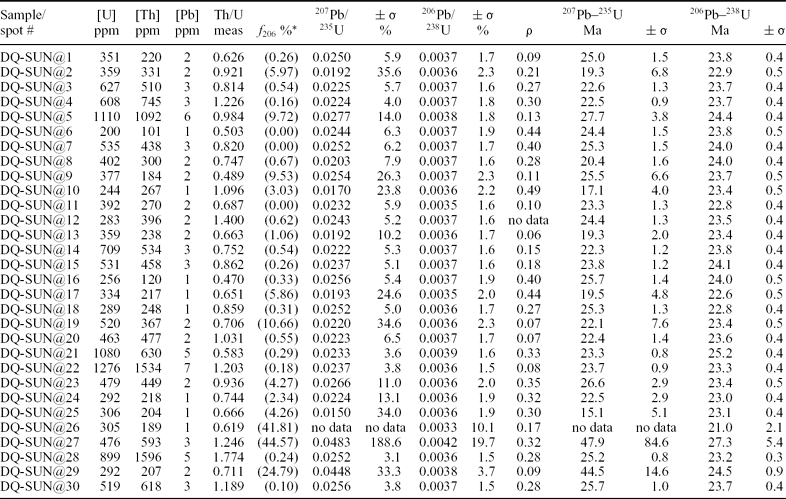
Measurements of U, Th and Pb were conducted using the Cameca IMS-1280 ion microprobe at the Institute of Geology and Geophysics, Chinese Academy of Sciences in Beijing. Operating and data processing procedures were similar to those described by Li et al. (Reference Li, Liu, Li, Guo and Chamberlain2009). U/Th/Pb ratios were determined relative to the standard zircon TEMORA 2 (206Pb–238U age of 416.5 ± 0.2 Ma) (Black et al. Reference Black, Kamo, Allen, Davis, Aleinikoff, Valley, Mundil, Campbel, Korsch, Williams and Foudoulis2004), analyses of which were interspersed with known grains. Because the standard zircon 91500 is the best currently available for a variety of element abundances and isotopic compositions (Ireland & Williams, Reference Ireland and Williams2003), absolute abundances of U/Th were determined relative to 91500 (Wiedenbeck et al. Reference Wiedenbeck, Allé, Corfu, Griffin, Meier, Oberli, Von Quadt, Roddick and Spiegel1995) on a separate mount. The mass resolution used to measure Pb/Pb and Pb/U isotopic ratios was 5400 during the analyses. Measured compositions were corrected for common Pb using non-radiogenic 204Pb. Corrections are sufficiently small to be unaffected by the choice of common Pb composition; an average of present-day crustal composition (Stacey & Kramers, Reference Stacey and Kramers1975) was used for the common Pb assuming that the common Pb is largely due to surface contamination introduced during sample preparation. SIMS U–Pb zircon data is presented in Table 1. Uncertainties for each individual analysis are reported at a 1σ level; mean ages for pooled U/Pb and Pb/Pb analyses are quoted with 95% confidence intervals. Decay constants are those recommended by the IUGS Subcommission on Geochronology (Steiger & Jager, Reference Steiger and Jager1977). The uncertainty of standard (0.05%) and decay constants (0.1%) was propagated into the final ages; however, their contributions to age uncertainty are insignificant compared to uncertainty of U/Pb calibration (about 1.5%). Data calculation was carried out using the Isoplot/Ex v. 2.49 programs (Ludwig, Reference Ludwig2001).
SIMS zircon U–Pb data

* f 206 is the percentage of common 206Pb in total 206Pb.
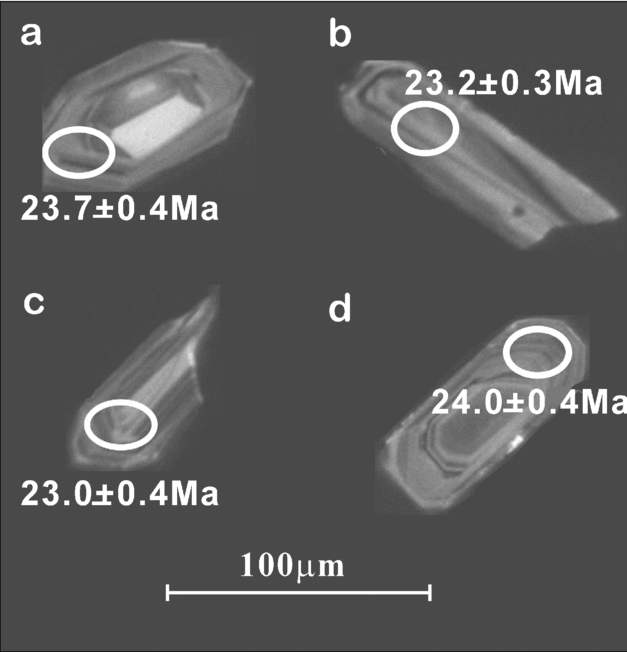
Zircons from sample DQ-SUN are mostly euhedral, transparent and colourless, range from 50 to 150 μm in length, and have length to width ratios between 2:1 and 5:1 (Fig. 2). Most crystals have oscillatory zoning under CL (Fig. 2), while a minority have inherited cores. A total of 30 analyses were performed on 30 zircon grains. All the analyses were conducted on portions of zircon with oscillatory zoning, which is interpreted as reflecting growth in magma. Uranium concentrations range from 200 to 1276 ppm, thorium from 101 to 1596 ppm, and Th/U ratios vary between 0.47 and 1.77, consistent with an igneous origin (> 0.1).
Cathodoluminescence (CL) images of representative zircons from sample DQ-SUN. The ellipses on the analysed zircon grains show the positions of U–Pb analytical sites.

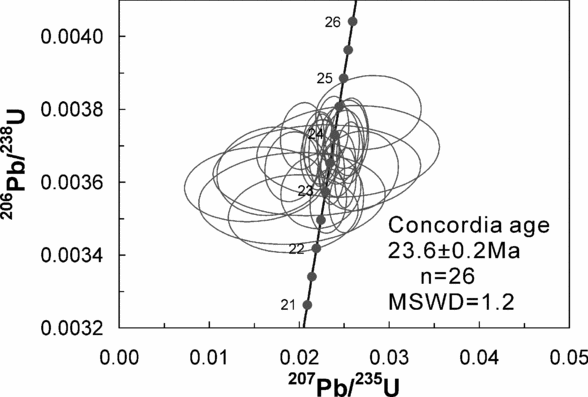
Among the 30 spots, three analyses (spots 26, 27 and 29) have a high common Pb, with f 206 values (the percentage of common 206Pb in total 206Pb) mostly > 24%. The spot 21 has a slightly older 206Pb–238U age (25.2 ± 0.4 Ma, 1σ), with high U content (1080 ppm). Most high-U zircons commonly yield anomalously old U–Pb dates, although there is still no logical reason for its mechanism, and this phenomena was called the ‘high-U effect’ (Aleinikoff et al. Reference Aleinikoff, Wintsch, Fanning and Dorais2002; Li et al. Reference Li, Li, Liu and Tang2010). The older 206Pb–238U age of spot 21 may indicate inheritance or high-U effect, but no interpretation could be made based on one spot. Rejecting these four spots, the remaining 26 analyses have indistinguishable 207Pb/235U and 206Pb/238U isotopic ratios within analytical uncertainties (Table 1), and plot in a cluster close to concordia as a coherent group (Fig. 3). They give a weighted mean 206Pb–238U age of 23.5 ± 0.2 Ma (2σ, MSWD = 1.1), which is interpreted as the eruption age for the sample DQ-SUN, and the best estimate of the depositional age of the bentonite layer within the Chebuli section.
U–Pb concordia diagram showing SIMS analytical data for zircons from the bentonite layer (sample DQ-SUN) of the Dingqing Formation in the Lunpola basin, central Tibet. Analytical uncertainty is represented by 2σ error ellipses.

4. Discussion and conclusions
The present elevation of the Lunpola basin is approximately 4600 m. It is important to better understand when this region reached the present altitude. Recently, Rowley & Currie (Reference Rowley and Currie2006) studied the oxygen isotopes of soil carbonate in the Niubao Formation as well as the oxygen isotopic compositions of lake carbonates from the Dingqing Formation. They concluded that palaeoaltitudes for the Niubao and Dingqing formations exceeded 4000 m from 35 Ma to the Pliocene. Our SIMS U–Pb zircon age of 23.5 ± 0.2 Ma (2σ) from the bentonite layer in the middle to lower part of the Dingqing Formation provides, for the first time, a direct absolute age constraint in the Lunpola basin. Our new chronology demonstrates that the middle to lower Dingqing Formation accumulated during the late Oligocene−early Miocene period. This differs from previous age estimates (Wang et al. Reference Wang, Yang, Li and Li1975; Xu, Reference Xu1980; Xia, Reference Xia1982, Reference Xia1983) as well as the age used by Rowley & Currie (Reference Rowley and Currie2006). The new date suggests that the Lunpola basin on the Tibetan Plateau was at > 4000 m during deposition of low δ18O carbonates during late Oligocene–early Miocene time.
Many E–W-trending, thrust-bounded Tertiary basins are located along the Bangong–Nujiang Suture Zone in central Tibet (Fig. 1a), and the Lunpola basin is the largest one. Because of a lack of precise radiometric dating, the stratigraphic correlation between these basins is problematic. The Nima basin is one of these Tertiary basins along the Bangong–Nujiang Suture Zone, which lies roughly 240 km to the west of the Lunpola basin. Recent 40Ar–39Ar dating on biotite from six reworked tuffs in the red bed unit in the Nima basin yields an age range of 26.1 ± 0.1 Ma to 23.5 ± 0.1 Ma (Kapp et al. Reference Kapp, Decelles, Gehrels, Heizler and Ding2007). Normally, U–Pb ages are 1% older than 40Ar–39Ar ages owing to the uncertainties in decay constant of 40K (Min et al. Reference Min, Mundil, Renne and Ludwig2000). Our new age for the middle to lower Dingqing Formation in the Lunpola basin (23.5 ± 0.2 Ma, 2σ) is consistent with the age determinations from Nima basin considering the discrepancy between the 40Ar–39Ar and U–Pb dating methods, indicating that the middle to lower Dingqing Formation in the Lunpola basin and the red bed unit in the Nima basin are age correlative. These radiometric dates provide stringent age controls for the sedimentary strata in central Tibet, thus giving insights into palaeoelevation estimation and palaeoenvironmental reconstruction for future studies.
Acknowledgements
The authors thank Dr Jingmai O'Connor for her language corrections, Prof. Jinhui Yang and two anonymous reviewers for their constructive suggestions, which have significantly improved the manuscript. This research was supported by the Chinese Academy of Sciences grant KZCX2-YW-Q09-06, the China MOST 973 Programme grant 2009CB825001 and the National Natural Science Foundation of China grants 90714010, 40821091 and 40925012.