INTRODUCTION
Methane (CH4) is one of the main greenhouse gases contributing to global warming with a 100-year global warming potential (GWP), 23 times that of CO2 (Intergovernmental Panel on Climate Change (IPCC) Reference Houghton, Ding, Griggs, Noguer, van der Linden, Dai, Maskell and Johnson2001). Thus, despite being present in the atmosphere at far lower concentrations than CO2, it is estimated that CH4 is responsible for approximately 0·20 of the greenhouse gas effect (IPCC Reference Houghton, Ding, Griggs, Noguer, van der Linden, Dai, Maskell and Johnson2001). However, there is uncertainty in the estimation of CH4 production from small ruminants due to the scant availability of data to document the variability that exists and also due to the significant impact of diet on enteric CH4 production. Methane production from goats fed different diets has not been studied extensively. Such data can contribute to more accurate estimates of emission factors used in greenhouse gas inventories as well as to developing nutritional and management strategies to reduce CH4 production.
Many current inventories for enteric CH4 production are based on measurements of emission rates from animals in open circuit respirometers in strictly controlled environments (Murray et al. Reference Murray, Moss, Lockyer and Jarvis1999). There is a need to be able to measure the CH4 production potential of a range of feedstuffs under different rumen environmental conditions in order to predict the amount of CH4 produced by ruminants. In vitro methods have the advantage not only of being less expensive and less time-consuming, but also it is possible to maintain experimental conditions more precisely than in vivo trials (Getachew et al. Reference Getachew, Blummel, Makkar and Becker1998). In vitro techniques using rumen fluid as an inoculum could be considered as models of in vivo rumen digestion and have been applied to estimate digestibility of feedstuffs (Moss & Givens Reference Moss and Givens2002). But there have been limited attempts to use the in vitro gas production technique (IVGPT; Menke et al. Reference Menke, Raab, Salewski, Steingass, Fritz and Schneider1979) to estimate the CH4 production potential of feedstuffs. The gas production system has been used primarily to describe the rate of degradation of feedstuffs and to study the formation of volatile fatty acids (VFAs) and stoichiometry of fermentation (Blummel & Ørskov Reference Blummel and Ørskov1993). The objectives behind using IVGPT in the current experiment are, simply, to demonstrate the large number of samples that can be analysed at a time and the ease with which the system can be established and managed compared with in vivo techniques. The present study was designed to examine two issues: first, to measure the CH4 production by Japanese goats fed diets differing in composition in a respiration chamber (RC) and second, to compare that with CH4 estimated by the in vitro gas production technique. It is thought that this is the first report in which CH4 emissions from goats measured in the RC from a range of 19 different diet samples have been compared with that estimated using IVGPT.
MATERIALS AND METHODS
Animals and diets
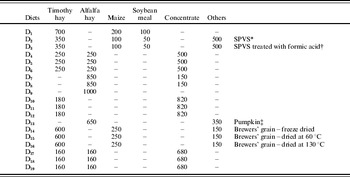
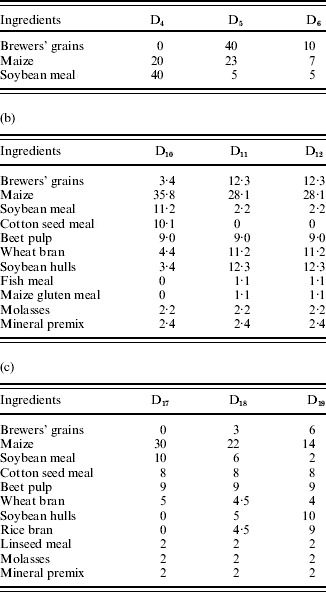
Adult Japanese goats (2 years old) with a mean body weight of 26±5·4 kg were used for the current experiments. The details of the diets (D1–D19) fed to the goats are presented in Table 1. D2 and D3 each contained sweet potato vine silage (SPVS; 0·50); however, in D3 SPVS was treated with formic acid (850 g/litre) at 0·002 (during ensiling) on fresh matter basis. The SPVS was produced after ensiling the stem and leaves of sweet potato for 28 days and it was fed to goats after mixing with other ingredients just before being offered. Diets 14, 15 and 16 contained 0·15 of brewers' grains. Brewers' grains added in D14 were freeze-dried, whereas in D15 and D16, they were dried at 60 and 130°C, respectively. Diets 4–6, 10–12 and 17–19 contained similar amounts of concentrates but the ingredient composition was different (Table 2) and that has resulted in the variation in their nutritional composition (Table 3). Feeding was at 1·1 M, as per NRC (1981) standard for goats.
Ingredient composition of the experimental diets (g/kg)

* Sweet potato vine silage (SPVS) contained (g/kg dry matter) 101 DM, 124 crude protein (CP), 851 organic matter (OM), 419 neutral detergent fibre (NDF) and 351 acid detergent fibre (ADF).
† SPVS was treated with 0·2% formic acid (85%).
‡ Composition (g/kg DM) 903 DM, 946 OM, 94 CP, 251 NDF, 97 ADF, 17 acid detergent lignin (ADL), 18·8 MJ/kg gross energy (GE).
Composition (g/100 g) of the concentrate mixture of different diets
(a)

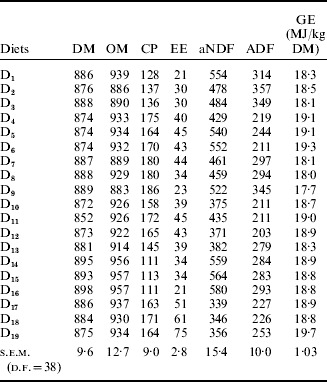
Composition (g/kg DM) of the experimental diets fed to goats

Values represent mean of the triplicate analysis.
D1–D19, diets 1–19 fed to goats during the RC studies.
DM, dry matter; OM, organic matter; CP, crude protein; EE, ether extract; aNDF, neutral detergent fibre; ADF, acid detergent fibre; GE, gross energy.
Metabolism trial
Four goats were used in the trial; all four goats were fed the same diet at the same time and the 19 diets were fed to goats in succession. A metabolism trial for each diet was conducted for 21 days with a 7-day adjustment period and 7-day preliminary period followed by a 7-day collection period, which included 3 consecutive days for measurement of gas exchange in an open circuit RC. Each diet was fed randomly to avoid any risk of bias when comparing feeds that are close together in composition. Further, there was also a gap of 3 weeks between each trial for the goats to become acclimatized to the diet (preliminary period) and also to avoid any residual effect. The daily allowances were weighed and fed once a day. Refusals, if any, were collected and measured before feeding on the next day. Representative samples of feeds and refusals were taken, oven dried (60°C for 24 h) and ground to pass through a 1 mm sieve for chemical analysis. The total faecal and urinary outputs were preserved daily. Urine was collected in the urine buckets where 25 ml (0·01 of urine volume) of 20 g/litre sulphuric acid (H2SO4) was placed before collection. After total collection, faeces and urine were mixed thoroughly and sub-sampled for N determination. For further analysis, faecal samples were oven dried (60°C for 24 h) and then ground similarly. Urine (20 ml) was measured onto a polyethylene film and freeze-dried for determination of gross energy (GE) using the method described by Itoh & Tano (Reference Itoh and Tano1977).
RC
Total air flow, consumption of oxygen (O2), the concentration of CH4 and carbon dioxide (CO2) produced were measured for 3 consecutive days by direct measurement of gaseous output using an open circuit RC, details of which are as outlined by Iwasaki et al. (Reference Iwasaki, Haryu, Tano, Terada, Itoh and Kameoka1982). The chamber was maintained under controlled temperature conditions at 20°C and relative humidity at 60% throughout the measurement periods.
IVGPT
In vitro gas production was determined as per the procedure described by Menke & Steingass (Reference Menke and Steingass1988). In brief, samples (200 mg) were weighed into 100 ml calibrated glass syringes (Haberle Labortechnik, Germany) with pistons lubricated with Vaseline. Buffered mineral solution (Menke & Steingass Reference Menke and Steingass1988) was prepared and placed in a water bath at 39°C under continuous flushing with CO2. Rumen fluid was collected before the morning feed from three rumen-cannulated, non-lactating and non-pregnant Holstein cows (weighing 466 kg body weight) fed 5·8 kg timothy hay, 1·6 kg crushed maize and 0·80 kg soybean meal (SBM). Rumen fluid and contents were collected into a prewarmed insulated flask, transported to the laboratory, homogenized and filtered through four layers of nylon cloth. The reducing fluid was prepared and mixed with buffer. The well-mixed and CO2-flushed rumen fluid was added to the buffered mineral solution. The mixture was kept stirred under CO2 in a water bath at 39°C, using a magnetic stirrer. Buffered rumen fluid (30 ml) was dispensed into each syringe containing the weighed diet samples and immediately placed in thermostatically controlled shaking water bath at 39°C. Three syringes containing 30 ml inoculum served as blanks. The incubations were carried out in triplicate for each feed sample and these incubations were repeated three times, with intervals of 1 week. Incubations without feed sample served as blanks with every set. The difference in the composition and activity of rumen inoculum among incubations was controlled by parallel incubation of reference standard feedstuffs obtained from the Hohenheim University, Germany as suggested by Menke et al. (Reference Menke, Raab, Salewski, Steingass, Fritz and Schneider1979).
The total gas volume after 2, 4, 6, 8, 10, 24 and 48 h were recorded. The gas samples were collected after 24 and 48 h in evacuated vials and subjected for CH4 analysis in a gas chromatograph. Methane production was calculated from the cumulative gas produced after 24 and 48 h incubation. Methane production estimated by IVGPT was corrected for standard temperature and pressure (STP) for comparison with that of RC as follows:

Chemical analysis
Methane estimation
From the in vitro gas samples, concentration of CH4 was analysed by gas chromatograph GC-8A (Shimadzu Corp., Kyoto, Japan) on Polapack Q (Waters Corp., MA, USA) column.
Diet samples were analysed for total ash and nitrogen by the Kjeldahl method (Association of Official Analytical Chemists (AOAC) 1995). Neutral detergent fibre (aNDF) was analysed as per Van Soest et al. (Reference Van Soest, Robertson and Lewis1991) and acid detergent fibre (ADF) as per Robertson & Van Soest (Reference Robertson, Van Soest, James and Theander1981). The NDF was analysed without sodium sulphite, but with the addition of a heat stable-amylase. Both aNDF and ADF were expressed with residual ash. Gross energy content of the samples was analysed in an adiabatic bomb calorimeter (CA-4 PJ, Shimadzu, Japan).
Statistical analysis
The independence and homogeneity of variance of the 19 diets over time was tested by a time series plot of residuals (Box–jung satistical analysis) (Ljung & Box Reference Ljung and Box1978). The autocorrelation with lags 1 and 2 was also performed for all the diets.
Data on digestibility and methane production from different diets measured in RC were analysed with the experiment being included in the model (mixed model) and animal as random effect. The data were analysed using SPSS 11.0. Stata 8.0 and Systat 8.0 and Microsoft Word and Excel were used to generate graphs and tables.
RESULTS
Composition of diets
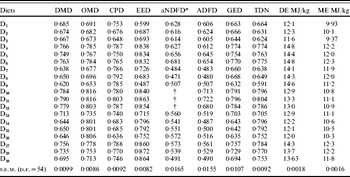
Maximum crude protein (CP) was recorded in diets 7, 8 and 9 (180 g/kg) and the lowest in 14, 15 and 16 (112 g/kg). Ether extract (EE) content ranged from 21 to 75 g/kg. Maximum aNDF was in D16 followed by D15 and D14 and the lowest in D17, followed by D18 and D19. The ADF was more than 200 g/kg in all the diets, maximum being in D2. Gross energy content (MJ/kg) varied from 17·7 to 19·7 with an average of 18 (Table 3). The digestibility of nutrients and the nutritive value of the diets are presented in Table 4. Maximum dry matter (DM), GE and ADF digestibility coefficients were recorded in D10, D11 and D12 containing maximum concentrate (0·82). Lowest dry matter digestibility (DMD) of 0·62 was in sole alfalfa (Medicago sativa) diet (D9). Maximum crude protein digestibility (CPD) was in D11 and the lowest in D16. The aNDF digestibility coefficients of D10, D11 and D12 could not be estimated. Among the diets, D11 contained maximum total digestible nutrients (TDN) (804 g/kg); it was very similar to D10, D14 and D15 (795 g/kg) and lowest was in D3. Metabolizable energy (MJ/kg DM) was more than 10 in all the diets, with the maximum being in D17. The difference in the digestibility and the nutritive value of different diets are not discussed further. Methane productions from the diets are discussed in relation to their nutritional composition.
Component digestibility (as a coefficient) in goats and nutritive value of experimental diets

Values represent mean of the triplicate analysis.
* For aNDFD (d.f.=45).
† aNDF digestibility was not estimated.
D1–D19, diets 1–19 fed to goats during the RC studies; DMD, dry matter digestibility; OMD, organic matter digestibility; CPD, crude protein digestibility; EED, ether extract digestibility; aNDFD, neutral detergent fibre digestibility; ADFD, acid detergent fibre digestibility; GED, gross energy digestibility; TDN, total digestible nutrients (in proportions); DE, digestible energy; ME, metabolizable energy.
Methane production from different diets
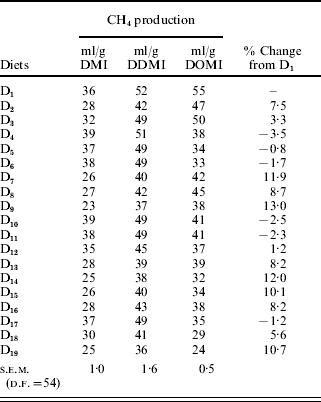
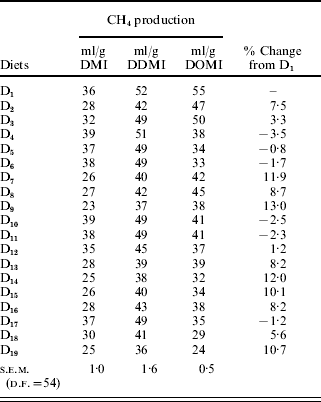
Methane production by goats measured in the RC is presented in Table 5. Autocorrelation at lag 1 and lag 2 levels for all the 19 diets were statistically non-significant. The Box–Ljung statistical method (Ljung & Box Reference Ljung and Box1978) to test the independence of serial measurement based on 19 diets indicated that they were not statistically significant, thereby confirming independence and homogeneity of variance between times or, in other words, methane output measured from successive diets from each goat were independent. To have a relative estimate of methane emission by Japanese goats fed different diets, it was assumed D1 containing 0·70 timothy hay+0·20 maize+0·10 SBM with 130 g CP/kg and 18 MJ of GE, as the standard (control) diet. This is the diet usually fed to goats in commercial farms. The methane output recorded in goats fed D1 was 35·8 ml/g DM or 0·008 of GE. Addition of SPVS resulted in a 7·5% reduction (P<0·016) in methane output, when compared with D1. However, when SPVS was treated with formic acid there was no significant (P=0·145) effect on methane output.
Methane production in Japanese goats measured inRC fed different diets
P<0·05.
D1–D19, diets 1–19 fed to goats during the RC studies.
DMI, dry matter intake; DDMI, digestible dry matter intake; DOMI, digestible organic matter intake; GE, gross energy.
Methane emission in goats fed diets D4–D6 containing 0·50 of concentrate mixture+0·25 each of timothy hay and alfalfa hay was similar (P>0·05) to that of D1. This trend was also seen in diets D10–D12 containing 0·82 concentrate and 0·18 of timothy hay (Table 5).
When alfalfa hay constituted the major part (850 g/kg) of the diet (D7–D9), there was a significant (P<0·05) reduction in the methane output. Goats produced minimum amount (23·03 ml/g dry matter intake (DMI)) of methane, when they were fed with sole alfalfa diet (D9). The reduction was approximately 13%, when compared with D1. When brewers' grains were added to timothy hay (0·60)- and maize (0·25)-based diet, then methane emission was also reduced. Maximum CH4 reduction (12%; P=0·025) was recorded in freeze-dried brewers' grains (D14) when compared with those dried at 60°C D15 (10%; P=0·044) or 130°C D16 (8%; P=0·079). Addition of pumpkin (0·35 D13) also reduced the methane output (8%; P=0·052), in goats, when compared with that of D1 (Table 5).
Methane output recorded in goats fed D17 was similar, whereas it was significantly lower (P<0·087) in D18 and D19 (P<0·029); the reduction was 5·6 and 10·7%, respectively, when compared with D1. These three diets contained 0·68 of concentrate and 0·16 each of timothy hay and alfalfa hay.
The correlation between CH4 production (ml/g) with organic matter (OM) and ADF content of the diet consumed were −0·13 and −0·63, and when they were expressed as a proportion of GE, it was −0·13 and −0·55.
Comparison of measurement techniques
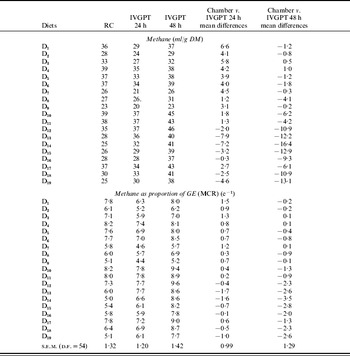
Methane production (ml/g DM and proportion of GE) from all the diets measured in the RC and that estimated by IVGPT are presented in Table 6. When IVGPT was taken as a single treatment the values were similar to the chamber in D1–D2, D5–D9 and D11. However, when CH4 production from individual diets measured in the RC was compared with that estimated from the gas collected after 24 h IVGPT incubation, it was lower from D1–D6 and D17; similar from D7–D12 and D15, D16 and D18 and higher (P<0·0001) from D13, D14 and D19. The trend was similar when expressed as a proportion of GE or methane conversion rate (MCR). However, after 48 h of incubation it was similar to that measured in RC from D1–D9 and (P<0·0001) higher from D10–D19. The correlation coefficient between the CH4 produced (ml/g DM) after 24 h in vitro incubation and the nutritive composition of the diets were: −0·55 DM; −0·52 OM; −0·42 aNDF and −0·84 ADF and with the digestibility of nutrients were 0·87 DMD; 0·79 OMD; 0·57 ADF digestibility (ADFD) and 0·83 TDN.
Comparison of CH4 production in Japanese goats measured in RC with that estimated by IVGPT at two intervals

D1–D19, diets 1–19 fed to goats during the RC studies.
IVGPT 24 h, IVGPT conducted up to 24 h; IVGPT 48 h, IVGPT conducted up to 48 h.
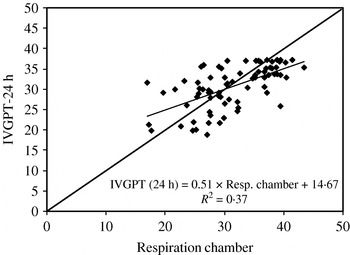
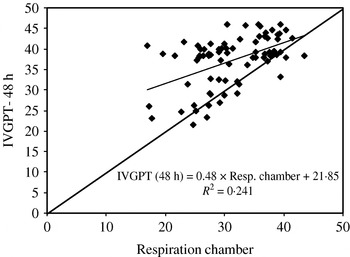
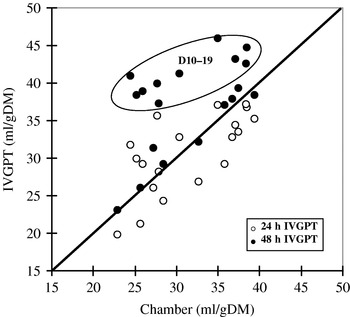
It was observed that a simple comparison between the two methods shown in Fig. 1 (R 2=0·37) and Fig. 2 (R 2=0·24) is very weak. The difference recorded in the CH4 production estimated by IVGPT with that of RC was attributed to the fibre fractions of the diets. Average ADF content (g/kg) from D1–D9 was 292, whereas it was 247 from diets D10–D19. Similarly, coefficients of digestibility for DM, OM and TDN of D1–D9 were 0·69, 0·71 and 0·679, respectively, whereas they were 0·72, 0·78 and 0·774 in D10–D19, respectively. The fermentation of diets (D1–D9) was comparatively slow to start with, due to higher structural carbohydrate content that resulted in lower gas volume and subsequently lower methanogenesis in the initial stages of fermentation; whereas it was opposite in the case of D10–D19. The in vitro gas volume indicated that in those diets containing low fibre and with high digestibility, onset of fermentation was quick resulting in higher total gas production and hence CH4 output, whereas the reverse was true in diets containing higher ADF with lower digestibility. However, after 48 h of incubation the CH4 estimated by IVGPT was higher from D10–D19 as compared with that measured in RC (Fig. 3). This was due to the degradation of fibre components and subsequent methanogenesis. To confirm this, an analysis using ADF as covariate was performed. The covariate analysis indicated that ADF was statistically significant (P<0·001) R 2=71·0 and (P<0·001) R 2=62·2 after 24 and 48 h IVGPT, respectively.
Regression graph showing the comparison of methane output measured in respiration chamber (RC) with that estimated after 24 h IVGPT. 24 h IVGPT: in vitro gas production test carried out for 24 h. Covariate analysis: 24 h IVGPT v. respiration chamber, with acid detergent fibre (ADF) as covariate. ADF was statistically significant (P<0·001) R 2=0·71.

Regression graph showing the comparison of methane output measured in RC with that estimated after 48 h IVGPT. 48 h IVGPT: in vitro gas production test carried out for 48 h. Covariate analysis: 48 h IVGPT v. respiration chamber, with ADF as covariate. ADF was statistically significant (P<0·001) R 2=0·622.

Comparison of CH4 production (ml/g DM) by goats measured in RC with that of CH4 estimated after 24 and 48 h IVGPT. IVGPT: in vitro gas production test. D10–19: diets 10–19.

The output of CH4 from D1–D9 ranged from 118 to 165 ml/l (mean 134) of total gas produced after 24 h of in vitro incubation and 131 to 187 (mean 161) after 48 h; whereas it ranged from 154 to 175 ml/l (mean 164) after 24 h and 165 to 210 (mean 196) after 48 h from D10–D19.
DISCUSSION
It has been recognized that CH4 is a potent greenhouse gas and CH4 production from ruminants contributes about 0·15 to global atmospheric CH4 flux (Moss et al. Reference Moss, Givens and Garnsworthy1994). Since CH4 is a loss of biological energy to rumen microbes as well as the host ruminant, reducing CH4 energy losses would in turn increase feed conversion into animal products such as milk, meat and wool. Results of the current RC study showed considerable variation in the proportional CH4 production in adult goats fed diets varying in nutritional composition. Quantity and quality of feed consumed by animals have a major effect on the CH4 production because individual VFA proportion in the rumen is influenced by roughage: concentrate ratio (Fahey & Berger Reference Fahey, Berger and Church1988), nature and rate of fermentation of carbohydrates (Johnson et al. Reference Johnson, Ward, Ramsey and Kornegay1996). Roughage-based diets favour acetate production and increase CH4 production per unit of fermentable OM (Johnson & Johnson Reference Johnson and Johnson1995). Methane production recorded from the sole alfalfa (D9) was the lowest among all the diets. According to Varga et al. (Reference Varga, Tyrell, Waldo, Huntington, Glenn, Moe, Tyrell and Reynolds1985) CH4 yield from leguminous forages were lower than from grass forages due to the type of carbohydrate present. When mixed diets were fed to animals (as in the present study) quantity of CH4 produced depends on the level and type of grain in the diet and fermentation that result. Diets D4–D6 contained 0·50 of concentrate; D17–D19 contained 0·68 and D10–D12 contained 0·82 of concentrate. The composition of the concentrate mixture of different diets is given in Table 2.
The corresponding CH4 output (average ml/g DMI) from these groups was 26·5, 37·9, 30·9 and 37·3, respectively. Increased concentrate portion in the diet also resulted in increased digestibility (Table 4); hence, there was no significant (P>0·05) reduction in the CH4 output at higher concentrate level (0·82 in D10–D12) when compared with D1 (Table 5). However, lower CH4 production from diets containing 0·68 of concentrate was attributed to the reduced ADF digestibility, which could be possibly due to the fat contents in D18 (P=0·087) to D19 (P=0·029). Fat content (g/kg) in these diets ranged from 61 to 75 and hence ADFD was also comparatively lower. Dietary fats were reported to have a suppressing influence on CH4 emission (Lee et al. Reference Lee, Lee, Kim, Oh, Kim, Kim and Kim2003). However, quantity, degree of unsaturation and chain length of the lipid affects CH4 output (Blaxter & Wainman Reference Blaxter and Wainman1964).
The correlation between DMD and CH4 production was 0·8 among all the diets. Blaxter & Clapperton (Reference Blaxter and Clapperton1965) calculated that the relationship between CH4 emission and digestibility was dependent on intake level. When feed was given at low levels of intake, CH4 emission increased with digestibility (similar to current observations), whereas with high intakes CH4 emission fell as digestibility increased. Thus, while the weight of evidence supports reduction of CH4 by increasing the ratio of cell wall to soluble carbohydrate in the diet, the impact of carbohydrate type on CH4 production was complex. Absence of any significant effect of carbohydrate source on CH4 production in the current study was attributed to the lower level of feeding (1·1 M).
Addition of by-products SPVS (D2) (P<0·016) and pumpkin (D13) (P<0·052) contributed to a reduced CH4 emission in goats when compared with that of D1. The reduction was on average 7·5% (range 5·9–9·1) with SPVS and 8·2% (range 6·5–9·9) with pumpkin as compared with that of D1 (Table 5). Although there was no adverse effect (P>0·05) of these compounds on DMD, NDF and ADF digestibility were reduced in D13. There were no earlier reports about the effect of these by-products on methanogenesis in goats. The exact reasons/factors responsible for CH4 suppression are yet to be identified. Further studies are required to determine the specific factors/moiety responsible for anti-methanogenic property in these compounds, so that they could be incorporated as cheaper dietary supplements to inhibit methanogenesis in ruminants.
Incorporation of brewers' grains in the diet (D14–D16) reduced CH4 emission (P<0·01) from goats compared with D1. Maximum CH4 suppression of 12·0% (range 10·2–13·8; P=0·025) was recorded in freeze-dried material (D14) when compared with those dried at 60°C (10·0%; range 8·90–11·1 in D15; P=0·044) or 130°C (8·0%; range 6·80–9·20 in D16; P=0·079). Although there was no (P>0·05) adverse effect of brewers' grains addition on DMD, NDF digestibility was reduced. Wainmann et al. (Reference Wainman, Dewey and Brewer1984) observed that fermentation of brewery and distillery products containing readily available fibre resulted in half to one-third of CH4 production compared with that seen with common feedstuffs of comparable digestibility. However, Sullivan & Martin (Reference Sullivan and Martin1999) and Lila et al. (Reference Lila, Mohammed, Yasu, Kurokawa, Kanda and Itabashi2004) failed to find any effect of live yeast preparation on CH4 production. Newbold & Rode (Reference Newbold, Rode, Soliva, Kreuzer and Takahashi2006) reported that yeast did have an effect on rumen methanogenesis (an average decrease in CH4 of 27·0%); effects were dependent on the yeast used and were highly variable (ranging from no effect to a 5·0% decrease in daily CH4 output). Beever (Reference Beever, Forbes and France1993) suggested that the partitioning of degraded DM between microbial synthesis and fermentation products was responsible for the alteration in the pattern of hydrogen production and hence methanogenesis.
The relationships between CH4 emission measured in RC (ml/g DM) and DMI, organic matter intake (OMI) (−0·60), GE intake (GEI) (−0·64) and digestible organic matter intake (DOMI) (−0·57) were negative. The trend was similar when expressed as proportion of GE (−0·60 DMI, −0·61 OMI, −0·60 GEI and −0·57 DOMI). Johnson & Johnson (Reference Johnson and Johnson1995) noted that CH4 loss as per cent of GEI declined by 0·02 for each multiple increase of intake; caused mainly by the rapid passage of feed out of the rumen (Mathison et al. Reference Mathison, Okine, Mcallister, Dong, Galbraith and Dmytruk1998; Hegarty Reference Hegarty2001). However, the extent to which intake levels affect passage rate of roughages is proportionally less than with concentrate or mixed diets (Mathison et al. Reference Mathison, Okine, Mcallister, Dong, Galbraith and Dmytruk1998). Benchaar et al. (Reference Benchaar, Pomar and Chiquette2001) reported an increase in CH4 with increasing DMI, irrespective of the diet type (100 alfalfa v. 30:70 alfalfa/concentrate mixture). However, when CH4 was expressed relative to GEI or digestible energy (DE), CH4 yield decreased when DMI was increased, similar to the findings in the current study.
In earlier studies, Shibata et al. (Reference Shibata, Terada, Iwasaki, Kurihara and Nishida1992) recorded 27·1 ml CH4/g DMI from Japanese male goats at around 1·5 maintenance feeding level. Moss (Reference Moss, Takahashi and Young2002) reported 31·0 ml/g DMI in sheep. IPCC (2000) recommendation for estimate of methane emission is 7% GE in mature sheep. The CH4 produced from goats in the present study fed a range of diets was 14·4 litres/day or 30·8 ml/g DMI or 38·4 ml/g DOMI. The variations recorded (range 23 ml/g to 39 DMI or 0·05–0·08 of GE) in CH4 production clearly render prediction equations that assume constant relationships of CH4 production less useful. A similar observation was also made recently by Blummel et al. (Reference Blummel, Givens and Moss2005) after comparing CH4 emission from straw-fed sheep in open circuit RC with that predicted by fermentation characteristics measured by IVGPT.
Comparison of CH4 production measured in RC with that estimated by IVGPT
It is well established that goats (browser) are more resistant to dietary intake of tannins than sheep/cattle (grazer) (Silanikove et al. Reference Silanikove, Gilboa, Perevolotsky and Nitsan1996) and tannins are reported to suppress methane emission in ruminants (Hess et al. Reference Hess, Tiemann, Noto, Carulla and Kreuzer2006). Since none of the diet samples contained any known source of tannin, it was presumed that source of rumen inoculum (cattle in the current study) was not a contributing factor for the variation in the methane estimated by IVGPT when compared with that produced by goats in RC.
The proportion of CH4 increased as the incubation time increased, suggesting that slowly digestible fraction of feed was associated with higher CH4 production. Although the proportion of CH4 in the total gas increased with time of incubation, the actual amount of CH4 produced was much higher during the first 24 h of incubation. It was 26·2 ml/g from D1–D9 after 24 h of incubation and 36·9 ml/g from D10–D19 with average being 31·6 ml/g DM. However, CH4 produced after 24 h incubation averaged 0·81 of the total CH4 produced after 48 h of incubation from all the diets (D1–D19). There were two salient observations, in those diets containing higher proportions of easily fermentable carbohydrates (non-fibrous carbohydrate and hemi-cellulose); CH4 output estimated after 48 h IVGPT was higher than that measured in the RC, whereas in diets containing higher proportions of structural carbohydrates, CH4 estimated after 48 h-IVGPT was very close to that measured in chamber (Fig. 3). After comparing the CH4 emission measured by SF6 technique in cattle with that estimated by IVGPT Bhatta et al. (Reference Bhatta, Tajima, Takusari, Higuchi, Enishi and Kurihara2006) also reported similar findings.
In the current study, goats were fed at maintenance level (1·1 M) and since a large part of the ruminant population would be fed at above maintenance levels, future experiments are recommended on the comparative studies of those diets with IVGPT. Further, the present study focused on mixed diets, results might differ with very high concentrate/roughage diets when the VFA profile changes substantially.
CONCLUSIONS
The CH4 production measured in the open circuit RC from goats fed at 1·1 M diets differing in nutrient composition ranged from 22·9 to 39·4 with the average being 14·4 litres/day or 30·8 ml/g DMI or 42·3 ml/g DDMI. When it was expressed as a proportion of GE it ranged from 0·0502 to 0·0819, with an average of 0·0665. Addition of by-products like SPVS, pumpkin and brewers' grains in the diet suppressed CH4 emission. Although composition of the diets had a significant effect on methane emission, methane output estimated by IVGPT was very close to that measured in the chamber demonstrating that this system could be used to estimate the CH4 production potential from diets to generate a database and also to plan mitigation strategies in small ruminants to improve their performance as well as to reduce the greenhouse gases. However, further in vitro studies are recommended in feed samples from small ruminants fed at higher levels of intake.
The study was supported by the Global Environment Research Fund from the Ministry of Environment and the research fund from the Ministry of Agriculture, Forestry and Fisheries of Japan. R. Bhatta is grateful to the Japan Society for the Promotion of Science for awarding the JSPS postdoctoral research fellowship under which this work was undertaken. Appreciation is extended to the staff of the animal shed for maintaining the experimental animals. The authors also thank Dr K. P. Suresh, Scientist (Biostatistics), National Institute of Animal Nutrition & Physiology, Bangalore-560 030 for statistical advice and analysis of the data.