1. Introduction
Over the past decade, there has been a notable escalation in research that employs social media data. This increase can be attributed to the extensive engagement of more than half of the global population with social media platforms, resulting in a significant proliferation of user-generated data. Such growth has opened new opportunities for investigating the relationships between humans and their environments, as well as societal advancements. Researchers are increasingly recognizing the potential of digital technologies to reveal and analyse the interactions among individuals, the environment and society. In disciplines such as environmental studies and development, scholars are progressively utilizing these data sources to examine natural-human systems and cultural ecosystem services.
The attainment of the previously stated objective will require comprehensive, multinational efforts, along with the collection of detailed data to tailor sustainability initiatives effectively. Social media data have provided unprecedented insights into the interactions among individuals, natural populations, ecosystems and biomes across extensive geographical areas (Van Zanten et al., Reference Van Zanten, Van Berkel, Meentemeyer, Smith, Tieskens and Verburg2016; Ghermandi et al., Reference Ghermandi, Langemeyer, Van Berkel, Calcagni, Depietri, Vigl, Fox, Havinga, Jäger, Kaiser and Karasov2023). Recent studies increasingly highlight the distinctive potential of social media data for analysing the temporal dynamics of social-ecological interactions and environmental changes. For instance, Calcagni et al. (Reference Calcagni, Amorim-Maia, Connolly and Langemeyer2019) identified social media platforms as valuable data sources for revealing the diverse values individuals ascribe to the environment, as well as for illustrating the relational aspects inherent in various cultural ecosystem services values. By utilizing explicit location data and extracting latent demographic insights from location-based social media data, Luo et al. (Reference Luo, Cao, Mulligan and Li2016) investigated the spatiotemporal patterns of human mobility, with a particular focus on demographic influences. While existing empirical research has primarily focused on the impact of various forms of media data on consumer perceptions and decision-making processes, there has been limited exploration of the influence of consumer reviews on business performance, especially within the context of sustainable companies.
Online reviews constitute a significant component of social media data. These reviews represent the evaluations, opinions and sentiments of consumers regarding products or services that are shared on the Internet. Characterized by their anonymity, real-time nature, interactivity and extensive reach, online reviews not only encapsulate the genuine experiences and emotions of consumers but also serve as a critical foundation for consumer decision-making. Furthermore, online reviews play a pivotal role in shaping corporate image and enhancing service quality. By analysing and extracting insights from online reviews, companies can gain a deeper understanding of consumer needs and preferences, thereby optimizing their products and services and bolstering their competitive position in the market. Given their broad dissemination and influence, online reviews can rapidly generate attention and discourse on social media platforms. Positive reviews can bolster a company’s image and reputation, attracting a greater number of potential consumers, whereas negative reviews may instigate consumer apprehension and dissatisfaction, adversely affecting the company’s sales and brand perception. This study aims to explore the impact of online reviews on the performance of environmental protection companies, focusing on analysing the fundamental factors that affect the professional level of evaluators. In the subsequent sections, we will review the relevant research literature pertaining to this topic. Three key areas of focus are particularly pertinent to this discussion:
• The role of social media for sustainability. Values related to ecosystem services are increasingly assessed to highlight the importance of natural assets for sustaining human wellbeing through land-use planning, environmental decision making and ecosystem-based management (Dickinson and Hobbs, Reference Dickinson and Hobbs2017). Often, non-monetary, participatory and deliberative valuation approaches are proposed to account for the multidimensionality of relational values ascribed to ecosystem services. Some representative works, such as Kenter et al. (Reference Kenter, O’Brien, Hockley, Ravenscroft, Fazey, Irvine, Reed, Christie, Brady, Bryce and Church2015); Fischer and Eastwood (Reference Fischer and Eastwood2016) and Riechers et al. (Reference Riechers, Barkmann and Tscharntke2016), possess limitations regarding sample representativeness, as these participatory methods often rely on active engagement, which may inadvertently exclude specific social groups or fail to capture the full spectrum of public values. To overcome these limitations, revealed values are increasingly derived from more widely representative social media. Although much of the massive data that users share on these platforms is not directly related to environmental research, the analysis of text, photos, videos and other media may provide a kind of a unique perspective. For instance, Kolstoe et al. (Reference Kolstoe, Vander Naald and Cohan2022) used data from a representative sample and a sample from social media to investigate how willingness to pay for increased cultural use of an ecologically unique site differs across the two groups. Lingua et al. (Reference Lingua, Coops and Griess2022) aimed to develop a method to characterize cultural ecosystem services provisioning via convolutional neural networks deployed on geotagged images taken in the study area. Some of the latest related tasks are using crowdsourced data (Schirpke et al., Reference Schirpke, Meisch, Marsoner and Tappeiner2018; Ghermandi et al., Reference Ghermandi, Depietri and Sinclair2022), and using remote sensing data (You et al., Reference You, Zheng, Chen, Xu, Lin, Gan, Zhu, Deng and Wang2022; Lingua et al., Reference Lingua, Coops and Griess2023).
• The impact of online reviews on corporate performance. In an article that appeared in Forbes, Amazon’s chief executive officer states that the presence of online reviews gives rise to product meritocracy; that is, an inferior product cannot prevail in the presence of a ‘good’ review system because of the increased transparency regarding product quality (Forbes, 2017). Recent surveys have also shown that consumers trust and rely on online reviews more than they do on website recommendations and experts opinions (Magnani, Reference Magnani2020). The online review is of great importance that can force companies to reconsider their initial decisions, which is not similar to the traditional results of direct investment by companies (Song et al., Reference Song, Gu, Su, Tanveer, Peng, Gao, Wu and Zeng2023). Therefore, many scholars have carried out relevant research on this topic. For instance, Li et al. (Reference Li, Gopinath and Carson2022) examined how online customer reviews for one generation of a product affect sales of another generation in the same product series. Abdullah et al. (Reference Abdullah, Van Cauwenberge, Vander Bauwhede and O’Connor2022) examined the impact of selected characteristics (rating, volume and variability) of online user-generated reviews on the bottom-line profitability of restaurants. Mousavi et al. (Reference Mousavi, Hazarika, Chen and Razi2021) investigated how Q&As and product reviews jointly affect two aspects of product performance (product rating and sales rank). Tian and Yang (Reference Tian and Yang2023) investigated the impact of online customer reviews on iterative innovation of software products and the moderating roles of product complexity in the process of online reviews influencing product iterative innovation. In addition, there is some theoretical work exploring the impact of online reviews on the companies’ performance. For instance, Shin et al. (Reference Shin, Vaccari and Zeevi2023) investigated how the pricing policy of a revenue-maximizing monopolist was influenced by the social learning dynamics of customers who use online reviews to estimate the quality of the product. Papanastasiou and Savva (Reference Papanastasiou and Savva2017) investigated how the presence of social learning affects the strategic interaction between a dynamic-pricing monopolist and a forward-looking consumer.
• Differentiating characteristics of online reviews. Different review features (such as sentiment, review length and reviewer credibility) can influence users’ decision-making process. Users are more inclined to refer to reviews that match their needs and preferences. Differentiated reviews can provide multi-angle information to help potential consumers fully understand the pros and cons of a product or service. For instance, Pooja and Upadhyaya (Reference Pooja and Upadhyaya2024) highlighted the importance of online review credibility, and a holistic understanding of the construct of ‘online review credibility’ will help understand what factors lead consumers to believe in the credibility of online reviews. Brand and Reith (Reference Brand and Reith2022) suggested the need to examine the credibility of online reviews in a cross-cultural context. Azer et al. (Reference Azer, Anker, Taheri and Tinsley2023) conducted two experimental studies that show how the race of online consumer reviewers influences other consumers’ interpretation of the quality of the reviews. There is also some other work that distinguishes the heterogeneous performance of online reviewers. For instance, Yousaf and Kim (Reference Yousaf and Kim2023) examined the relationship of dark personality traits of narcissism, Machiavellianism and psychopathy with online review generation, consumption and distribution. Wang et al. (Reference Wang, Ali, Tauni, Zhang and Ahsan2022) examined the relationship between hedonic shopping motivations and compulsive online buying and investigated gender differences using gender theories. In addition, for more information about the characteristics and complexities of online reviews, a recent research review by Zheng (Reference Zheng2021) systematically reviews the various dimensions of online consumer reviews.
In order to address existing gaps within this domain, the present study aims to examine the impact of online reviews on the performance of environmental companies. The central question here is: Can the expertise of online reviewers help to improve the performance of environmental companies? To answer this question, the assumptions and methods we use here are as follows:
(1) We first assume a two-stage product cycle to portray the diffusion process of online comments through social learning. The reason for the two-stage cycle is that we can focus on characterizing consumers’ choice and review behaviours in the first stage, and in the second stage, the remaining people learn about the reviews in the first stage through social learning and decide whether to participate in the purchase. Obviously, consumers can buy directly in the first stage, or they can wait for consumers in the first stage to give information about the product experience before buying in the second stage. However, the consequence of delayed choice is that the value of the product decreases, which is done to portray the cost effect of social learning.
(2) The second key to the model here is the assumption about heterogeneous consumers. This assumption is relatively natural, but the heterogeneity here is mainly reflected in consumers’ ability to identify products. In terms of product quality, if consumers who comment online can accurately discover the true value of the product, then their knowledge and experience level is relatively high, and vice versa. We also define it in the empirical part of the model, such as expert or layperson. (It is also possible to give a more detailed classification of people according to their experience level, which we will illustrate in the empirical section.)
(3) The last part is about the investment decision of companies on product quality. Here we consider the performance of environmental concerning companies, so without loss of generality, we assume that it is the investment level in environmental products. This process occurs before the two-stage model, that is, the enterprise needs to have certain expectations about consumer choices and product sales, and then make investment level decisions to achieve the maximum profit in the production cycle.
Through the above three parts, we have constructed a three-stage model. In the first stage, the enterprise invests in product quality. In the second stage, some consumers purchase the product and leave online reviews. In the third stage, the remaining potential consumers read the review information and decide whether to buy it. Finally, the market is cleared, and the enterprise and consumers obtain their respective utility. Since we have endogenously incorporated corporate investment and consumer behaviour into a multi-period model and considered the heterogeneity of consumer knowledge and experience, it is possible to analyse and comment on the impact of consumer experience levels on corporate investment decisions.
Employing this three-stage model, we can determine the optimal investment levels for the company through the method of backward solution. The findings indicate that feedback from consumers with specialized knowledge is especially advantageous for environmentally conscious companies in terms of investment decisions and performance enhancement. This is more obvious when the product quality is higher, and the proportion of experts in the reviewers is higher. Empirical analysis is conducted utilizing data from 125 stock forums associated with prominent listed environmental companies in China, encompassing a total of 348,970 expert reviews and 4,052,836 non-expert reviews, alongside an evaluation of their sentiments. The empirical findings substantiate the aforementioned theoretical predictions, suggesting that companies can mitigate the externalities associated with their environmental practices through the utilization of media data.
Additionally, alterations in the products and services provided by these companies affect market demand and resource allocation, thereby aligning with the Environmental, Social and Governance (ESG) framework (Halbritter and Dorfleitner, Reference Halbritter and Dorfleitner2015; Matos, Reference Matos2020). ESG involves the three core dimensions for measuring a company’s sustainable development performance. The ESG concept is promoted by multiple social participants. Among them, the United Nations and its related agencies have played an important role. In addition, government agencies, industry associations and environmental protection organizations have also actively participated in the advocacy and practice of the ESG concept. The reasons why companies care about ESG are diverse and far-reaching, such as enhancing brand image and reputation, and attracting more consumers and investors with environmental and social responsibility awareness. By implementing ESG strategies, companies can promote the sustainable development of themselves and the entire supply chain and create more value for the future.
In conclusion, this article makes several significant contributions to the related field:
(1) The theoretical framework of this study is closely aligned with prior works by Papanastasiou and Savva (Reference Papanastasiou and Savva2017) and Shin et al. (Reference Shin, Vaccari and Zeevi2023), which also employed a social learning framework. However, a significant distinction lies in our enhanced examination of the model’s parameters, particularly regarding the impact of consumers’ cognitive levels on companies. The complexity of the utility function and problem structure in the studies conducted by Papanastasiou and Savva (Reference Papanastasiou and Savva2017) and Shin et al. (Reference Shin, Vaccari and Zeevi2023) constrained their capacity to investigate the sensitivity of these parameters within decision-making processes. In contrast, our research simplifies and generalizes the model, thereby facilitating a more comprehensive analysis. This methodological adjustment enables us to explore how reviewers with varying levels of expertise influence the performance of a company differently.
(2) To substantiate our theoretical findings, we undertake sentiment analysis of a substantial dataset comprising online comments sourced from the primary forums of major environmental companies listed in China. Our results indicate that while both experts and laypersons most frequently cite company performance and environmental values, there are significant differences in other facets. As the proportion of experts in the review population increases, the willingness of companies to improve their products also increases, which is consistent with the foundational principles of the theoretical model. Our comparison results here also reflect the fact that the stability of environmental values can reduce the bias of experts’ subjective judgements, which is consistent with the fact that increasing information disclosure can allow experts to have a clearer understanding of the process and results of product development, increase the transparency of product development and reduce information asymmetry.
(3) In sum, our framework complements the analytical dimensions of ecosystem services research, as evidenced by the methodologies and data analysis strategies employed in studies by Schirpke et al. (Reference Schirpke, Meisch, Marsoner and Tappeiner2018); Kolstoe et al. (Reference Kolstoe, Vander Naald and Cohan2022) and Ghermandi et al. (Reference Ghermandi, Depietri and Sinclair2022), which have informed our own analytical framework.
The organization of the paper is delineated as follows. Section 2 presents the theoretical framework, whereas Section 3 addresses the empirical research and the practical implications of the model. Section 4 offers a comprehensive analysis of the limitations and draws conclusions. Furthermore, supplementary proofs and figures are available in a supplementary appendix.
2. Theoretical model
In this section, we employ a social learning model to examine the dissemination of online reviews and their influence on the decision-making processes of prospective consumers, as well as their effect on market demand, which in turn impacts firms’ investment strategies. Additionally, we take into account the diverse attributes of online reviewers, specifically their level of expertise, and investigate how this characteristic affects the purchasing behaviour of potential consumers and subsequently influences firms’ decision-making.
We consider that the quality of the environmental product mainly provided by a type of environmental enterprise is  $\hat{q}$, which is the sum of two components,
 $q$ and
 $\varepsilon$:
 \begin{equation}
\hat{q}=q+\epsilon.
\end{equation}
Component  $q$ represents the intrinsic environmental investment chosen by the firm. Due to the credence nature of environmental attributes,
 $q$ is not perfectly observable ex ante; consumers instead observe a noisy signal. In the context of our study,
 $q$ specifically denotes the product’s environmental value, which embodies its positive externalities and public good attributes, such as pollution reduction or resource conservation. This distinguishes environmental products from conventional goods, as their true value is often non-experiential and credence-based, leading to pronounced information asymmetry. Consequently, consumers heavily rely on external signals, such as online reviews, to form their quality perceptions. Component
 $\epsilon$ is an unobservable shock, which is drawn by nature from the normal distribution
 $\epsilon \sim N(0, \alpha^{-1})$. In our model, the company operator’s choice determines the product’s ex ante expected environmental value, and we refer to
 $q$ directly as the intrinsic ‘value choice’. We assume that an environmental product of expected quality
 $q$ incurs a quadratic per unit production cost
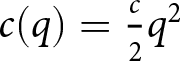 $c(q) = \frac{c}{2}{q^2}$ in which
 $c$ is the marginal unit cost. In addition, nature’s shock
 $\epsilon$ captures the ex ante uncertainty associated with the intrinsic environmental value, which may be attributed to some underlying environmental characteristics that are ex ante unobservable.
It is important to note that our model is specifically applied to environmental products. The intrinsic value  $q$ captures the environmental quality, which is characterized by two key features: (1) Credence Good Nature: The actual environmental impact (e.g., carbon footprint reduction, biodiversity protection) is often difficult for consumers to verify even after purchase, creating a higher degree of uncertainty compared to search or experience goods. In the presence of phenomena such as corporate ‘greenwashing’, lay consumers may struggle to perceive the true
 $\hat{q}$. This underscores the importance of the parameter
 $\beta$, where a higher
 $\beta$ (expertise) represents a greater ability to filter out deceptive signals and approximate the objective environmental reality. (2) Positive Externality: The consumption of environmental products generates societal benefits beyond private utility, which amplifies the importance of accurate information dissemination for social welfare.
While we use the term ‘green consumers’ in our theoretical model, in the empirical context of this study, these entities correspond to individual investors and market participants on stock forums. Because environmental performance is a credence good that is difficult to verify directly, these investors exhibit behaviour similar to that of consumers purchasing products when evaluating firm value – a high reliance on external signals (online reviews) to mitigate information asymmetry.
The potential market size of this environmental product consists of a continuum of ‘green consumers’ with total mass normalized to one, and the product is sold during a two-stage period, indexed by 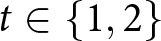 $t\in \{1, 2\}$. Each consumer may buy the product once during the entire two-stage, and a consumer who purchases the product in period
 $t$ derives a net utility:Footnote 1
 \begin{equation}
u_{i t}=\delta^{t-1}\left(\theta_i + \hat{q} - p\right),
\end{equation}
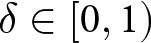
where  $\theta_i$ represents the green consumer’s willingness-to-pay for the product referred to as the consumer’s type which exists on a support
 $[0, 1]$ with the cumulative distribution function
 $G(\theta)$ and probability density function
 $g(\theta)$. We assume
 $\theta$ follows a uniform distribution
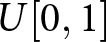 $U[0,1]$. The consumer realizes
 $\hat{q}$ only after purchasing the product. Consumers also differ in their ex post quality perceptions: conditional on the underlying quality
 $\hat{q}$, we assume that a consumer’s postpurchase environmental quality perception is the sum of true environmental value of
 $\hat{q}$ and additional white noise, namely,Footnote 2
 \begin{equation}
q_i=\hat{q}+\epsilon_i,
\end{equation}
in which  $\epsilon_i\sim N(0,\beta^{-1})$ and
 $\beta$ measures the extent of heterogeneity in consumer-specific environmental quality taste. In this context, the parameter
 $\beta$ is expected to be significant in the subsequent analysis. Intuitively, an increase in
 $\beta$ correlates with a more precise estimation of the product by consumers, whereas a decrease in
 $\beta$ is associated with a greater variance within the evaluation group, indicating a wider dispersion in product estimates. Therefore, we interpret
 $\beta$ as a proxy for the average evaluative capability of the review pool. While in reality, experts may form a subset of the population, an increase in
 $\beta$ in our model conceptually captures a scenario where the proportion of experts in the population increases, thereby raising the aggregate precision of the social signal. A higher
 $\beta$ corresponds to a scenario where consumers (experts) can identify the true quality with high precision, whereas a lower
 $\beta$ corresponds to a scenario with high uncertainty (laypersons).
Furthermore, the prevalence of fake reviews or spam in online forums effectively introduces additional noise into the signal, which corresponds to a lower  $\beta$ in our theoretical framework. Since expert accounts on these platforms undergo stringent identity verification processes, their reviews inherently filter out such deceptive noise, thereby maintaining a higher
 $\beta$ (precision) compared to the unverified layperson pool. In addition,
 $p$ is the price set for the product, and
 $\delta$ is a discount factor that applies to second-period purchases.Footnote 3
Let us reorganize the probability structure. Denote  $\hat{q} \sim N(q,\alpha^{-1}) $ as the ‘Prior Belief’ in Equation (2) for
 $t=1$. From a green consumer who chooses to purchase an environmental product in the first period, we assume that all of them can write an online review, with each review consisting of the green consumer’s ex post perception of environmental value
 $\hat{q}$.Footnote 4 In the second period, green consumers remaining in the market engage in the review-based social learning process described as follows. Let
 $m$ denote the mass of green consumers who purchase in the first period, so that the number of reviews available in the second period is also
 $m$. Green consumers remaining in the market observe the reviews and update their belief over
 $\hat{q}$ via Bayes’ rule, i.e., the ‘Updated Belief’. Given the above specifications of the green consumers’ prior belief and the review-generating process, denote
 $\mathscr{Q}=\{q_1,q_2,...q_m\}$ as the information set from the online reviews in the first stage. We do not constrain the underlying distribution of the environmental quality signal to have a particular parametric form, but we assume a linear expectation information structure, which is commonly used in the information-sharing literature. Thus, denoting the average rating
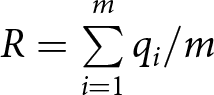 $R = \sum\limits_{i = 1}^m {{q_i}} /m$, the mean value from ‘Updated Belief’
 $q_u$ is
 \begin{equation}
q_u=\mathbb{E}(\hat{q}|\mathscr{Q}) =
\frac{{\alpha q + \beta \sum\limits_{i = 1}^m {q_i } }}{{\alpha + m\beta }} = \frac{\alpha }{{\alpha + m\beta }}q + \frac{{m\beta }}{{\alpha + m\beta }}R.
\end{equation}
In order to present our main results, two main lemmas are necessary. It is worth noting that these two results are proved in a similar way as in Papanastasiou and Savva (Reference Papanastasiou and Savva2017) and (Shin et al., Reference Shin, Vaccari and Zeevi2023). However, the difference is that our description of the utility function, Equation (2) here, is easier, so we can provide further analysis of the corresponding theoretical results. The relevant proofs are provided in Supplementary Appendix B, and the two lemmas that support these proofs in Supplementary Appendix A.
Proposition 1. Under the assumption of uniformly distributed consumer types, the optimal policy  $q^*$ satisfies
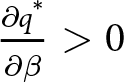 $\frac{{\partial q^*}}{{\partial \beta }} \gt 0$ if
 $\beta$ is small, or
 $\alpha, \beta$ are both large enough.
Proposition 1 elucidates the impact of consumer capabilities on the product decisions of environmental companies. As indicated in Equation (3), the parameter  $\beta$ reflects consumers’ online evaluation capabilities and cognitive levels. In general terms, consumers’ online reviews serve as a source of real-time feedback regarding product quality, performance and user experience. This feedback is instrumental for companies in comprehending consumers’ authentic sentiments and requirements concerning their products. Such insights enable companies to make timely adjustments to product design and enhance product quality, thereby aligning with market demand and bolstering product competitiveness. Conversely, through the analysis of consumers’ online reviews, companies can acquire valuable market feedback and competitive intelligence pertaining to their products. This information aids companies in understanding market trends, identifying product strengths and weaknesses and developing more effective product and marketing strategies.
An increase in the parameter  $\beta$ signifies a reduction in the variance associated with consumers’ perceptions of environmental products, indicating that their assessments are more closely aligned with the actual quality of the products. Proposition 1 suggests that when both parameters
 $\alpha$ and
 $\beta$ reach sufficiently high levels, firms are more likely to allocate resources towards enhancing product quality. The relatively elevated values of both
 $\alpha$ and
 $\beta$ imply minimal uncertainty regarding the environmental product itself. Furthermore, the evaluations provided by experts tend to be more objective, thereby allowing online assessments to more accurately represent the product’s quality.
Conversely, an intriguing finding emerges when considering lower values of  $\beta$. A diminished value of
 $\beta$ indicates a generally low evaluation standard among online product reviewers. However, as
 $\beta$ increases, the company’s quality decision, denoted as
 $q$, also tends to rise. Typically, a lower evaluation standard suggests that reviewers lack a professional comprehension of the quality of environmental products, which can adversely affect the company.
The repercussions of subpar reviews are twofold: firstly, they may mislead potential consumers, fostering a negative perception of the product that can tarnish its reputation and brand image, thereby diminishing consumer trust. Secondly, inadequate online reviews can influence corporate decision-making and strategic planning, potentially resulting in unnecessary modifications or enhancements to the product. To elucidate these findings, one might consider an extreme scenario in which the evaluation capability (or precision) of reviewers is significantly low, leading to a correspondingly low tolerance for product quality deficiencies. In such cases, even minor flaws in the product could provoke substantial dissatisfaction. Consequently, when feedback is predominantly shaped by this group, companies may justifiably reassess their investment strategies.
3. Empirical research
In this section, we will introduce our empirical process and results, which mainly include data preparation, empirical models and discussion of related results.
3.1. Data preparation and alignment
In this research, we employed two distinct types of datasets, namely the environmental protection industry index and sentiment quantitative rating data. These datasets are integral to our investigation, offering significant insights into the environmental protection sector and the sentiments associated with it. Table 4, which appears in Section 3.3.2, presents a detailed overview of the datasets, highlighting essential details and parameters that are vital for our analysis. The stock market data under consideration pertains to the share prices of prominent publicly listed companies in China that are engaged in environmental protection. These firms are leaders in the domain of environmental sustainability and significantly contribute to the nation’s initiatives aimed at fostering eco-friendly practices and technologies. The fluctuations in their stock prices serve as indicators of both their operational performance and the market’s evaluation of their environmental efforts. In this study, the ‘performance’ of environmental protection companies refers specifically to their market performance (i.e., stock price volatility and returns). We use this as a quantitative proxy to reflect how the capital market evaluates the environmental value of these firms.
In efficient markets, a firm’s stock price is a forward-looking indicator that incorporates all available public information about its future cash flows and risk profile. For environmental enterprises, their long-term viability and profitability are intrinsically linked to their environmental performance (e.g., regulatory compliance, innovation in green technology and brand reputation for sustainability). Therefore, we use the stock performance of these firms as a proxy for their environmental performance. While we acknowledge that stock prices are influenced by various market factors, for these specialized environmental enterprises, we premise that positive (negative) market reactions significantly reflect improved (deteriorated) expectations regarding the firm’s ability to create value through its environmental attributes and practices. This aligns with the ESG framework, where the environmental dimension is increasingly priced by the market. The public stock data utilized for this analysis is sourced from the Sina Finance website and encompasses a substantial timeframe, specifically from December 9, 2015, to January 16, 2024. The inclusion of such an extensive period facilitates the examination of long-term trends, variations and patterns in stock prices. This dataset provides a wealth of information pertinent to the stock prices of environmentally conscious companies, encompassing critical metrics such as opening price, closing price, highest price, lowest price, trading volume and price range. Each of these parameters offers distinct insights into market performance and behaviour, thereby elucidating trends and movements within the environmental sector. Table 1 summarizes the descriptive statistics of the main time-series variables used in the empirical analysis.
Sample description of time series

Table 1 Long description
Summary statistics describe a time series from 2015-12-10 to 2024-01-16 for an index log level, expert and lay sentiment scores, and daily review counts for each group. The index log level increases across the distribution, from 5.811 at the minimum date to 6.941 at the maximum date, with a median of 6.149 and mean of 6.293. Expert sentiment ranges from 0.0000 to 0.9893, with a median of 0.5625 and mean of 0.5666. Lay sentiment is more tightly clustered, ranging from 0.3692 to 0.5524, with a median of 0.4427 and mean of 0.4442. Expert sentiment is generally higher than lay sentiment at the quartiles and central tendency measures. Review volume is much higher for laypersons than experts throughout: medians are 1011 lay reviews versus 73 expert reviews, and maxima are 5024 versus 677. Dates shown for quartiles and extremes indicate when those summary levels occurred, but they do not by themselves establish a continuous trend between those points.
a Log_start: the logarithm of the index composed of the starting prices of the composite stocks.
b Exp: the experts’ review sentiment scores.
c Lay: the laypersons’ review sentiment scores.
d Exp_note: the number of experts’ daily reviews.
e Lay_note: the number of laypersons’ daily reviews.
The online comment data utilized in this research is derived from 125 separate stock forums within the environmental protection domain. These comments have been classified into two categories: expert reviews, which have been appropriately labelled, and layperson reviews, which have not been labelled, based on their degree of expertise. Specifically, we have designated authoritative media accounts that contribute to the Oriental Fortune Bar, as well as accounts bearing the ‘Big V’ certification mark, as expert accounts. In contrast, other standard accounts are classified as non-expert or layperson accounts. Unlike product reviews on e-commerce platforms like Amazon, discussions on these stock forums primarily focus on corporate governance, policy compliance and future profitability. Therefore, even though the sample companies are mostly business-to-business, B2B, or business-to-government industrial enterprises, the opinions expressed on these forums remain a key indicator reflecting market confidence and potential regulatory risks. Table 1 summarizes the descriptive statistics of the main time-series variables used in the empirical analysis.
The dataset encompasses a temporal range from December 9, 2015, to January 16, 2024, and comprises a significant amount of feedback. In particular, it contains 348,970 evaluations from experts and a cumulative total of 4,052,836 assessments from laypersons. Prior to undertaking sentiment analysis on reviews sourced from forums, it is imperative to engage in data preprocessing. This preprocessing encompasses several critical steps, including the removal of extraneous text and the elimination of single or multiple whitespace characters, as well as escape sequences found within HTML tags. It is noteworthy that punctuation marks such as exclamation points and question marks present in news headlines will be preserved, as they contribute to the intensity and significance of the news content. Subsequent to the preprocessing phase, the refined data is inputted into a sentiment analysis model to calculate the corresponding sentiment score. This procedure is vital for comprehending the overall sentiment articulated in the comments, thereby offering valuable insights into the perceptions and attitudes of the online community regarding environmental protection issues.
The substantial quantity of comments, along with the differentiation between expert and layperson reviews, constitutes a valuable dataset for analytical purposes. By employing sentiment analysis on this corpus, researchers and analysts can attain a more nuanced comprehension of the sentiments and opinions articulated within these forums, thereby illuminating the dominant attitudes and viewpoints concerning environmental protection. Moreover, the extensive temporal scope of the dataset facilitates the investigation of sentiment trends over an extended period, which may uncover variations in public sentiment, responses to specific events or developments, and the progression of discourse within these stock forums. This longitudinal approach enriches the analysis and offers a holistic perspective on the dynamics of sentiment within the environmental protection domain.
The extensive scope and thorough preparation of the dataset, along with the comprehensive sentiment analysis conducted, render it a significant asset for examining the sentiments and opinions articulated in stock forums dedicated to environmental protection. This analysis has the potential to provide valuable insights into public perceptions, sentiment trends and the overarching sentiment landscape within this domain, thereby enhancing the understanding of online discourse and its broader implications.
Following the completion of data cleaning procedures, we aggregated a total of 294,727 expert reviews alongside 2,677,228 layperson reviews, ensuring the validity of these datasets through rigorous verification processes. Any data identified as invalid has been excluded from our analysis. The review data have been processed utilizing the Valence Aware Dictionary for Affective Reasoning (VADER) package, resulting in transformed data represented as numerical scores within the range of [0,1]. A higher numerical score indicates a more positive emotional inclination, whereas a lower score reflects a more negative emotional inclination.
VADER is a pre-trained model specifically designed to analyse individual opinions, sentiments, evaluations and attitudes through computational assessments of polarity (positive or negative) and intensity (strength) within textual data. It employs English dictionaries to link lexical attributes with their corresponding semantic orientations (positive or negative) (Liu, Reference Liu, Indurkhya and Damerau2010). This analytical tool offers significant insights into the sentimental tendencies present in the review data, thereby enhancing our understanding of user attitudes and emotional inclinations. Through the application of VADER’s analytical capabilities, we are able to more accurately discern users’ emotional responses towards products, services, or events, which in turn provides robust support for our subsequent analyses and decision-making processes.
3.2. Empirical model
In this section, we introduce the application process of the empirical model, mainly including correlation tests, model selection criteria and related results.
3.2.1. Correlation test
The correlation test helps us assess the significance of the relationship between the environmental index and emotion score. It reveals the association degree between variables, guiding further research. This study employs two common synchrony metrics, including instantaneous phase synchrony and windowed time-lag cross-correlation, with results shown in Supplementary Appendix C.
• Instantaneous phase synchrony. This metric assesses the degree of synchronization between two signals. Its interpretation may be influenced by the subjective nature of data filtering at particular wavelengths, although there are theoretical rationales supporting the selection of these ranges. Figures A1 and A2 in the supplementary appendix present the results of evaluations conducted by both experts and laypersons. The findings suggest that expert assessments exhibit a higher degree of consistency with the environmental index compared to those made by laypersons. Specifically, Figure A1 illustrates that expert evaluations maintain stability, whereas Figure A2 reveals considerable variability in layperson assessments.
• Windowed time-lag cross-correlation. Time-lag cross-correlation serves to elucidate the directional relationship between two signals, exemplified by a leader-follower dynamic, wherein the leader signal prompts a response that is subsequently mirrored by the follower signal. The calculation of windowed time-lag cross-correlation facilitates this analysis. Figures A3 and A4 (Supplementary Appendix) illustrate the results obtained from expert and layperson reviews, respectively. This methodology involves the iterative computation of time-lagged cross-correlation across multiple temporal windows of the signal. Subsequently, each window can be analysed individually, or the results can be aggregated across the windows to yield a comparative score that reflects the differences in leader-follower interactivity between the two signals.
3.2.2. The generalized autoregressive conditional heteroscedasticity or GARCH model
In order to enhance the representation and prediction of the fluctuation in economic and financial time series, researchers and professionals frequently incorporate external variables into the volatility dynamics model. The GARCH model introduced by Bollerslev (Reference Bollerslev1986) is the simplest model of the GARCH-type class. Many empirical applications mainly use the GARCH model with one lag (i.e., GARCH(1, 1) model) to formulate conditional variance directly as a function of observables. The general GARCH model can be expressed in Equation (5):
 \begin{equation}
{\left\{\begin{array}{l}
{r_t} = {c_1} + \sum\limits_{i = 1}^R {{A_i}} {r_{t - i}} + \sum\limits_{j = 1}^M {{B_j}} {\varepsilon _{t - j}} + {\varepsilon _t},\\
{\varepsilon _t} = {\eta_t}{{\sigma_t}} , {\eta_t}\sim \mathcal{N}(0,1)\\
{\sigma _t^2 = k + \sum\limits_{i = 1}^p {{\alpha _i}} \varepsilon_{t - i}^2 + \sum\limits_{j = 1}^q {{\beta _j}} \sigma _{t - j}^2 \cdots \cdots }
\end{array} \right.}
\end{equation}
where  $r_t$ is the daily stock return at day
 $t$,
 $\varepsilon_t$ is the random error term,
 $\eta_t$ is a real-valued standardized innovation with mean zero and unit variance (e.g., the standard normal) and
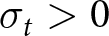 $\sigma_t \gt 0$ is the standard deviation of
 $\varepsilon_t$.
Engle (Reference Engle2002) extended the GARCH model into GARCH-X by adding high-frequency data as exogenous components in the conditional variance equation. The high-frequency data illustrate the intraday volatility of each trading day. The selection of covariates utilized in empirical investigations employing the GARCH-X model encompasses a broad spectrum of economic and financial indicators. For instance, these include forecasts for stock markets, optimization of portfolios and predictions for carbon prices (Chen et al., Reference Chen, Zhang, Mehlawat and Jia2021; Huang et al., Reference Huang, Dai, Wang and Zhou2021; Okorie and Lin, Reference Okorie and Lin2021). This paper investigates the impact of online media comments on performance of environmental enterprises. If the daily stock returns unexpectedly rise or fall, investors will increase their expectations of the variance of the next day when a GARCH-X model can be used in which X stands for the sentimental score sequence. The variance term at this can be estimated within:
 \begin{equation}
\sigma _t^2 = k + \sum\limits_{i = 1}^p {{\alpha _i}} \varepsilon_{t - i}^2 + \sum\limits_{j = 1}^q {{\beta _j}} \sigma _{t - j}^2 + \sum\limits_{l = 1}^s {{\lambda _l}} {x_{l,t - 1}}.
\end{equation}
In the above model, the variable  $x_t$ represents the exogenous component.
3.2.3. Data validation
In the following discussion, according to the standard data validation steps, we need to consider the following steps:
Stability test. The GARCH-X model requires that each variable must be a smooth time series in order to prevent pseudo-regressions. Therefore, before formally modelling for regression analysis, Augmented Dickey–Fuller (ADF) unit root tests are required for daily data. Since the original data is not a stationary series, we use the method of taking logarithms and differences. If the series is still not a stationary series after taking logarithms, we will then perform differences on it. The relevant ADF test results are shown in Table A1, Supplementary Appendix D.
Yield autocorrelation test. The premise of the Autoregressive Moving Average (ARMA) model is that the dependence between variables is manifested in the continuity of the original data in time. Therefore, an autocorrelation test is required here for the daily return data. The relevant results are shown in Table A2, Supplementary Appendix D.
Model order fixing. From the above results, it is shown that the ARMA model can be used for model analysis, and the orders of autoregression and moving average need to be further determined. The Akaike Information Criterion (AIC) is used as judgement criteria to select the optimal model. The GARCH-X model requires determining the lag order of ARCH and GARCH terms. In this paper, we try to use four models GARCH  $(m,n)$ (
 $m,n = 0,1,...,7$) combined with mean model ARFIMA, that is, the Autoregressive Fractionally Integrated Moving Average,
 $(a,b)$ (
 $a,b = 0,1,...,7$). By executing different order models, we select the best model based on the AIC value. The relevant values are shown in Table A1, Supplementary Appendix D. In addition, to assess the absolute goodness of fit of a GARCH model, additional methods can be used, such as the Adjusted Pearson Goodness-of-Fit Test, which is shown in Table A3, Supplementary Appendix D.
3.3. Results and discussion
In this section, we consider using the GARCH-X model to examine the impact of sentiment index changes on stock prices. We first analyse the overall long-time series data and then provide an in-depth discussion of the short-time series and causality aspects contained therein.
3.3.1. Long-time series
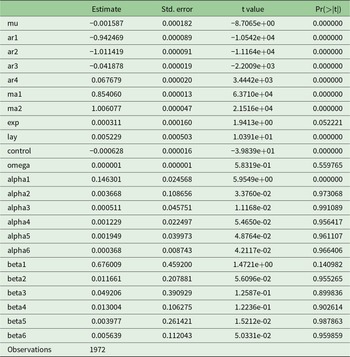
Initially, we employ long-time series data, specifically covering the period from December 9, 2015, to January 16, 2024, as our primary case study. Table 2 presents the key findings regarding stock price fluctuations in relation to the mean sentiment scores of both laypersons and experts. As illustrated in Table 2, the parameter labelled ‘exp’ denotes the estimated coefficient of the determinants in comparison to expert sentiment, while ‘lay’ indicates the estimated coefficients of the determinants relative to layperson sentiment. In this analysis, the primary control variable is the trading volume within the stock data. Initially, it is important to note that this volume exhibits no significant correlation with the stock price or its stable transformation; indeed, our calculations indicate that the correlation coefficient between trading volume and the transformed stock prices is less than 0.01. Furthermore, we posit that this variable serves as a robust proxy for  $\alpha$ in our findings, thereby facilitating the control of product quality. This assertion is grounded in the premise that increased participation in transactions enhances the dissemination of information regarding the stock’s value. The variables beta1,.., beta6 correspond to the lagged squared residuals of the model; omega signifies the intercept term of the variance model; and ar1, ar2, ar3 and ar4 represent the coefficients of the autoregressive model. Our analysis reveals that the lagged components of the model, particularly the variance term, exhibit a significant level of relevance.
Basic result for long-time series

Table 2 Long description
Regression-style output lists parameter estimates with standard errors, t values, and p values for a time-series model with 1,972 observations. The mean term mu is negative and statistically significant. Autoregressive terms ar1 through ar4 are all statistically significant, with ar1 to ar3 negative and ar4 positive, and extremely large absolute t values. Moving-average terms ma1 and ma2 are positive and statistically significant, with the largest t values in the table. The exp term is small and only marginally significant, while omega is not statistically significant. The lay term is positive and statistically significant, and control is negative and statistically significant. Among volatility-type terms, alpha1 is positive and statistically significant, while alpha2 through alpha6 are not significant; beta terms are also not significant. Very large t values suggest high precision or possible scaling effects, so practical importance should be judged alongside effect sizes, not p values alone.
The findings of this study elucidate the dual influence of sentiment values expressed by both experts and non-experts in online comments on stock prices. As illustrated in Table 2, while the coefficient for expert sentiment (exp) is positive, it exhibits marginal statistical significance (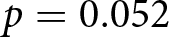 $p = 0.052$). Given our extensive sample size, this marginal result warrants careful interpretation. We posit that this attenuation is an artefact of pooling eight years of daily continuous data – a timeline that includes massive exogenous structural breaks, most notably the COVID-19 pandemic. Such macro-level shocks introduce extreme market noise that temporarily distorts the standard transmission mechanisms of expert signals. Indeed, as we will demonstrate in Section 3.3.2, when the time series is segmented to control for these structural breaks, the predictive power of expert sentiment becomes highly significant.
Furthermore, to ensure that these findings are not merely statistical artefacts of a heavily parameterized GARCH-X model operating on a large dataset, we supplement our analysis with ‘model-free evidence’ (Van Heerde et al., Reference Van Heerde, Moorman, Moreau and Palmatier2021). Relying on minimally processed data summaries provides a transparent reality check for complex models. First, our non-parametric synchrony metrics (detailed in Supplementary Appendix C) reveal a visibly higher degree of phase synchronization between expert evaluations and the environmental index compared to layperson evaluations. Second, Table 3 presents a simple, unmodelled cross-tabulation of average daily stock returns segmented by expert sentiment percentiles. This raw data summary demonstrates that days corresponding to the highest cohort of expert sentiment yield higher average returns compared to days in the bottom cohort. This straightforward, model-free observation strongly aligns with our GARCH-X estimations, confirming that the underlying positive relationship between extreme expert sentiment and market performance is robust and present within the raw data.
Model-free evidence: mean daily stock returns by sentiment cohort

Table 3 Long description
The table reports mean daily stock returns, in per cent, for three sentiment cohorts and compares results from lay reviewers versus experts. In the low-sentiment cohort (below the 25th percentile), average returns are negative for both groups: minus 0.2620 per cent for lay reviewers and minus 0.1588 per cent for experts. In the medium cohort (25th to 75th percentile), returns are slightly positive: plus 0.0314 per cent for lay reviewers and plus 0.0138 per cent for experts. In the high-sentiment cohort (above the 75th percentile), lay reviewers show a larger positive return of plus 0.0687 per cent, while experts are close to zero at plus 0.0003 per cent. Across cohorts, lay-reviewer returns increase steadily from low to high sentiment, whereas expert returns move from negative to near zero with a much smaller overall change. The values are cohort averages based on percentile cutoffs, so they summarize typical daily performance rather than guaranteeing outcomes for individual stocks or days.
Notes: Returns represent the mean daily (end-start)/start values for each cohort. Sentiment cohorts are defined by the 25th and 75th percentile cut-offs.
Despite this marginal significance in the long-term pooled data, the magnitude and nature of this influence differ. Experts, characterized by their extensive knowledge and experience, exert a comparatively moderate overall effect on stock prices. It is important to acknowledge that the ‘moderate’ impact of expert reviews may be partially attributed to the significant disparity in comment volume. Our dataset contains nearly ten times as many layperson reviews (2.67 million) as expert reviews (0.29 million). In online stock forums, the sheer ‘volume of voice’ generated by lay investors often drives short-term price momentum through herding effects, potentially overshadowing the fundamental signals provided by experts. The fact that expert sentiment remains statistically significant despite this massive volume disadvantage suggests that expert opinions possess a high marginal value and credibility, even if their aggregate market-moving power is constrained by their lower quantity. This phenomenon may be attributed to the potential disruption caused by unpredictable external events, such as the COVID-19 pandemic, which can compromise the accuracy of expert predictions over the long term. Conversely, non-expert sentiment appears to be a more potent driver of short-term market fluctuations, reflecting the irrational behaviours of investors, which may be exacerbated in the face of external shocks (Siegrist et al., Reference Siegrist, Hübner and Hartmann2018; Kaplan et al., Reference Kaplan, Cutler, Leach, Marion and Eastwood2020).
Furthermore, the research indicates that while both experts and laypersons express concern regarding corporate performance and environmental values, expert commentary tends to adopt a distinctive perspective that prioritizes collective needs, sustainable practices and a comprehensive integration of interests. For instance, experts with public responsibilities, akin to representatives of major political parties, are inclined to consider a wide-ranging and balanced array of interests, often at the expense of their own specific agendas (Faehnle et al., Reference Faehnle, Bäcklund, Tyrväinen, Niemelä and Yli-Pelkonen2014). This aligns with the principles of social environmental planning; however, it is noteworthy that expert evaluative criteria frequently overlook more intuitive and emotional aspects of residents’ assessments, such as proximity, lived experience and ambiance. This oversight suggests that reliance solely on expert criteria may not adequately encompass all evaluative dimensions (Vouligny et al., Reference Vouligny, Domon and Ruiz2009). Consequently, the influence of emotional value in online reviews on stock prices emerges as a complex and multifaceted phenomenon, necessitating a thorough examination of the distinct roles played by experts and non-experts, as well as the underlying social and cultural contexts.
This influence mechanism is notably amplified by China’s unique institutional landscape. Unlike in purely market-driven economies, the Chinese government exhibits a high degree of sensitivity towards online public discourse. Negative sentiment on stock forums is often interpreted as a ‘barometer’ for social stability and environmental compliance, which frequently triggers regulatory scrutiny. Consequently, a distinct transmission chain emerges:  $Public\ Pressure \rightarrow Government\ Attention \rightarrow Corporate\ Rectification$. This explains why our findings suggest that even B2B environmental firms, despite lacking a direct consumer-facing presence, must proactively manage online sentiment. They do so through ‘expert comments’ – defined as formal corporate responses to public inquiries or official notices – to safeguard their ‘social license to operate’. These responses are pivotal, as they simultaneously calibrate market sentiment and provide essential compliance risk assessments.
3.3.2. Short-time series
In Section 3.3.1, we investigated the impact of social evaluation sentiment scores on corporate environmental performance. However, the extensive time series presents challenges in capturing correlations over shorter intervals, which significantly hinders our ability to validate the findings presented in Proposition 1. Consequently, this section will focus on analysing the brief sequences generated by various external events to substantiate our primary conclusions. Given the extensive duration of the time series utilized in our analysis, numerous significant events, such as the COVID-19 pandemic, have transpired during this timeframe. Consequently, it is imperative to conduct additional tests to corroborate our conclusions. Our subsequent analysis will focus on shorter time series, which were selected based on specific key temporal milestones, thereby mitigating the impact of external factors associated with the longer series. We will structure our investigation into two segments: one dedicated to the fundamental detection of short-time series and the other to assessing causality in relation to our conclusions. We will analyse three distinct short-time series segments, with classifications primarily determined by the onset of COVID-19 in 2020 and the subsequent lifting of COVID-19 restrictions in China at the end of 2022. The three designated time periods are as follows: January 1, 2016 to December 31, 2019; January 1, 2020 to December 30, 2022; and December 30, 2022 to January 16, 2024.
The related results regarding 2016-01-01 $\sim$2019-12-31, 2020-01-01
 $\sim$2022-12-30 and 2022-12-30
 $\sim$2024-01-16 are illustrated in Tables 4–6, respectively. Judging from the results of three different short sequences, the evaluation of experts is obviously more significant than that of non-experts. As for the evaluation of non-professionals, the results before the epidemic (2016-01-01
 $\sim$2019-12-31) were negatively correlated with stock prices, which means that non-experts were more irrational during this period. In the second time period (2020-01-01
 $\sim$2022-12-30), the emotional characteristics of non-experts have certain rational characteristics, and their effects are more obvious than those of experts. In the last time period (2022-12-30
 $\sim$2024-01-16), non-experts showed similar characteristics to the first time period, that is, the irrational characteristics were obvious. In addition, we must make it clear that there is a Granger causal relationship between professional comment sentiment and stock prices. In fact, we selected the latest short sequence for testing, namely 2022-12-30
 $\sim$ 2024-01-16. We found that within a certain lag period, there is a bidirectional causal relationship between non-expert sentiment and stock prices, but there is a unidirectional causal relationship between expert sentiment and stock prices (expert sentiment on stock prices).
Short-time series ranges from 2016-01-01 to 2019-12-31

Table 4 Long description
The table reports model coefficient estimates with standard errors, t values, and p values for an ARMA style model with additional predictors and variance terms, based on 974 observations. The strongest effects are the autoregressive terms: ar2 is large and positive, ar1 is negative, and ar3 is positive, all with p values effectively zero. Moving average terms are also strong: ma1 is positive and ma2 is negative, both with p values effectively zero. Among added predictors, exp is positive while lay and control are negative, and all three are statistically significant with p values effectively zero. The mean term mu is positive and statistically significant. For variance related parameters, omega is not statistically significant, and alpha2, alpha3 and beta1 are also not significant, while alpha1 and beta2 are significant. Interpretation should consider that very small p values can reflect the large sample size, so practical effect sizes should be judged from the estimates as well as significance.
Short-time series ranges from 2020-01-01 to 2022-12-30

Table 5 Long description
The table reports parameter estimates from a time series model, listing each term’s estimate, standard error, t value and p value, based on 730 observations. The intercept mu is negative and statistically significant. Autoregressive terms ar1 through ar4 and moving-average terms ma1 through ma4 are all statistically significant with extremely large absolute t values; ar3 is strongly negative while ar4 is positive, and ma3 is strongly positive while ma4 is negative. The exp term is positive but only marginally significant with a p value around 0.058. The lay term is positive and highly significant, and control is negative with a small but statistically significant p value near 0.012. The variance-related omega term is positive and statistically significant. Among alpha terms, alpha1 and alpha2 are significant, while alpha3 through alpha5 are near zero and not significant. All beta terms have small t values and large p values, indicating no clear evidence they differ from zero. Interpretation should consider that very large t values can reflect large sample size or very small standard errors, not necessarily large practical effects.
The findings from our comparative analysis indicate that the association between assessor expertise and environmental performance may be influenced by a more intricate transmission mechanism. Environmental performance evaluation is widely recognized as a challenging endeavour (Arias-Arévalo et al., Reference Arias-Arévalo, Gómez-Baggethun, Martín-López and Pérez-Rincón2018; Himes-Cornell et al., Reference Himes-Cornell, Pendleton and Atiyah2018), primarily due to the complexity and subjectivity involved in assessing the benefits of ecosystem services (Costanza et al., Reference Costanza, Kubiszewski, Ervin, Bluffstone, Boyd, Brown, Chang, Dujon, Granek, Polasky, Shandas and Yeakley2011). Notably, the external environment has undergone significant changes due to the aftermath of the pandemic and the emergence of new information dissemination technologies. Upon segmenting the extensive data sequence, we observed that the informational value derived from the emotional responses of experts generally surpasses that of non-experts. This observation further substantiates the primary conclusions outlined in Proposition 1 to a certain extent.
Short-time series ranges from 2022-12-30 to 2024-01-16

Table 6 Long description
Regression-style output lists parameter estimates with standard errors, t values, and p values for 256 observations. The intercept mu is about 5.95 and is highly significant. Autoregressive terms ar1 and ar2 are positive and highly significant, while ar3 is negative and highly significant, indicating mixed lag effects. Moving-average terms ma1 and ma2 are negative and highly significant, but ma3 is near zero and not significant with a p value about 0.46. The exp coefficient is positive and highly significant, whereas lay is negative and highly significant, making them the strongest directional effects among the named predictors. Control is positive and statistically significant, and omega is small but significant with a p value about 0.019. Most alpha and beta terms are not statistically significant, with alpha4 borderline and alpha1 modest, so those effects are uncertain and may be sensitive to model specification.
Furthermore, this outcome can be examined from several additional perspectives. Firstly, during periods characterized by significant external uncertainty and volatility, such as during the pandemic, investors – including those lacking expertise – tend to exhibit heightened emotional responses. Conversely, in relatively stable and predictable market conditions, investors are more likely to engage in rational investment behaviour.
Specifically, in the initial phase, the assessments made by non-expert investors were negatively correlated with stock prices and displayed pronounced irrational tendencies. This suggests that during this timeframe, non-expert investors were particularly vulnerable to market sentiment, rumours, and other non-fundamental influences, leading to irrational investment choices.
In the subsequent phase, the emotional responses of non-experts began to align more closely with rational behaviour, and their evaluations exerted a greater influence on stock prices than those of experts. This shift may be attributed to the increased market volatility during the pandemic, prompting investors to focus more on fundamental information rather than solely on market sentiment, thereby enabling non-experts to gradually learn and adapt to these changes.
In the final phase, however, non-expert evaluations reverted to irrational characteristics reminiscent of those observed prior to the pandemic. This may be due to the gradual containment of the pandemic and the relative stabilization of the market, which could have led non-expert investors to once again become more susceptible to market sentiment, or it may be a result of emerging market factors. Specifically, the proliferation of AI-generated content and automated review summaries during this period (late 2022 to 2024) may have altered the social learning process. By aggregating or filtering individual sentiments, these technologies could obscure the direct signal from layperson reviews, potentially contributing to the observed ‘irrational’ or noisy market response, distinct from the more direct information processing observed during the height of the pandemic.
Secondly, our findings underscore the notion that the stability of environmental values may serve to mitigate the inherent biases present in expert subjective judgements. An expanding body of literature (Glasson and Therivel, Reference Glasson and Therivel2013; Zhang et al., Reference Zhang, Kornov and Christensen2018) characterizes environmental impact assessment as a value-laden process wherein subjective judgements and expert discretion significantly influence the formulation of professional conclusions. Consequently, reliance on subjective professional judgement in environmental impact assessments can result in inconsistencies, a lack of transparency and divergent conclusions and outcomes (Mehdic et al., Reference Mehdic, Gunton and Rutherford2020). To counteract the potential biases stemming from expert subjectivity, various researchers have proposed strategies such as the development of clearer guidelines and the minimization of expert disagreement (Zhang et al., Reference Zhang, Kornov and Christensen2018), as well as the implementation of more transparent information disclosure mechanisms to alleviate expert-related uncertainty (Büyüközkan and Karabulut, Reference Büyüközkan and Karabulut2018). Thus, enhanced information disclosure would facilitate a more comprehensive understanding among experts regarding the processes and outcomes associated with product development. This increase in transparency would help to mitigate information asymmetry, thereby reducing the likelihood of bias or subjective assessments within the expert cohort.
Lastly, our findings are related largely to research on the role of media comments on corporate ESG performance, and the impact of ESG information disclosure data on financial performance. Indeed, since the stock price here serves as a market-based proxy for the environmental performance of environmental companies, it can be understood to a certain extent as the company’s ESG information disclosure method (the environmental dimension). According to the ESG concept, more and more companies are disclosing ESG information and showing investors their specific practices at the three levels of environment, society and governance through ESG reports, corporate social responsibility reports and other forms. The form of media comments in this study is equivalent to a change in the external environment, and our results also correlate to the impact of certain external environmental characteristics on ESG information disclosure (Baldini et al., Reference Baldini, Maso, Liberatore, Mazzi and Terzani2018; Terzani and Turzo, Reference Terzani and Turzo2021; Huang et al., Reference Huang, Li, Lin and McBrayer2022).
Moreover, ESG information disclosure, as an important form of non-financial data disclosure, can effectively reduce information asymmetry and improve the information transparency of companies. The long-term efforts made by companies through ESG and other activities can be better perceived by investors and creditors, which has a positive impact on the enterprise whose value has a positive impact (Raimo et al., Reference Raimo, Caragnano, Zito, Vitolla and Mariani2021). In short, the value of this kind of information disclosure will be further amplified under the influence of the special external environment where social media comments exist, especially high-quality feedback from comments of experts.
4. Conclusion
This paper presents a two-stage social learning model aimed at examining the influence of social media comments on corporate decision-making, with a particular focus on the relationship between professional comments and environmental performance. By aggregating extensive data from stock forum comments, we develop a scoring system to quantify the sentiment expressed by commentators. The empirical findings corroborate our theoretical assertions, indicating that comments from both experts and laypersons on media forums can enhance corporate environmental performance, with expert commentary proving to be particularly impactful in stable external environments. Consequently, we suggest that companies can enhance their market value by implementing more effective ESG disclosure mechanisms, which would improve the precision of expert commentary.
Our theoretical framework builds upon existing literature and refines conclusions that bolster our central hypotheses. In the empirical analysis, we employ machine learning techniques to extract data from social media forums and quantify comments using statistical methods, particularly in light of the exponential growth of online data. This approach offers insights into the application of tracking large-scale market data fluctuations within corporate contexts. Methodologically, we utilize econometric models to investigate the effects of media comments on corporate environmental performance, thereby providing a nuanced understanding of the interplay between these variables. Notably, this study contributes a novel perspective and practical implications for examining the mechanisms of information transmission via social media in environmentally conscious firms.
Despite its contributions, this study acknowledges certain limitations. While the absence of viable instrumental variables precludes their use, we establish causality using Granger tests. To mitigate potential endogeneity concerns, we conducted extensive robustness checks across model specifications, data segmentations and variable selections. These tests collectively support a robust short-term causal link between expert commentary and environmental stock prices. Additionally, trading volume – while a useful proxy for information dissemination in retail-dominated markets – fails to distinguish between broad retail interest and concentrated institutional activity.
Future research should leverage more granular transaction data to isolate the specific effects of retail investor sentiment from institutional liquidity shocks. Ultimately, our subsequent research aims to design preventive mechanisms that facilitate collaborative oversight among all market stakeholders, fostering a healthier synergy between investment markets and the external information environment.
Supplementary material
The supplementary material for this article can be found at https://doi.org/10.1017/S1355770X26100680.
Funding statement
This work was supported by the National Natural Science Foundation of China (72171222).
Competing interests
The authors declare none.