





1. Introduction
In experimental settings, providing real incentives has long been considered fundamental to ensuring the reliability of results. These incentives are believed to more accurately reflect participants’ actual behaviour (Bardsley et al., Reference Bardsley, Cubitt, Loomes, Moffatt, Starmer and Sugden2010, and references therein). The most popular methods for eliciting risk-attitude in laboratory experiments are binary lottery choice tasks (Hey, Reference Hey2001) and the Multiple Price Lists (Holt and Laury, Reference Holt and Laury2002), although other approaches have been introduced in recent years (see Crosetto and Filippin, Reference Crosetto and Filippin2013, among others).
Several studies demonstrate the validity and robustness of responses obtained through self-assessment without monetary incentives, highlighting their relevance for understanding decision-making. A comprehensive review of this literature lies beyond the scope of the present study; however, a few illustrative contributions are noteworthy. In the context of pro-social behaviour, Gneezy and Rustichini (Reference Gneezy and Rustichini2000) demonstrate that monetary incentives can reduce task performance by crowding out intrinsic motivations. Building on this, Asulin et al. (Reference Asulin, Heller and Munichor2024) confirm the crowding-out effect of low monetary incentives and show that well-designed non-monetary incentives can substantially enhance performance in prosocial tasks.
Luccasen III and Thomas (Reference Luccasen and Thomas2014) compare participants’ choices in experiments where incentives consist of extra class credit points rather than cash payments, showing that non-monetary incentives can effectively motivate participants in economic experiments. Similarly, Vinogradov and Shadrina (Reference Vinogradov and Shadrina2013) find that non-monetary incentives in online experiments yield results comparable to those obtained in laboratory settings when participants, driven by curiosity and altruism, voluntarily engage in and complete the experiments, despite knowing they will receive no remuneration or prizes upon completion. In their meta-analysis on individual intertemporal preferences, Matousek et al. (Reference Matousek, Havranek and Irsova2022) show that the reported discount rate is not systematically influenced by whether individuals receive real or hypothetical rewards.
Although experimental protocols serve as a valuable benchmark by replicating decision contexts under controlled conditions, such protocols can be costly and not always feasible to implement, particularly on a large scale. Survey-based measures, by contrast, offer a scalable and cost-efficient alternative, making them especially useful for empirical research. Falk et al. (Reference Falk, Becker, Dohmen, Enke, Huffman and Sunde2018) introduce a large-scale, experimentally validated dataset measuring key economic preferences, time preference, risk preference, positive and negative reciprocity, altruism, and trust, across diverse populations worldwide. Their analysis examines the determinants of these preferences demonstrating the importance of preferences for understanding economic outcomes. Self-assessed risk measures have proven to be reliable predictors of actual risk-taking behaviours (Dohmen et al., Reference Dohmen, Falk, Huffman, Sunde, Schupp and Wagner2011; Einav et al., Reference Einav, Finkelstein, Pascu and Cullen2012; Vieider et al., Reference Vieider, Lefebvre, Bouchouicha, Chmura, Hakimov, Krawczyk and Martinsson2015). The validity of the generic risk measure is further supported by its ability to explain actual behaviour in applied settings. For instance, Bonin et al. (Reference Bonin, Dohmen, Falk, Huffman and Sunde2007) demonstrate this in the context of occupational earnings risk, while Jaeger et al. (Reference Jaeger, Dohmen, Falk, Huffman, Sunde and Bonin2010) report similar findings in the context of migration.
As the collection of self-reported measures becomes increasingly prevalent, particularly in large-scale surveys, assessing their accuracy and reliability is critical for informing decisions. This paper focuses on financial risk attitude, which plays a crucial role in understanding investment decisions and the relationship between perceived and actual risk-taking behaviour. Financial risk tolerance is defined as the highest level of uncertainty an individual is willing to accept when making financial decisions (Grable, Reference Grable2000). In efficient markets, investors anticipate higher returns for taking on greater risk. Consequently, individuals with higher risk tolerance are more inclined to invest in riskier assets in pursuit of higher long-term returns (Yao et al., Reference Yao, Hanna and Lindamood2001), thereby seeking to accumulate wealth (Neelakantan, Reference Neelakantan2010).
We use self-reported measures concerning financial risk behaviour from the Italian Survey on Household Income and Wealth (SHIW), a highly regarded and widely used survey conducted by the Bank of Italy, providing a representative snapshot of the Italian population. The SHIW has been extensively employed in numerous studies to examine various aspects of household behaviour, which underscores its reliability and significance as a data source.Footnote 1 Its widespread academic and institutional recognition further strengthens its credibility as a data source. Moreover, the prestige and authority of the Bank of Italy as the institution conducting the survey likely encourage respondents to take the questionnaire seriously and provide thoughtful, accurate answers. In addition interviewers provide a brief assessment of response reliability at the end of each interview, comparing reported information with observable indicators (e.g., neighbourhood, dwelling type, or quality of furnishings) and with national accounts, while accounting for definitional differences.
What makes this survey particularly valuable for our study is its comprehensive approach: it captures not only self-assessed financial risk attitude but also detailed information on stated resource allocation across various financial instruments. This dual perspective enables a more precise and meaningful assessment of the real financial risks undertaken by respondents.
One of the main variable of interest is the self-assessed risk attitude towards financial risk, label “RISFIN” in the survey (which will be explained in more detail later). This variable has been introduced in 2004 and it has been already used in prior studies (Deidda, Reference Deidda2013; Conte et al., Reference Conte, De Santis, Melissari, Paiardini and Temperini2024a), but to answer different research questions. Deidda (Reference Deidda2013) investigates the determinants of precautionary saving, focusing on the role of financial risk and portfolio choices in household saving behaviour. Conte et al. (Reference Conte, De Santis, Melissari, Paiardini and Temperini2024a) explore the mitigating role of financial literacy in intertemporal choices.
Throughout the paper, we refer to the survey answers on financial risk attitude as self-assessed financial risk attitude or similar. The SHIW survey collects information on the financial assets held by households and the corresponding amounts. Based on these survey responses, we construct measures of portfolio composition across asset classes. Accordingly, we refer to these variables as stated asset holdings or similar, from which portfolio shares are derived.
Along similar lines to our study, albeit using a different methodological approach, Kuzubaş and Saltoğlu (Reference Kuzubaş and Saltoğlu2024) recently examined the reliability and validity of a risk assessment questionnaire. Differently from our study, their research focuses specifically on pensioners in Turkey. Notably, the period under investigation coincides with elevated inflation and the COVID-19 pandemic, two exceptional circumstances likely to influence individuals’ risk preferences, which are not inherently stable and may be influenced by broader economic and social conditions (Schildberg-Hörisch, Reference Schildberg-Hörisch2018; Conte et al., Reference Conte, Paiardini and Temperini2025).
This paper contributes to the literature on the external validity of survey-based measures of risk attitude by linking self-assessed risk profiles to stated household investment behaviour. Drawing on multiple waves of the nationally representative SHIW, we present robust empirical evidence that self-assessed risk attitude reliably predicts portfolio allocation.
Unlike studies confined to specific settings or short observation windows, our approach explicitly considers stated investment decisions over an extended horizon. While related work has validated self-assessed measures in other contexts, such as labour markets or migration, we contribute evidence on household portfolio allocation, a key dimension of financial decision-making. Taken together, our findings support the predictive and external validity of self-assessed risk measures and contribute to the ongoing debate on the reliability of non-incentivised measures.
The reminder of the paper is organised as follows. Section 2 describes the data set and the variables of interest. Section 3 present the estimated results. Section 4 concludes.
2. Data and variables
Our data source is the Italian Survey of Households Income and Wealth (SHIW), a survey representative of the Italian population conducted by the Bank of Italy. The survey usually occurs biennially, employing a rotating panel approach where approximately half of the participants are re-interviewed in subsequent waves. It collects detailed information on demographics, incomes, savings, wealth, and other household economic and financial decisions. We employ data from all waves spanning 2004–2022, with an average of around 7,924 households surveyed per wave, distributed across all twenty Italian regions.
Our interest lies in financial investments and attitude towards financial risk. It is important to note that while investments concern the entire household, the attitude towards financial risk is only measured from the survey respondent. The person answering the survey questions is the household head, defined as the individual responsible for the household’s economic and financial matters.Footnote 2 Therefore, there is no discrepancy between the person managing household investments and the individual from whom the attitude towards risk is measured.
Guiso and Zaccaria (Reference Guiso and Zaccaria2023) define participation in financial markets as the condition where a household holds wealth in at least one of the following asset classes: Italian government bonds, other fixed income, stocks, shares of funds, and other assets (e.g., derivatives or structured products). Each investment option carries unique attributes, advantages, and potential risks tailored to various financial objectives and risk tolerance levels.
In the subsequent analyses, we focus on the subsamples of respondents who have reported having invested in at least one of these asset classes (investors’ samples). This restriction is imposed to establish a direct link between the risk level of the stated investments and their self-assessed measure of risk attitude. Table 1 displays the relative dimensions of the subsamples considered in relation to the entire sample.Footnote 3
Investors per year

Table 1 Long description
The table reports household counts by survey year for two groups: all surveyed households and the subset that invests in at least one of the financial assets covered. Full-sample counts are fairly stable around eight thousand from 2004 through 2016, then drop to 6,239 in 2020 before rising to 9,641 in 2022. Investor counts rise from 1,400 in 2004 to 1,797 in 2010, fall to 1,215 in 2016, then increase to 1,638 in 2020 and reach a high of 2,178 in 2022. The lowest investor count occurs in 2016, and the highest occurs in 2022. In most years, investors make up a minority of the full sample, with the smallest share around 2016 and the largest share in 2020. Changes across years may reflect differences in wave sample sizes as well as shifts in investing participation.
Note: The table shows the number of households in each wave (Full sample) and the number of households that invest at least in one of the financial assets considered (Investors’ sample).
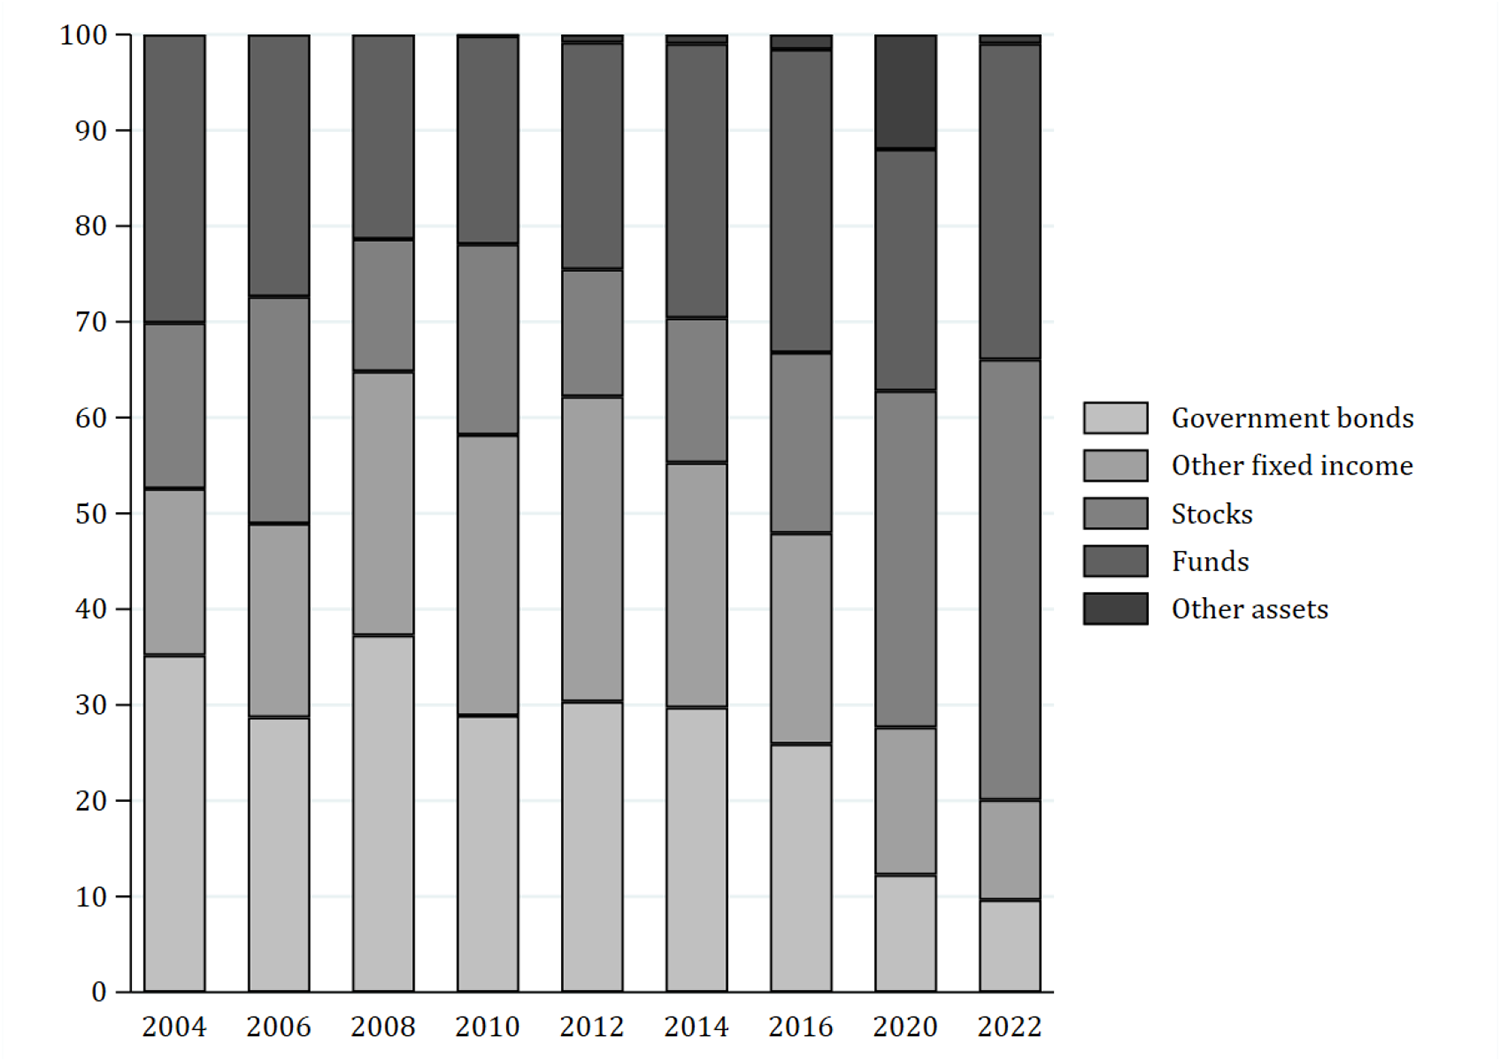
Figure 1 shows the distribution of the stated investments across different asset classes. Government bonds refers to the total amount invested in Italian government securities. Other fixed income indicates investments in bonds issued by Italian firms or banks. Stocks represents the amounts invested in shares of both listed and unlisted companies. Funds captures the value of investments in any type of fund. Other assets includes the amounts allocated to alternative instruments such as derivatives or structured products. A detailed description of the investment categories, along with the other variables employed in the analysis and their corresponding survey codes, is provided in Table A.1 in Appendix A.
Participation to financial markets by stated investments type and year

Figure 1 Long description
A bar graph with nine vertical stacked bars for years 2004, 2006, 2008, 2010, 2012, 2014, 2016, 2020 and 2022. Each bar reaches 100. Legend categories: Government bonds; Other fixed income; Stocks; Funds; Other assets. Year 2004: Government bonds 0 to 35; Other fixed income 35 to 52; Stocks 52 to 70; Funds 70 to 100; Other assets 100 to 100. Year 2006: Government bonds 0 to 25; Other fixed income 25 to 50; Stocks 50 to 72; Funds 72 to 100; Other assets 100 to 100. Year 2008: Government bonds 0 to 20; Other fixed income 20 to 38; Stocks 38 to 65; Funds 65 to 100; Other assets 100 to 100. Year 2010: Government bonds 0 to 30; Other fixed income 30 to 58; Stocks 58 to 78; Funds 78 to 100; Other assets 100 to 100. Year 2012: Government bonds 0 to 30; Other fixed income 30 to 62; Stocks 62 to 75; Funds 75 to 100; Other assets 100 to 100. Year 2014: Government bonds 0 to 30; Other fixed income 30 to 55; Stocks 55 to 70; Funds 70 to 100; Other assets 100 to 100. Year 2016: Government bonds 0 to 25; Other fixed income 25 to 48; Stocks 48 to 67; Funds 67 to 100; Other assets 100 to 100. Year 2020: Government bonds 0 to 10; Other fixed income 10 to 20; Stocks 20 to 88; Funds 88 to 100; Other assets 100 to 100. Year 2022: Government bonds 0 to 10; Other fixed income 10 to 20; Stocks 20 to 65; Funds 65 to 100; Other assets 100 to 100.
Between 2004 and 2010, the portfolio structure remained relatively stable, with a substantial share allocated to government bonds and fixed-income instruments. From 2012 to 2016, however, the share of government bonds declined sharply, likely reflecting the impact of the sovereign debt crisis, accompanied by a gradual diversification towards stocks and funds. In 2020, amid the COVID-19 pandemic, investments in funds reached their highest level in the entire period, while the share of government bonds continued to decrease. By 2022, the composition shows a clear shift towards more diversified portfolios, with a diminishing role of government bonds and an increasing weight of funds and other assets (Banca d’Italia, 2021).
3. Estimation and results
We classify respondents’ attitude towards risk into four categories according to their answers to the following question in which they are asked to self-report their level of financial risk-aversion:
In managing your financial investments, would you say you have a preference for investments that offer:
1) [Highly risk-loving] very high returns, but with a high risk of losing part of the capital;
2) [Fairly risk-loving] a good return, but also a fair degree of protection for the invested capital;
3) [Fairly risk-averse] a fair return, with a good degree of protection for the invested capital;
4) [Highly risk-averse] low returns, with no risk of losing the invested capital.
In the upcoming discussion, we will refer to the financial risk profiles identified in the question above using the labels in square brackets (added by the authors), categorised along a spectrum of increasing risk aversion. The distributions of the financial risk profiles are shown in Figure 2 for the investors’ samples and in Figure B.1 in Appendix B for the full samples.
Distribution of self-assessed risk attitude (investors’ sample), by year

Figure 2 Long description
The image showing 9 bar graphs arranged in a 3 by 3 grid, titled by year: 2004, 2006, 2008, 2010, 2012, 2014, 2016, 2020, 2022. 2004 bar graph: The horizontal axis shows four categories: Highly risk tolerant, Fairly risk tolerant, Fairly risk averse, Highly risk averse. The vertical axis shows values from 0.0 to 0.5. Bar heights are approximately: Highly risk tolerant 0.0, Fairly risk tolerant 0.15, Fairly risk averse 0.42, Highly risk averse 0.43. 2006 bar graph: The horizontal axis shows four categories: Highly risk tolerant, Fairly risk tolerant, Fairly risk averse, Highly risk averse. The vertical axis shows values from 0.0 to 0.5. Bar heights are approximately: Highly risk tolerant 0.0, Fairly risk tolerant 0.20, Fairly risk averse 0.50, Highly risk averse 0.30. 2008 bar graph: The horizontal axis shows four categories: Highly risk tolerant, Fairly risk tolerant, Fairly risk averse, Highly risk averse. The vertical axis shows values from 0.0 to 0.5. Bar heights are approximately: Highly risk tolerant 0.0, Fairly risk tolerant 0.15, Fairly risk averse 0.44, Highly risk averse 0.41. 2010 bar graph: The horizontal axis shows four categories: Highly risk tolerant, Fairly risk tolerant, Fairly risk averse, Highly risk averse. The vertical axis shows values from 0.0 to 0.5. Bar heights are approximately: Highly risk tolerant 0.0, Fairly risk tolerant 0.17, Fairly risk averse 0.43, Highly risk averse 0.40. 2012 bar graph: The horizontal axis shows four categories: Highly risk tolerant, Fairly risk tolerant, Fairly risk averse, Highly risk averse. The vertical axis shows values from 0.0 to 0.5. Bar heights are approximately: Highly risk tolerant 0.0, Fairly risk tolerant 0.12, Fairly risk averse 0.38, Highly risk averse 0.50. 2014 bar graph: The horizontal axis shows four categories: Highly risk tolerant, Fairly risk tolerant, Fairly risk averse, Highly risk averse. The vertical axis shows values from 0.0 to 0.5. Bar heights are approximately: Highly risk tolerant 0.0, Fairly risk tolerant 0.15, Fairly risk averse 0.45, Highly risk averse 0.40. 2016 bar graph: The horizontal axis shows four categories: Highly risk tolerant, Fairly risk tolerant, Fairly risk averse, Highly risk averse. The vertical axis shows values from 0.0 to 0.5. Bar heights are approximately: Highly risk tolerant 0.0, Fairly risk tolerant 0.10, Fairly risk averse 0.44, Highly risk averse 0.46. 2020 bar graph: The horizontal axis shows four categories: Highly risk tolerant, Fairly risk tolerant, Fairly risk averse, Highly risk averse. The vertical axis shows values from 0.0 to 0.5. Bar heights are approximately: Highly risk tolerant 0.0, Fairly risk tolerant 0.20, Fairly risk averse 0.45, Highly risk averse 0.35. 2022 bar graph: The horizontal axis shows four categories: Highly risk tolerant, Fairly risk tolerant, Fairly risk averse, Highly risk averse. The vertical axis shows values from 0.0 to 0.5. Bar heights are approximately: Highly risk tolerant 0.0, Fairly risk tolerant 0.20, Fairly risk averse 0.43, Highly risk averse 0.32.
We aim to map an individual’s stated risk aversion to their reported investment behaviour. We hypothesise that if individuals accurately assess and act according to their risk profile, the following trends will be consistently observed across different year:
- H1:
The proportion of financial investments in assets characterised by high risk is lower the higher the level of risk aversion.
- H2:
The proportion of financial investments in assets characterised by low risk is higher the higher the level of risk aversion.
To test our hypotheses, we select the savings and investment activities identified by Guiso and Zaccaria (Reference Guiso and Zaccaria2023) from the list included in the SHIW survey, as described in the previous section. We classify the selected assets into three categories based on their risk profiles: High-risk assets, Medium-risk assets, and Low-risk assets. The High-risk assets includes shares in listed and unlisted companies as well as other instruments, such as derivatives. The Medium-risk assets includes bonds issued by Italian firms and banks, and shares of investment funds. The Low-risk assets category consists of various Italian government bonds with different maturities.
To formally test our hypotheses, we employ Tobit regression models of the shares invested in High-risk assets and Low-risk assets. We use a Tobit model since there are several zero-investment observations but also all-in-one asset cases, which are likely to arise from corner solutions when the constraint on the invested share ( $\geq0$ and
 $\leq1$) becomes binding.Footnote 4
To test for the existence of a linear trend in the relationship between “RISFIN” and investment shares, we re-run the aforementioned regressions, treating “RISFIN” as a linear trend rather than a categorical-ordered variable.Footnote 5 The coefficient estimates on this variable provide evidence for the following:
• A positive linear trend if the coefficient is positive and statistically significant;
• A negative linear trend if the coefficient is negative and statistically significant;
• No linear relationship if the coefficient is not statistically different from zero.
The results, displayed in Table 2, show that the coefficient on “RISFIN” for High-risk assets is consistently negative and statistically significant, whereas for Low-risk assets it is positive and significant, indicating opposite associations between risk attitude and asset allocation across the two categories.
Tobit regression estimates of risk aversion linear trends in investment shares (2004–2022)
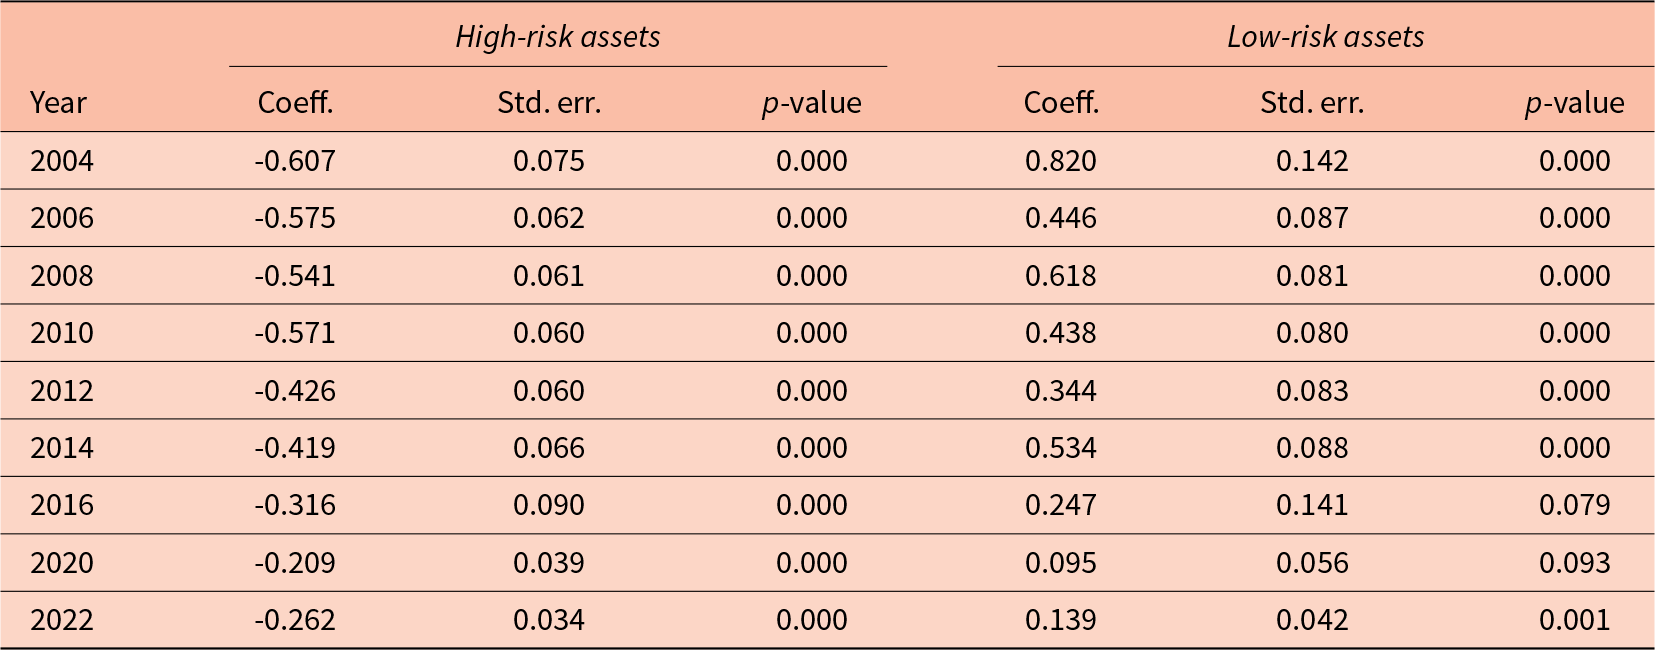
Table 2 Long description
The table reports Tobit regression linear-trend estimates for investment shares in high-riskand low-risk assets across selected years from 2004 to 2022, listing the trend coefficient, its standard error, and a p-value. For high-risk assets, the trend coefficient is negative in every year, ranging from minus 0.607 in 2004 to minus 0.262 in 2022, with p-values reported as 0.000 throughout. For low-risk assets, the trend coefficient is positive in every year, highest in 2004 at 0.820 and lowest in 2020 at 0.095. Low-risk p-values are reported as 0.000 from 2004 through 2014, then become weaker in 2016 (0.079) and 2020 (0.093), before strengthening again in 2022 (0.001). Comparing endpoints, the magnitude of the negative high-risk trend becomes smaller over time, while the positive low-risk trend also declines and is not consistently strongly statistically significant in the mid-to-late period. P-values reflect one-sided tests, so they indicate evidence in the expected direction rather than a two-sided difference.
Note: The table provides an extract from the results of the (unreported) Tobit regressions similar to those displayed in Tables C.3-C.9 in the Appendix, but using “RISFIN” unfactorised to estimate linear trends. It shows only the coefficients (Coeff.) on the linear trend “RISFIN”, standard errors (St. err.), and  $p$-values for the shares of investments in the riskiest (High-risk assets) and safest (Low-risk assets) activities. The
 $p$-values correspond to a
 $t$ test of the null hypothesis that the coefficient on “RISFIN” equals 0, against the alternative that it is
 $ \lt 0$ for High-risk assets and
 $ \gt 0$ for Low-risk assets.
These findings are further supported by the results displayed in Table 3, which present the non-parametric Jonckheere-Terpstra (JT) test for detecting monotonic, generic trends (Terpstra, Reference Terpstra1952; Jonckheere, Reference Jonckheere1954).
Jonckheere-terpstra test for trends in risk aversion and investment shares (2004–2022)

Table 3 Long description
The table reports Jonckheere–Terpstra trend test results by year for investment shares in high-risk and low-risk assets across four risk-aversion groups. For high-risk assets, the test statistic is negative in every yearwith p-values reported as 0.000 throughout. For low-risk assets, the test statistic is positive in every year. Low-risk p-values are also reported as 0.000 in all years except 2020, which is 0.041, indicating a weaker but still statistically significant trend that year. The sign pattern suggests opposite monotonic ordering across risk-aversion groups for high-risk versus low-risk shares.
Note: Let  $ms_1$,
 $ms_2$,
 $ms_3$, and
 $ms_4$ represent the median investment shares for the four subpopulations identified by “RISFIN” = 1, 2, 3, and 4, respectively. The null hypothesis states that
 $ms_1 = ms_2 = ms_3 = ms_4$, while the alternative hypothesis posits that
 $ms_1 \leq ms_2 \leq ms_3 \leq ms_4$ (with at least one strict inequality) for High-risk assets, and
 $ms_1 \geq ms_2 \geq ms_3 \geq ms_4$ (with at least one strict inequality) for Low-risk assets. ***, **, and * indicate significance at the 1%, 5%, and 10% level, respectively.
The results presented in Table 2 and Table 3 provide support for our hypotheses H1-H3. The following statements summarise these findings:
- R1:
The portfolio share characterised by high risk is lower the higher the level of risk aversion. This result confirms our Hypothesis 1.
- R2:
The portfolio share characterised by low risk is higher the higher the level of risk aversion. This result confirms our Hypothesis 2.
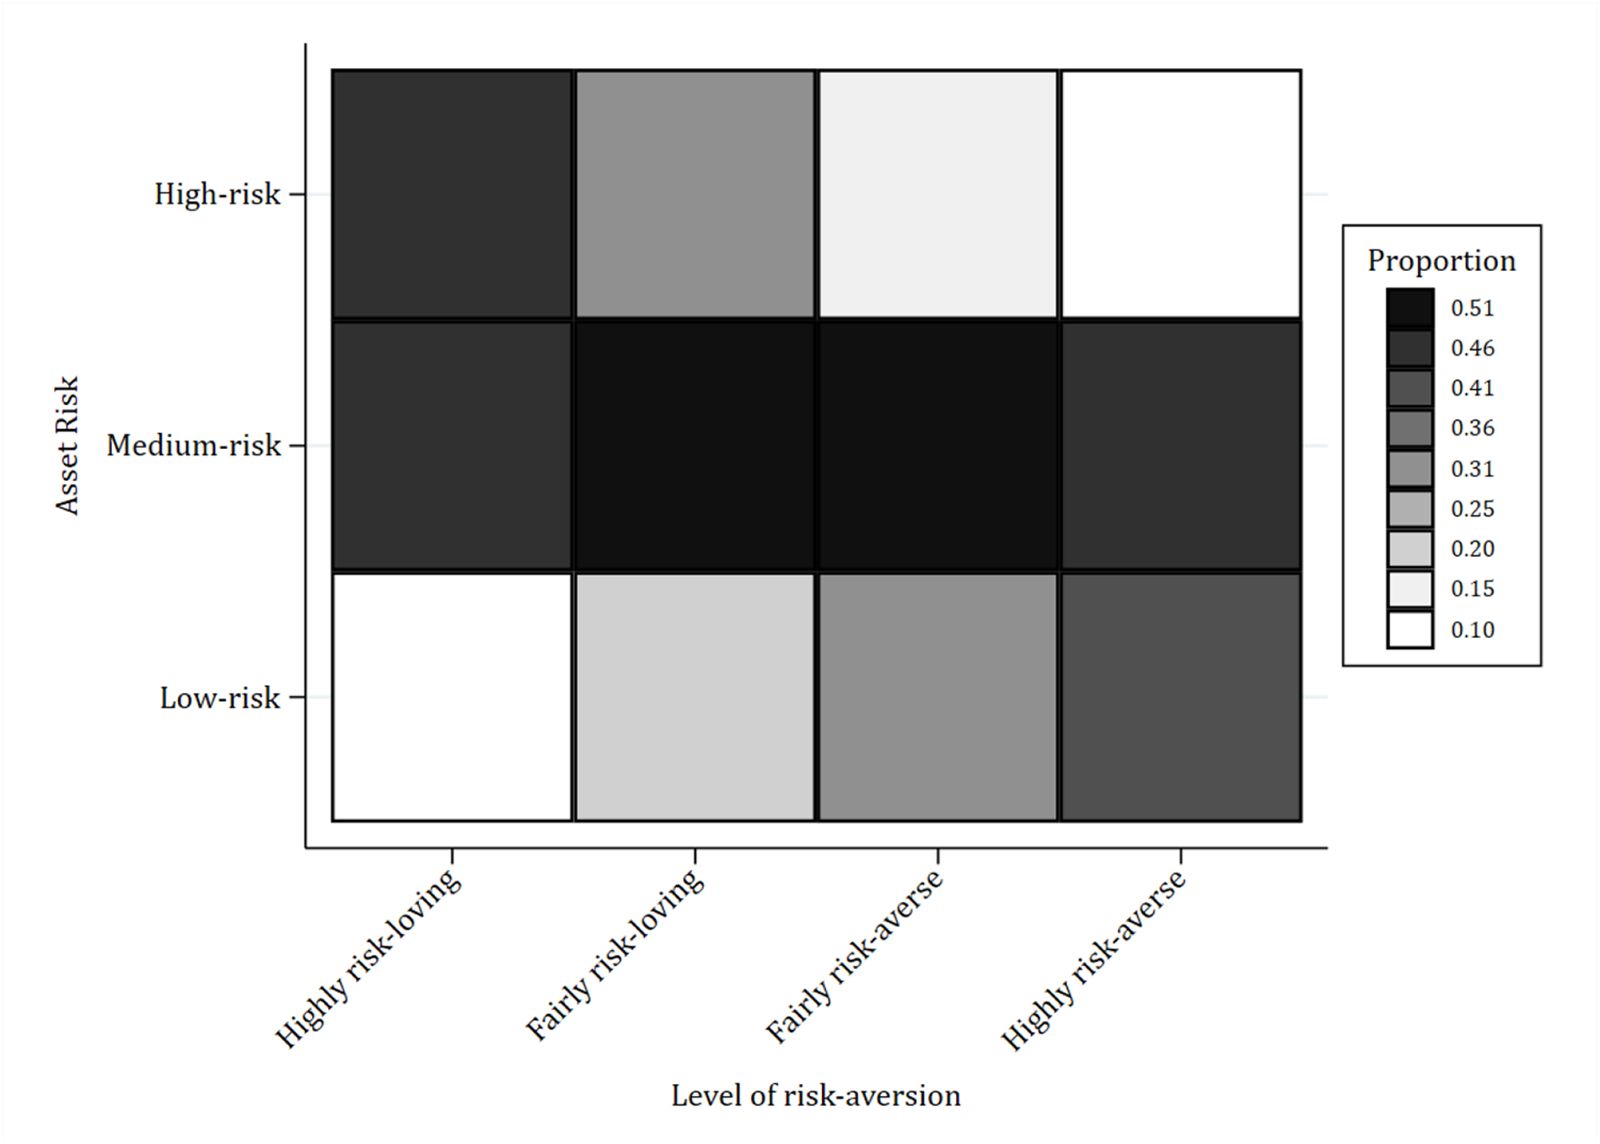
Figure 3 maps self-assessed risk profiles (x-axis, ordered from highly risk-loving to highly risk-averse) to portfolio holdings across asset classes pre-classified into risk tiers (y-axis: low, medium, high) using all waves from 2004 to 2020. Cell intensity denotes the share of respondents holding at least one asset in the corresponding tier. A clear monotone gradient emerges: higher (lower) risk tolerance is associated with higher (lower) investment in high-risk assets. Holdings of medium-risk assets are comparatively stable across the risk-tolerance spectrum, with a slight concentration around intermediate profiles. This pattern supports the external validity of self-assessed risk measures, as the distribution of asset holdings aligns with theoretical expectations.Footnote 6
Alignment between risk profiles and portfolio choices (2004-2020)

Figure 3 Long description
A heatmap of Asset risk against Levels of risk-aversion . Row labels: High-risk, Medium-risk, Low-risk. Column labels: Highly risk-loving, Fairly risk-loving, Fairly risk-averse, Highly risk-averse. A legend titled Proportion shows tick labels 0.51, 0.46, 0.41, 0.36, 0.31, 0.26, 0.20, 0.15, 0.10, with darker shading indicating higher Proportion and lighter shading indicating lower Proportion. High-risk row: the cell under Highly risk-loving is dark; under Fairly risk-loving is mid-tone; under Fairly risk-averse is very light; under Highly risk-averse is very light. Medium-risk row: all four cells are dark, with the first three columns (Highly risk-loving, Fairly risk-loving, Fairly risk-averse) appearing darker than the fourth column (Highly risk-averse). Low-risk row: the cell under Highly risk-loving is very light; under Fairly risk-loving is light; under Fairly risk-averse is mid-tone; under Highly risk-averse is dark.
We also run a panel Tobit analysis using data from all available years, the observational unit being the household. The dependent variable is, alternatively, the portfolio share invested by the hoursehold in a specific asset class. Shares equal to 0 and 1 are treated as censored observations. The model includes only those regressors that are consistently available across all survey waves considered. The results are displayed in Table 4.
Panel tobit 2004-2022 (High- and Low-risk assets)

Table 4 Long description
Panel Tobit regression results relate household portfolio shares in high-risk versus low-risk assets to risk attitude, demographics, education, employment, parental education, cognitive and wealth-quintile indicators, and survey-year indicators. Risk preference is the strongest pattern: compared with the omitted risk group, highly risk-loving is linked to a much higher high-risk share (coefficient 0.859, p less than 0.001) and a much lower low-risk share (minus 1.074, p less than 0.001); fairly risk-loving and fairly risk-averse show the same direction with smaller magnitudes. Gender differs by asset type: female is associated with a lower high-risk share (minus 0.114, p less than 0.001) and a slightly higher low-risk share (0.073, p about 0.056). Age is not significant for high-risk (p about 0.315) but is positively associated with low-risk (0.011, p less than 0.001). Education and parental education generally increase high-risk shares and reduce low-risk shares; for example, diploma is 0.080 for high-risk (p 0.020) and minus 0.125 for low-risk (p 0.010), while university is significant only for high-risk (0.110, p 0.008). Employment status shows mixed effects: unemployed and employee are positive for high-risk, while employee and self-employed are negative for low-risk; self-employed is only marginal for high-risk (p 0.080). Higher IQ categories are mostly not significant for high-risk, but the highest category increases high-risk (0.314, p 0.005) and several higher IQ categories reduce low-risk (for example IQ5 minus 0.601, p less than 0.001). Wealth-quintile indicators are not significant for high-risk but are positive and significant for low-risk in most quintiles (about 0.41 to 0.64). Year indicators suggest declining high-risk shares from 2006 through 2016, while low-risk shares rise in 2006 and 2008 and fall notably in 2020 and 2022 (minus 0.530 and minus 0.411, both p less than 0.001). Both models use 14,709 observations with substantial censoring; random-intercept and error-term standard deviations are significant in both, so coefficients should be interpreted as associations within a censored-outcome panel model rather than simple mean differences.
Note: The panel Tobit model is estimated using data from 2004 to 2022. The dependent variable is the portfolio share invested in the indicated assets. The observational unit is the household. Here,  $\sigma_u$ and
 $\sigma_e$ represent the standard deviations of the random intercept and the normal error term, respectively.
In particular, the categorical-ordered variable of interest, “RISFIN”, is factorised as explained above, and the factor corresponding to Highly risk-averse is used as the base case. Female is a dummy, which takes the value 1 if the respondent is female, 0 otherwise. Age is the age of the respondents. Diploma is a dummy taking the value 1 if the respondent holds an upper secondary school diploma, 0 otherwise. University is a dummy taking the value 1 if the respondent holds a university degree or a higher qualification, 0 otherwise. Unemployed takes the value 1 if the respondent is unemployed and 0 otherwise. Employee takes the value 1 if the respondent is a dependent employee, and 0 otherwise. Self-employed is a dummy equal to 1 for self-employed people, 0 otherwise. Parents’ education is a dummy equal to 1 if at least one of the parents hold a diploma or a higher degree. Following the previous literature on this survey (Conte et al., Reference Conte, De Santis, Melissari, Paiardini and Temperini2024a), we also control for household income (IQ) and wealth quantiles (WQ). Moreover, we include year dummies (Y) to account for period-specific effects on investments, such as the sovereign debt crisis and the COVID-19 pandemic, as well as regional dummies to control for socio-demographic factors not explicitly captured by the included variables but which may influence attitude towards risk.
Consistent with the formulated hypotheses, Highly risk-loving individuals allocate significantly larger shares of their portfolios to high-risk assets, while Fairly risk-loving individuals invest positively but to a lesser extent. In contrast, highly and fairly risk-averse individuals favour low-risk assets.
Regarding demographics and socioeconomic characteristics, females allocate less to high-risk assets but show no significant differences for medium- or low-risk assets. Age has a small but significant negative effect on medium-risk allocations and a positive effect on low-risk allocations, indicating a preference for safer investments among older individuals. Higher educational attainment and higher parental education are associated with increased holdings in high- and medium-risk assets, highlighting the role of both personal and family human capital in shaping portfolio choices. Self-employed and unemployed individuals tend to allocate more to high-risk assets compared with employees.
Higher income quintiles are strongly linked to increased allocations to high- and medium-risk assets and reduced allocations to low-risk assets, whereas lower-income individuals favour safer investments. Higher wealth quintiles are generally associated with larger low-risk allocations and reduced medium-risk allocations, implying a focus on capital preservation alongside selective high-risk exposure.
Temporal trends indicate declining high-risk allocations between 2006 and 2016, with a slight rebound in 2020. Medium-risk allocations generally increase over time, while low-risk allocations display heterogeneous patterns, with some years (e.g., 2020, 2022) showing significant reductions.
Overall, the results corroborate expected relationships between risk profiles, demographics, income, wealth, and portfolio choice: High-risk assets tend to attract more risk-tolerant and better-educated investors, whereas low-risk assets are preferred by more risk-averse or older individuals. Medium-risk assets are typically included in portfolios to achieve diversification. These patterns remain broadly stable over 2004–2022, with some variation attributable to macroeconomic and temporal factors.
For completeness, Table C.1 in Appendix C presents a panel Tobit model in which the two intermediate risk-tolerance groups, Fairly risk-loving and Fairly risk-averse, are pooled into a single category labelled Moderate risk profile. The results show that individuals with a moderate risk profile tend to allocate higher shares to medium-risk assets compared to those at the extremes. The resulting U-shaped pattern is consistent with a diversification role across the risk-tolerance spectrum.Footnote 7
Finally, in Appendix B, Tables C.3–C.9 report Tobit regressions for each year separately for the High-risk assets and Low-risk assets only, which exhibit a clear pattern. We acknowledge that self-reported measures may be subject to biases stemming from prior experiences and unobserved heterogeneity, including differences in financial literacy. To address this concern, for the years in which these variables are available, we include financial literacy and other behavioural variables in addition to the other covariates described above.
For the 2016 and 2020 waves, we include Financial literacy, defined as an indicator taking the value 1 if the participant answers all three questions correctly or at least two correctly. A “don’t know” response is recorded if the participant selects this option for all three or at least two questions. Otherwise, an incorrect response is logged if at least two answers are provided and one or more are incorrect (Conte et al., Reference Conte, Paiardini and Temperini2024b; Conte et al., Reference Conte, Paiardini and Temperini2025). The results are consistent with the literature, showing that individuals with higher financial literacy tend to invest more in high-risk, high-return assets, whereas those with lower financial literacy allocate more to safer but less remunerative assets.
From the 2012 wave onward, we include the variable Emergency, a dummy equal to 1 if the respondent answers “yes” to the question: “In an emergency, do you think your household could temporarily borrow the sum of €5,000 from friends and relatives who do not live with you?”, and 0 otherwise. This variable captures respondents’ financial resilience (Conte et al., Reference Conte, Paiardini and Temperini2024b). The coefficient for high-risk assets is negative and significant in only one year, suggesting that investors in these assets exhibit lower financial resilience. Conversely, for low-risk assets, the coefficient is inconclusive, showing an increase in one year and a decrease in another.
4. Conclusions
In this work, we have examined the relationship between individuals’ self-assessed financial risk attitudes and their portfolio allocations. Exploiting survey data, we found a consistent alignment between stated risk profiles and the declared composition of financial portfolios across different risk categories.
Our findings primarily contribute methodologically to the ongoing debate on eliciting preferences by validating self-assessed risk measures as reliable predictors of portfolio choices.
While experimental protocols provide a valuable benchmark by replicating decision contexts under controlled conditions, they are often costly and difficult to implement at scale. Survey-based measures, by contrast, offer a more practical and cost-efficient alternative for empirical research. The robustness of self-assessed measures, even without monetary incentives, suggests that such survey-based tools can be a credible and efficient resource for future studies investigating financial risk attitude. This opens the way for further research to refine these instruments and to explore how they interact with other behavioural and socioeconomic determinants of financial decision-making.
While we do not directly observe risk perception or risk management processes, the evidence that subjective risk attitudes are systematically reflected in (reported) investment behaviour has broader implications. For regulators, these results support the continued use of self-assessment tools as a cost – effective and informative proxy for risk tolerance. For financial intermediaries, the findings reinforce the relevance of incorporating self-assessed measures into advisory practices, ensuring that suggested products remain consistent with clients’ expressed attitudes. Finally, at the individual level, our results highlight the potential value of reflecting on and explicitly articulating one’s own risk preferences when making financial decisions.
Regarding the use of non-monetary incentives to elicit accurate responses, our findings confirm the robustness of self-reported measures when compared to reported investment behaviour, validating the reliability of such measures in assessing financial risk attitude. This consistency suggests that non-incentivised, self-assessed behavioural data can serve as a reliable tool for understanding the risk attitude of Italian households.
Supplementary material
The supplementary material for this article can be found at https://doi.org/10.1017/esa.2026.10034.
CRediT author statement
Anna Conte: Conceptualization, Methodology, Software, Formal analysis, Data Curation, Writing - Review & Editing, Visualization
Paola Paiardini: Conceptualization, Methodology, Software, Formal analysis, Data Curation, Writing - Original Draft, Writing - Review & Editing, Visualization
Jacopo Temperini: Conceptualization, Writing - Review & Editing, Visualization
Data availability statement
Data is publicly available at: https://www.bancaditalia.it/statistiche/tematiche/indagini-famiglie-imprese/bilanci-famiglie/index.html?com.dotmarketing.htmlpage.language=1
Funding statement
The authors gratefully acknowledge support from the Sapienza Ateneo 2021 Project n. 1798/2022: “Athena vs Lyssa: the role of financial literacy and emotions in financial decisions”, coordinated by Prof. Anna Conte.
Competing interests
The authors have no competing interests to declare that are relevant to the content of this article.





 Open access

