Introduction
Prostate cancer is one of the most prevalent diseases among men in Singapore 1 and is commonly treated with radiotherapy. Volumetric modulated arc therapy (VMAT) is a radiotherapy technique that utilises synchronised modulation of the multi-leaf collimator (MLC)-defined field aperture, dose rate and gantry speed in combination with a relatively small number of monitor units (MU). It is well documented that VMAT is capable of producing high-quality treatment plans. Reference Otto2,Reference Popescu, Olivotto and Beckham3 However, the generation of VMAT plans using inverse planning is influenced by the skills and experience of the dosimetrist. Reference Chung, Lee, Park, Lu and Xia4,Reference Williams, Bailey, Forstner and Metcalfe5 Variations in dosimetrists’ knowledge and skills may result in inconsistencies in the plan quality Reference Das, Cheng, Chopra, Mitra, Srivastava and Glatstein6,Reference Nelms, Robinson and Markham7 which might consequently impact the treatment outcomes. Reference Tol, Delaney, Dahele, Slotman and Verbakel8
Inverse planning can be a time-consuming process. Dose-limiting structures are delineated, usually by a dosimetrist or clinician, in order to enable the treatment planning system to sculpt the dose distribution. The iterative process of modifying the dose distribution includes some degree of trial and error. Reference Ma, Luo, Zhang and Ma9 The dosimetrist must apply and adjust optimisation parameters to the delineated structures in order to obtain an optimal plan. Reference Schreibman and Fox10 Therefore, generating a high-quality inversed VMAT plan can be both resource- and labour-intensive, with implications for the efficiency of the treatment planning workflow. Reference Tol, Delaney, Dahele, Slotman and Verbakel8,Reference Voet, Dirkx, Breedveld, Al-Mamgani, Incrocci and Heijmen11
Numerous studies have investigated methods of improving the speed of the inverse planning process while producing consistently high-quality plans. Reference Craft, Hong, Shih and Bortfeld12,Reference Voet, Dirkx, Breedveld, Fransen, Levendag and Heijmen13 One such study demonstrated that it is possible to achieve high-quality plans within minutes using a reduced-order constrained optimisation algorithm. Reference Lu, Radke and Happersett14 Development of automated optimisation algorithm planning procedures was recommended by Quan et al. Reference Quan, Chang and Liao15 and Zhang et al. Reference Zhang, Li, Quan, Pan and Li16
On the contrary, knowledge-based automated planning, Reference Chanyavanich, Das, Lee and Lo17,Reference Wu, McNutt and Zahurak18 referred to as RapidPlan (RP) in this study, utilises a database containing dose-volume histograms (DVHs) from previously planned patients with high-quality plans and applies them to the new dataset. This is performed by creating a model that estimates the sparing of organs at risk (OAR) volume in terms of the similarity of the spatial relationship between the OARs and planning target volumes (PTVs) to generate a new quality plan. Reference Appenzoller, Michalski, Thorstad, Mutic and Moore19,Reference Shiraishi, Tan, Olsen and Moore20 Consequently, computationally intensive iterations and optimisations can be reduced or even excluded if the model can estimate the OAR DVHs reasonably while conserving the quality of the plans. Reference Good, Lo, Lee, Wu, Yin and Das21 Hence, the knowledge-based approach has the potential to enhance planning efficiency and plan quality. Reference Moore, Brame, Low and Mutic22 However, RP requires intensive training and validation due to the multi-inconsistent plan quality problem posed by multiple OARs and PTVs. 23
RP has been widely investigated with VMAT in the head and neck region by Tol et al., Reference Schreibman and Fox10 and prostate, lungs and the liver by Fogliata et al. Reference Fogliata, Belosi and Clivio24,Reference Fogliata, Wang and Belosi25 The results of these studies generally demonstrated an improvement in the plan quality and minimised inter-planner inconsistency. A further benefit demonstrated was scope for transferring the planning know-how from more skilful and experienced institutions to another institution with lesser expertise and proficiency. Reference Fogliata, Nicolini and Clivio26 However, a study by Schubert et al. Reference Schubert, Waletzko and Weiss27 cautioned institutions from the clinical use of commercially available knowledge-based model, due to potential differences in PTV delineation and priorities of OAR sparing. This study evaluated the performance of an in-house RP model that was developed based on the institution’s cohort of patients with localised prostate cancer.
Materials and Methods
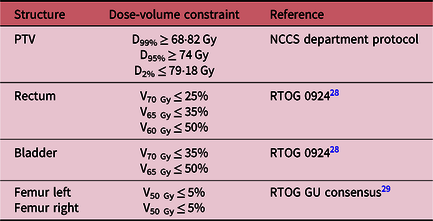
Ethics approval and consent waiver were obtained from the local Centralised Institutional Review Board (CIRB) (CIRB ref no. 2018/2257). A cohort of 50 previously treated patients whose treatments were based on clinical manually optimised (MP) plans with a single-phase prescription dose of 74 Gy in 37 fractions were selected. These 50 treatment plans had not been used for the RP model training and were approved with respect to the department’s clinical prostate plan evaluation criteria which were based on departmental protocol and Radiation Therapy Oncology Group (RTOG) guidelines 28,Reference Lawton, Michalski and El-Naqa29 (Table 1). Clinical MP plans that were integrated into the training of the RP model were excluded.
Prostate plan evaluation criteria

Note: [DX% denotes the amount of dose received by X% of the volume, VX Gy denotes the percentage of volume that received the X amount of dose].
Abbreviations: NCCS, National Cancer Centre Singapore; RTOG, Radiation Therapy Oncology Group.
RP model development and planning
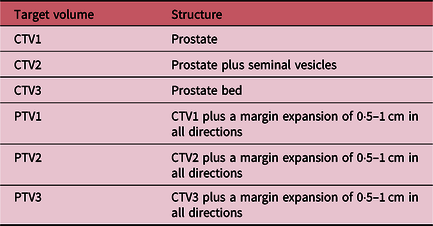
The RP model in the Eclipse version 13·6 (Varian Medical Systems, Palo Alto, USA) treatment planning system was developed by a senior dosimetrist using 53 clinically treated prostate VMAT plans that were generated by a group of dosimetrists. The plans were selected from patients treated for low- to high-risk localised prostate cancer with a variety of prescribed doses from 2015 to 2017. The model accounted for structures such as the rectum, bladder, femurs and a single PTV with some degree of variability in order to be able to handle any of the three types of PTV volumes, as shown in Table 2.
Types of clinical target volume (CTV) and PTV incorporated in the RP model

In this study, the type of PTV volume used was PTV1 which consisted of the prostate with a margin expansion of 0·5–1 cm in all directions (Table 2). The RP VMAT planning was conducted by a dosimetrist with the same gantry and collimator angles as well as the same prescribed dose of 74 Gy in 37 fractions that was applied in the MP plans. All the plans were generated using 10 MV photon with a dose rate of 600 MU per minute, dual partial arcs with gantry angles starting from 200 to 160 degrees and vice versa, with complementary collimator angles of 30 and 330 degrees, respectively. This resulted in arc parameters specified by the planning system with a resolution of 2 degrees of the gantry rotation. For the RP plans in this study, the dosimetrist did not contour the dose-limiting ring structures that were used to control the dose in the MP plans. Only the auto-generated DVH optimisation constraints, generated by the RP engine, were used to optimise the plans in a single optimisation. No further intervention of interactively modifying the optimisation constraints or priority values was made during the optimisation process.
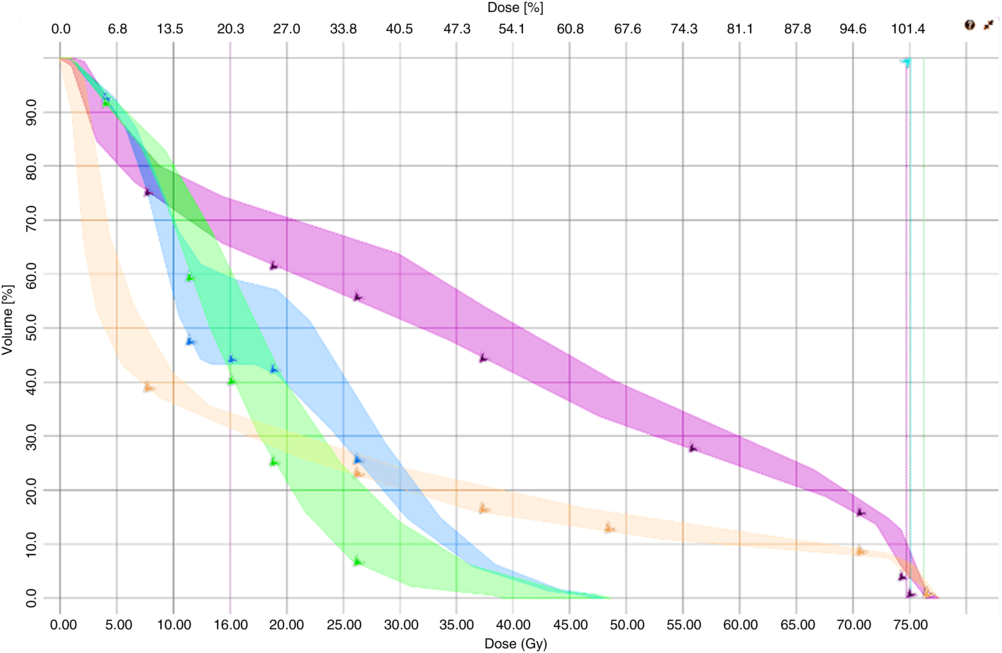
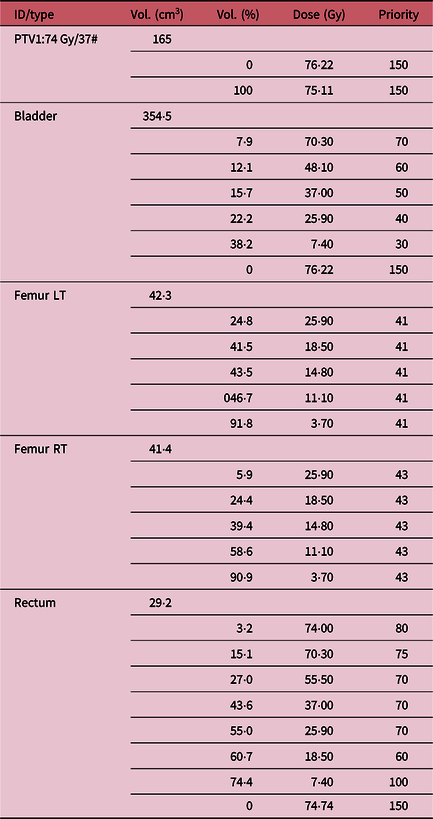
In the optimisation process by RP, optimisation objectives known as point objectives were placed along the inferior DVH prediction boundary for the OARs (Figure 1). For the PTV, upper and lower objectives were placed at D0% = 76·22 Gy and D100% = 75·11 Gy which were denoted by the green and cyan dotted lines, respectively. In addition to the optimisation objectives, the priority values to optimise the OARs and PTV were also generated by the RP model, as shown in Table 3.
Example case (RP 5) dose-volume histograms predicted by RP (shaded regions) before optimisation. Note: rectum (magenta), bladder (orange), left (blue) and right (green) femurs. PTV1: upper objectives at D0% = 76·22 Gy (green dotted line) and lower objectives at D100% = 75·11 Gy (cyan dotted line).

Example case (RP 5): priority values and dose-volume objectives predicted by RP. The PTV1 dose values represent the maximum and minimum dose constraints on the PTV, respectively, while the OAR dose values represent the maximum dose constraint on the specified volume of the structure

All the MP and RP plans were normalised to ensure that 95% of the PTV volume was covered by the 100% isodose line in order to allow dosimetric comparisons with respect to similar PTV coverage. Reference Wu, Jiang, Yue, Li and Zhang30 The RP plans were then reviewed by a radiation oncologist (RO) to ensure that they were clinically acceptable for treatment.
Plan evaluation criteria
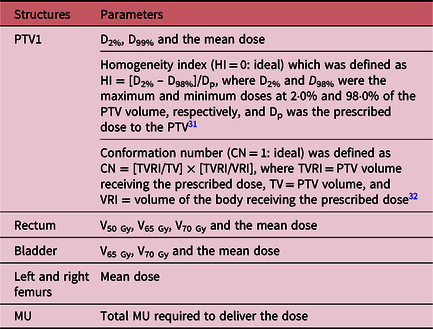
The 50 RP and corresponding MP plans were compared based on the criteria in Table 4.
Comparison criteria between RP and MP plans

Planning time quantification
For RP plans, there is no prior contouring of rings to shape the dose for the region of interest (ROI). A stopwatch was used to collect the total time taken (denoted as planning time) to produce the RP plans in a single optimisation without any interventions (e.g., to interactively modify the objectives or priority values) by the dosimetrist in the optimising process. The stopwatch was activated from the time the dosimetrist generated the DVH estimate values by the RP model for optimisation to the completion of the dose calculation of the plans.
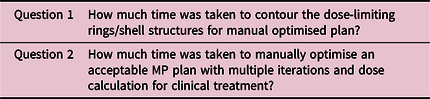
In addition, the average total time taken or planning time to generate the MP plans was collected through a retrospective verbal survey administrated to nine dosimetrists of varying skills and experiences. The survey used the stylised questions shown in Table 5 to determine the time taken to contour the dose-limiting rings structures and to manually optimise MP plans with multiple iterations including dose calculations to produce an acceptable plan for clinical treatment.
Stylised questions for retrospective verbal survey on planning time

Data analysis
The Shapiro–Wilk test was used to assess the normality of the data. Variables were summarised using mean [standard deviation (SD)] or median [interquartile range (IQR)], whichever appropriate. Paired t-test and Wilcoxon signed rank test were used to compare the differences in the PTV and OAR DVH parameters for normal and non-normal data, respectively. The differences in the MU, the DVH parameters of the OARs and PTV as well as the planning time between the MP and RP planning methods were analysed. All tests were two-sided and statistical significance level was set at p < 0·05.
Results
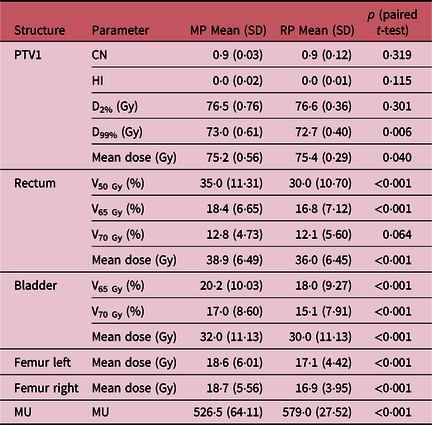
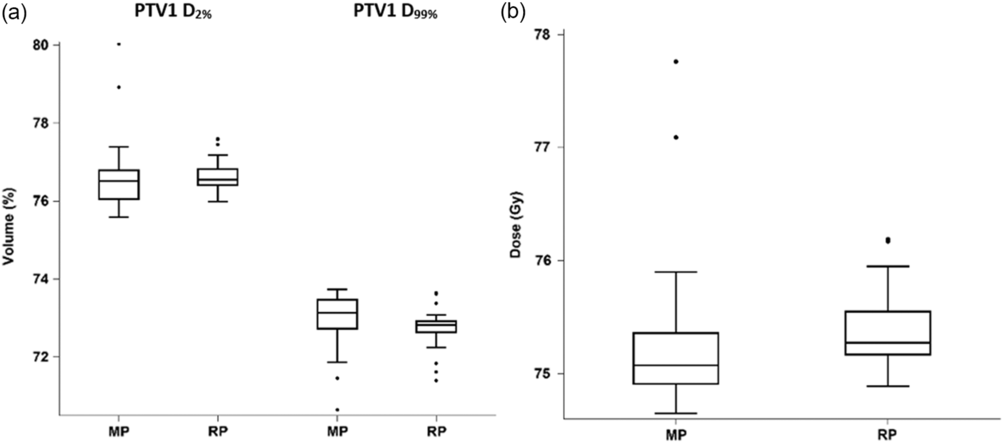
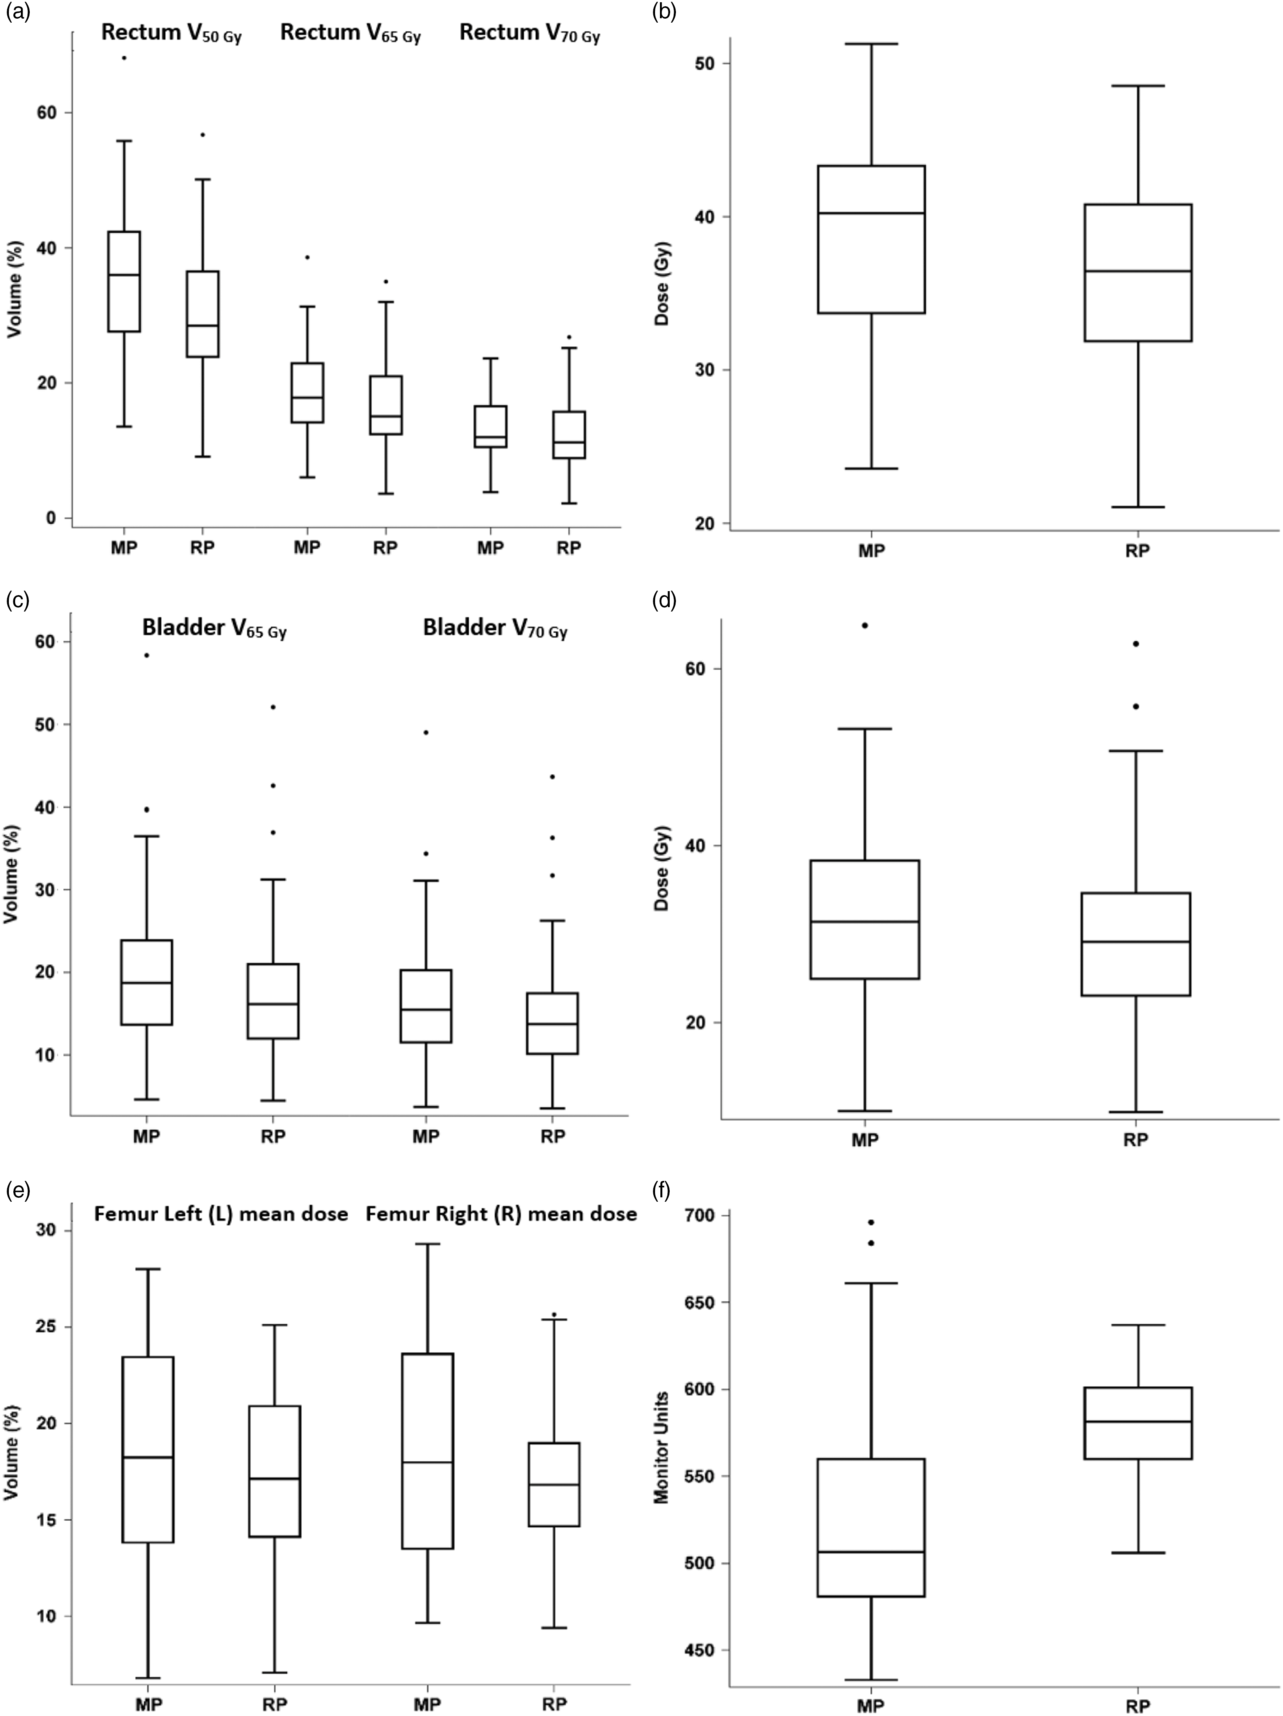
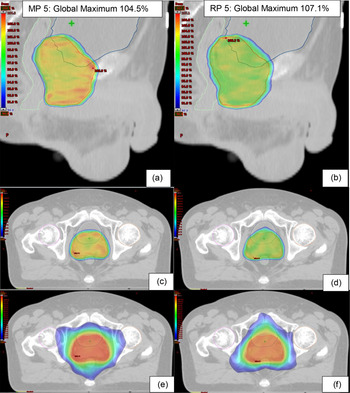
The dosimetric comparisons between MP and RP in terms of PTV coverage, OAR doses and MU are shown in Table 6. The box plots enabling visual comparison of these parameters are shown in Figures 2 and 3. An example of the PTV dose distribution in three planes for a typical patient (patient 5) is shown in Figure 4.
Dosimetric comparison of the PTV, OARs and MU between MP and RP

Note: [DX% denotes the amount of dose received by X% of the volume]. Data shown are the averages of the respective 50 plans.
Abbreviations: CN, conformation number; HI, homogeneity index.
Box plot: comparison of the dose-volume parameters of the PTV1 between MP and RP. (a) D2% and D99% and (b) mean dose. Note: median value (central line); first quartile (Q1—lower line); third quartile (Q3—upper line); whiskers (variations outside lower and upper quartiles); outliers (individual points).

Box plot: comparison of the dose-volume parameter between MP and RP. (a) Rectum V50 Gy, V65 Gy and V70 Gy. (b) Rectum mean dose. (c) Bladder V65 Gy and V70 Gy. (d) Bladder mean dose. (e) Femurs left (L) and right (R) mean dose. (f) Comparison of MU.

Patient 5-dose distribution between MP-5 (left) and RP-5 (right): (a) and (b) Colour-dose wash shows the region of >90% of prescribed dose (sagittal view). (c) and (d) Colour-dose wash shows the region of >90% of prescribed dose (transverse view). The high-dose region conformed to the PTV; dose fell off steeply outside the PTV. (e) and (f) Colour-dose wash shows the region of >50% of prescribed dose (Transverse view).

PTV coverage
Both the dose conformity number (CN) and homogeneity index (HI) were similar in the MP and RP plans (p > 0·05 in both cases). The average hot spots and the mean dose were higher in RP than in MP; however, the average D99% was higher in MP than in RP (p = 0·006) (Table 6). The median values of the PTV D2% and D99% for the MP and RP plans were also comparable; Figure 2 shows these median (IQR) values.
Rectum
The average values of V50 Gy, V65 Gy and the mean dose of the rectum were 5, 1·6 and 2·9 Gy lower in RP than in MP, respectively, all differences being statistically significant (p < 0·001). However, there was no significant difference in the V70 Gy in the rectum (p = 0·064) (Table 6). The median (IQR) volumes for V50 Gy, V65 Gy and V70 Gy are shown in Figure 3a, whereas the mean doses (Figure 3b) were higher in MP than in RP.
Bladder
The average values of V65 Gy, V70 Gy and the mean dose of the bladder were 2·2, 1·9 and 2 Gy lower in RP than in MP, respectively, all significant at the p < 0·001 level (Table 6). Figure 3c shows the box plot for the median dose of V65 Gy, V70 Gy and the mean dose (Figure 3d) received by the bladder, which were higher in MP than in RP.
Femurs
The mean dose for the left and right femurs was lower for RP than for MP by 1·5 and 1·8 Gy, respectively (all p < 0·001) (Table 6). In addition, Figure 3e illustrates both the median of the left and right femurs for the MP mean dose were slightly higher than RP.
Planning time
Stylised questions were used in the retrospective verbal survey on the nine dosimetrists to obtain their estimated time required to generate a complete clinical MP plan based on their individual planning experiences (Table 5). It was indicated that 27 ± 18 (range: 5·0–60·0) minutes were needed to contour the rings structures. In addition, it required another 253 ± 133 (range: 120·0–480·0) minutes to manually optimise an acceptable MP plan with multiple iterations and dose calculation. Hence, the total time required to produce an MP plan for clinical treatment was 280 ± 149 minutes. In contrast, planning time collected through the stopwatch for RP, 1·3 ± 0·3 (range: 1·0–1·9) minutes, was required to generate the DVH objectives estimates for optimisation and it took a total of 11·5 ± 2·2 (range: 9·0–14·0) minutes to optimise and calculate the dose for a RP plan in a single optimisation without any dosimetrist interventions or contouring of rings for dose shaping of ROI.
Discussion
RP planning time and efficiency
The aim when producing the RP model was to produce a model that could be applied to a broad cohort of patients, irrespective of the stage and precise location of their disease. These two factors may influence the prescribed dose, the size of the PTV volume and the proximity of the PTV to the OARs. Reference Fogliata, Belosi and Clivio24 Therefore, the plans used in training the model were from a range of patients treated to various prescribed doses with VMAT, using dual partial arcs and complementary collimator angles.
The times taken to produce plans using each method were compared to give an indication of their impact on a clinical department’s efficiency. The comparison was limited by the two methods used to determine the time taken. The prospective measurement of the duration of the RP planning process was inherently more accurate than the use of a retrospective survey in evaluating the length of the MP planning process. However, logistics of the study and clinical situation at the host institution prevented the measurement of the MP process duration by stopwatch. Nonetheless, the survey results, while subject to a greater uncertainty, facilitate a good comparison between the two means of plan production.
The longer MP planning time could be attributed to two resource-intensive steps. The first was manipulating contours to guide the optimisation procedure Reference Hussein, South and Barry33 ; this included the contouring of dose-limiting dummy rings and subtracting PTV from OARs in order to manage regions in which the PTV overlapped the OARs. However, in this study, such structures were not created as this RP prostate model had accounted for the above considerations automatically during the DVH objectives estimation process; this resulted in time savings of about 27 minutes in the RP planning process. The second step was related to the use of class solutions. In MP, class solutions enable some steps of the process to be sped up, but the need to adjust parameters on a case-by-case basis remains. This requires several iterations during the MP optimising process to generate a high-quality clinically acceptable plan. Reference Hussein, South and Barry33 In contrast, these steps were unnecessary with RP as the DVH objectives estimation automatically generates objectives that would be customised to the individual patient before performing optimisation using RP, as also similarly reported by Fogliata et al. Reference Fogliata, Belosi and Clivio24 and Kubo et al. Reference Kubo, Monzen and Ishii34 A further contribution to the large difference in the planning time standard deviation of 149 minutes was the difference in the skills and competency of the dosimetrists generating the MP plans. The time taken in this study to automatically generate the above DVH parameters in RP 1·3 ± 0.3 minutes was similar to the 1·0–2·0 minutes reported by Cagni et al., Reference Cagni, Botti and Micera35 who also found a large reduction over the time taken to input constraints manually.
Therefore, RP reduced the overall time required for optimisation to 10 minutes, Reference Cagni, Botti and Micera35 enabling generation of a VMAT plan in 10 minutes compared to MP which typically takes more than an hour. Reference Good, Lo, Lee, Wu, Yin and Das21,Reference Oliver, Ansbacher and Beckham36 This finding is consistent with the previous studies by Kubo et al. Reference Kubo, Monzen and Ishii34 and Wu et al. Reference Wu, Jiang, Yue, Li and Zhang30 and is reflected in this study’s experience which took a total average of 11·5 ± 2·2 minutes to optimise and generate a RP plan. Hence, RP has managed to reduce the time spent in generating a VMAT plan in a single optimisation to less than 5% of the time taken with MP in this study (11·5 versus 280) minutes. Thus, RP has greatly enhanced the planning workflow efficiency—the resource-intensiveness of the planning in terms of productivity and time-savings for the dosimetrists. Reference Chanyavanich, Das, Lee and Lo17,Reference Ma and Huang37
RP plans quality and consistency
The results in this study demonstrated that RP and MP produced comparable plan quality in terms of conformity, homogeneity and PTV coverage criteria. Wang et al. Reference Wang, Hu and Yang38 had also demonstrated that CN was similar in both RP and MP plans in their breast RP model. However, the results in this study contrast with those of Hussein et al. Reference Hussein, South and Barry33 and Kubo et al., Reference Kubo, Monzen and Ishii34 where RP generated more conformal plans than MP and those of Good et al., Reference Good, Lo, Lee, Wu, Yin and Das21 where more homogeneous plans were produced using RP. However, the differences in CN and HI between the two planning methods that were not significant in this study could be explained because the trained RP model had incorporated clinically acceptable highly conformal and homogeneous quality plans. Reference Wu, Jiang, Yue, Li and Zhang30
Better OAR sparing was achieved in RP as all the OAR constraints were met and doses were significantly lower in RP than in MP (p < 0·001). Hence, this demonstrated that the trained RP model is able to generate high-quality plans with consistency in a single optimisation as compared to MP plans. Less experienced dosimetrists with varying skills sets were able to generate plans using RP with consistently high quality as shown in the study by Wang et al. Reference Wang, Hu and Yang38
Monitor Units
Higher MU in RP implies that there was an increase in the complexity of the RP MLC sequences as compared to MP, Reference Kubo, Monzen and Ishii34 due to an increase in the number of small field segments which require more MU to deliver the same amount of dose. Reference Kubo, Monzen and Ishii34
RP plans acceptance
In total, 46 out of the 50 RP plans were accepted by the RO, 2 RP plans were not accepted due to the volume of the rectum receiving 70 Gy exceeding the 25% constraint for the rectum and the remaining 2 plans were rejected as the larger hot spots of 105% (77·7 Gy) in the PTV were in close proximity to the rectum. Hence, care was taken to minimise the maximum doses to OARs which is especially critical to serial OARs like the bladder and the rectum. Reference van’t Riet, Mak, Moerland, Elders and van der Zee32
However, the above issues can be rectified by further optimising the plan manually, by contouring out the larger hot spots of 105% in the PTV which were near to the rectum and re-optimising the plan by adding an upper objective to the contoured 105% structure as well as with further amendment of the PTV priority values. Reference Kubo, Monzen and Ishii34 As for the rectum dose that exceeded the constraint, the dosimetrist can add an upper objective to the rectum and re-optimise the plan on top of the point objectives generated by RP model. Reference Kubo, Monzen and Ishii34 However, these were not applied in this study as these considerations were not within the scope of the evaluation. Hence, this study was kept to a single optimisation without any dosimetrist intervention.
This study had demonstrated the robustness of the institution’s RP model that comprised a single target with three heterogeneous PTVs and with various dose prescriptions. However, only one type of PTV which was PTV1 was used in this study, hence further studies can be conducted in order to further evaluate the robustness of this model for other variations in the prostate target volume.
Conclusion
RP can produce acceptable VMAT prostate plans in terms of PTV coverage and OAR sparing for the rectum, bladder and femurs. The quality of these plans is equivalent to or better than those with MP, and this is achieved with a great reduction in the resources used in a streamlined planning process enabled by the RP model.
Acknowledgements
The authors would like to thank Mr Yeo Wee Pin, senior dosimetrist, for the training of the RapidPlan model and Ms Yeo Sook Kwan for the CIRB administrative support.
Funding
This research did not receive any specific grant from funding agencies in the public, commercial or not-for-profit sectors.
Conflicts of Interest
The authors report no conflicts of interest and are solely responsible for the content and writing of the article.