Background
The notion that the environment plays a key role in people's lives has a long tradition in gerontology (Lawton Reference Lawton1980). Consistent with this view, the importance of the neighbourhood environment in promoting activity participation is increasingly recognised in the health promotion domain. An issue that has received little attention to date, however, is the immediate housing environment in which people live. Many older adults live in senior apartments, defined here as buildings for older adults who can still live completely or partially independently in the community (i.e. are not institutionalised). This study examined the activity-related resources available in senior apartment buildings in one Canadian city, Winnipeg, Manitoba, and whether variations in resource-richness varied systematically by neighbourhood characteristics, particularly socio-economic status.
The role of the environment in activity level
Although the benefits of physical activity are well documented (e.g. diPietro Reference DiPietro2001), research shows that most adults are insufficiently active to gain health benefits. This is particularly the case for older adults, with a reported 53 per cent of individuals aged 65 or more years in Canada being physically inactive (Statistics Canada 2005). The problem is similar in the United States (Kruger, Carlson and Buchner Reference Kruger, Carlson and Buchner2007). Finding ways to enhance physical activity levels among individuals of all ages has in consequence been the focus of much research in recent years. Australian, European and North American studies have found that proximity to relevant resources promotes participation and activity levels, as has been found for recreation facilities (Booth et al. Reference Booth, Owen, Bauman, Clavisi and Leslie2000; Brownson et al. Reference Brownson, Baker, Housemann, Brennan and Bacek2001; De Bourdeaudhuij, Sallis and Salens Reference De Bourdeaudhuij, Sallis and Saelens2003; Giles-Corti and Donovan Reference Giles-Corti and Donovan2002a; McNeill et al. Reference McNeill, Wyrwich, Brownson, Clark and Kreuter2006; Parks, Housemann and Brownson Reference Parks, Housemann and Brownson2003; Sallis et al. Reference Sallis, Hovell, Hofstetter, Elder, Hackley, Caspersen and Powell1990), and proximity to shopping centres and other services (Berke et al. Reference Berke, Koepsell, Moudon, Hoskins and Larson2007; De Bourdeaudhuij, Sallis and Saelens Reference De Bourdeaudhuij, Sallis and Saelens2003; King, W. C. et al. Reference King, Brach, Belle, Killingsworth, Fenton and Kriska2003, Reference King, Belle, Brach, Simkin-Silvervan, Soska and Kriska2005; King, A.C. et al. Reference King, Toobert, Ahn, Resnicow, Coday, Riebe, Garber, Hurtz, Morton and Sallis2006; Pikora et al. Reference Pikora, Giles-Corti, Knuiman, Bull, Jamrozik and Donovan2006; Spence et al. Reference Spence, Plotnikoff, Rovniak, Martin Ginis, Rodgers and Lear2006).
One question that has not yet been addressed in the research literature is whether other contextual factors are linked to resource availability. An important issue for older adults is the housing environment in which they live. Having access to activity programmes within the building might be one of the best predictors of activity participation. Research conducted during the 1970s suggested that individuals living in retirement or senior housing were more likely to maintain their activity level over time than individuals who lived in conventional dispersed housing (Carp Reference Carp1979; Sherman Reference Sherman1974), which suggests that proximity is important. Although studies have described activity programmes and services in specific housing units (e.g. Bassuk Reference Bassuk1999; Howe Reference Howe1999; McNickle Reference McNickle2004; Paul Reference Paul1993), we are not aware of any research that has systematically examined the resources available across all senior apartments in a single city. Older adults who live in senior apartments are an important target group for health promotion interventions, such as physical activity programmes, as they tend to be older and frailer than their counterparts living in the community (Menec, MacWilliam and Aoki Reference Menec, MacWilliam and Aoki2002; Rinehart Reference Rinehart2002; Shapiro and Tate Reference Shapiro and Tate1988), and their ability to take advantage of opportunities outside the building may be limited. As a target group for activity programmes, they constitute a substantial proportion of older adults living in the community, and given their residence in congregate settings they are relatively contactable. In Winnipeg in 2001, about 15 per cent of older adults aged 65 or more years lived in senior apartments, and among those aged 75 or more years, the proportion was about 20 per cent.
Activity-related resources and neighbourhood socio-economic status
We have examined the factors that are related to the availability of activity-related resources, paying particular attention to the influence of low neighbourhood socio-economic status (SES). Research has show that a substantial proportion of older adults living in socio-economically deprived neighbourhoods experience not only difficulties with accessing basic services, but are also disadvantaged in other ways, as in social relations and civic activities (Scharf, Phillipson and Smith Reference Scharf, Phillipson and Smith2005). More specifically, disadvantaged neighbourhoods are associated with relatively low activity resources (Estabrooks, Lee and Gyurcsik Reference Estabrooks, Lee and Gyurcsik2003; Giles-Corti and Donovan Reference Giles-Corti and Donovan2002b; Hillsdon et al. Reference Hillsdon, Panter, Foster and Jones2007; Powell et al. Reference Powell, Slater, Chaloupka and Harper2006). The comparative scarcity of resources in these areas may partly explain why living in low SES neighbourhoods is associated with low leisure-time physical activity (Kavanagh et al. Reference Kavanagh, Goller, King, Jolley, Crawford and Turrell2005; van Lenthe, Brug and Mackenbach Reference van Lenthe, Brug and Mackenbach2005), and may partly explain the increased risk of health problems (Diez Roux et al. Reference Diez Roux, Merkin, Arnett, Chambless, Massing, Nieto, Sorlie, Szklo, Tyroler and Watson2001). Overall, there is considerable research evidence of the multiple ways in which seniors living in low SES urban neighbourhoods are disadvantaged.
The present study
The overall aim of the study was to explore the activity-related resources available to seniors living in one Canadian city. There were two objectives: (1) to examine what kinds of resources that are provided in senior apartment buildings, with a focus on activity-related resources; and (2) to determine whether the resource-richness of senior apartments is related to neighbourhood characteristics. Consistent with previous research, of particular interest was whether availability of resources is related to neighbourhood SES. Given that previous research has shown that activity-related resources are relatively scarce in low SES neighbourhoods (e.g. Powell et al. Reference Powell, Slater, Chaloupka and Harper2006), one would expect that senior apartment buildings in less affluent neighbourhoods would have fewer resources available than buildings in more affluent neighbourhoods. If so, some older adults may be doubly disadvantaged by living in a resource-poor building on the one hand, and, on the other, by living in a neighbourhood that has limited activity resources (Kavanagh et al. Reference Kavanagh, Goller, King, Jolley, Crawford and Turrell2005; van Lenthe and Mackenbach Reference van Lenthe, Brug and Mackenbach2005).
Winnipeg is the largest city in the province of Manitoba, Canada, with a population of about 650,000, about two-thirds of the provincial total. About 13 per cent of the city's residents are aged 65 or more years, similar to the percentage in all Canadian provinces. The majority of Winnipeg's (and Manitoba's) residents live in private dwellings in the community; only 5.6 per cent of those aged 65 or more years live in nursing homes (provincially-funded institutions designated for individuals who can no longer be maintained in the community) (Centre on Aging 2005). The housing options for community-dwelling older adults range from privately-owned or rented houses or apartments to apartment complexes specifically designed for older adults. To enable individuals to remain in the community for as long as possible, all community-dwelling older adults in Manitoba can receive home care free of charge through the provincially-funded Home Care Programme. The services provided include personal-care assistance (as with bathing and dressing) and home supports (as with preparing meals). Both nursing homes and home care are allocated on the basis of need following a formal assessment. About 10 per cent of community-dwelling individuals aged 65 or older receive home care in Manitoba (Centre on Aging 2005).
Identifying the apartment buildings
Housing units for older adults were identified using the Winnipeg Seniors' Housing Directory (Age and Opportunity 2003, 2005), which provides the most comprehensive listing of housing for older adults in Winnipeg. It lists various housing opportunities for older adults, from independent living, through facilities that accommodate individuals who require some assistance (e.g. meals), to nursing homes. For the purposes of this study, we included all the listed buildings except nursing homes. Most are owned by for-profit or not-for-profit organisations or landlords, but some is publicly-owned housing for seniors on low incomes. The rents in most cases are subsidised. Note that by using the Directory as a starting point for selecting senior apartments, we excluded ‘regular’ apartment buildings, even though some of these are occupied mostly by older adults. A total of 195 apartment buildings were eligible for inclusion.
Collecting information on activities and services
Data on the senior apartment buildings were gathered over four months between October 2005 and February 2006. The managers or caretakers of the buildings were telephoned during regular business hours and asked about their willingness to participate. Five declined, leaving 190 buildings (97.4% response rate). The reasons for refusal included ‘not interested’ and ‘not enough time’. Information on activities and services provided in the senior apartment buildings was collected primarily by telephone using a brief, structured questionnaire. Besides focusing on physical activity-related resources, we also wanted to examine the availability of social activities, given the known relationship with health and wellbeing (e.g. Menec Reference Menec2003). Moreover, we wanted to determine what other kinds of general services were available.
The questions asked included: (1) Are there any social activities for the tenants of this building? (2) Are there any physical activities? (3) Do tenants have the opportunity to participate in organised outings? (4) Is there a common area available for residents' use? (5) Does the building offer transportation for tenants? (6) Is a meal programme offered? We also asked how many suites (units of accommodation) there were in the building. If the respondent answered ‘yes’ to any question, they were asked to detail the activities that were offered and their frequency. In addition, the respondent was asked to send (by fax or mail) the monthly activity schedule and examples of activity brochures, if available. This allowed for additional information to be added that might not have been obtained in the telephone interview. Three managers indicated that they did not have time to complete the survey over the telephone, and were sent the questionnaire which they self-completed.
The measures
The identified activities and services were categorised as those that were: predominantly physical-activity oriented (e.g. exercise equipment, exercise classes); predominantly social-activity oriented (e.g. bingo, card games); and others that were termed services (e.g. grocery shuttle, health-related services). For each of the categories, the number of services was determined, as was an aggregate score of ‘total activities and services’. As larger buildings are likely to provide more resources than smaller ones, the numbers of activities or services per 100 suites was calculated for each measure. The 190 buildings contained a total of 22,096 separate suites. Because the rate variables were skewed, they were dichotomised, in effect creating a measure of whether the building was resource-rich or resource-poor controlled for building size.
The 238 neighbourhoods defined by Statistics Canada for the 2001 population census were used, and the neighbourhood characteristics drawn from its public-access files. Each neighbourhood has a population of about 3,000, but they differ considerably, partly as a consequence of natural and built divides such as rivers and major roads. There are 25 neighbourhood clusters, and even larger aggregations are used for planning and policy purposes. The 190 senior apartment buildings fell into 83 of the 230 neighbourhoods. Each building was assigned the neighbourhood's census values. Two indicators characterised the socio-economic environment: mean neighbourhood household income in five categoriesFootnote 1 and residential stability, the percentage of residents who had moved during the previous five years. There were also three socio-demographic measures: the percentage aged 65 or more years, the percentage living alone, and population density (cf. Fisher et al. Reference Fisher, Li, Michael and Cleveland2004; Subramanian et al. Reference Subramanian, Kubzansky, Berkman, Fay and Kawachi2006). To examine if broad zones of the city differed, four quadrants were defined taking into account major geographic features, specifically two rivers that are north-south and east-west divides.
Analytic approach
We used both descriptive and inferential statistics. The percentage of buildings offering various activities and services was examined in relation to neighbourhood characteristics by geo-coding and mapping at the level of neighbourhood clusters, as these were sufficiently large to show patterns, yet small enough not to mask the relationships of interest.Footnote 2 Chi-squared tests, trend tests and logistic regressions were also used to examine the relationship between neighbourhood characteristics, city quadrant and each of the four resource measures. Each of the neighbourhood characteristics was entered separately into a regression model, in combination with the city quadrant variable.
The results
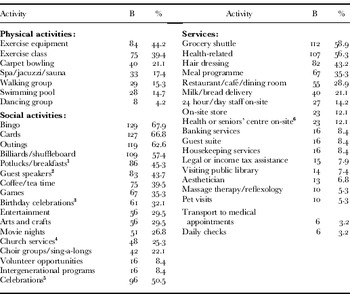
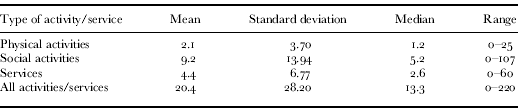
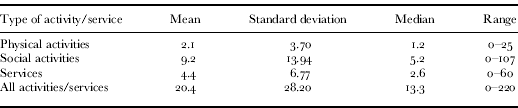
Table 1 shows the activities and services provided by the 190 buildings. In terms of physical activities, 44.2 per cent had exercise equipment, such as treadmills and exercise bikes, and 39.4 per cent offered exercise classes including aerobics, stretching classes and chair exercises. Dancing groups were offered in less than five per cent of the buildings. Among the social activities, bingo was the most common, with 67.9 per cent of buildings offering this diversion. Less than 10 per cent of the buildings offered volunteer opportunities for tenants or inter-generational programmes, such as regular visits or reading programmes with children from local schools. The provision of a grocery shuttle was the most common service and available from 58.9 per cent of buildings. Health-related services were also quite common (56.3%). In contrast, few buildings provided daily checks of residents or transport to medical appointments. Table 2 shows that there were 2.1 physical activity-related programmes per 100 units, 9.2 social activities, and 4.4 services. Overall, 20.4 activities and services per 100 units were available. Nine buildings provided no programmes or services at all. The activities and services were moderately to strongly correlated with each other.Footnote 3
Activities and services by apartment building, Winnipeg 2005–06

Notes: B: Number of buildings with the resource. 1. Also barbecues/teas. 2. Also presentations. 3. Monthly. 4. Also bible study. 5. For special occasions/holidays. 6. Or attached nursing home.
Activities and services per 100 apartment units, Winnipeg 2005–06
Neighbourhood characteristic and activities/services
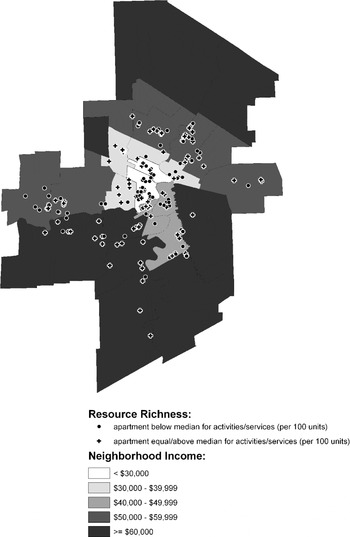
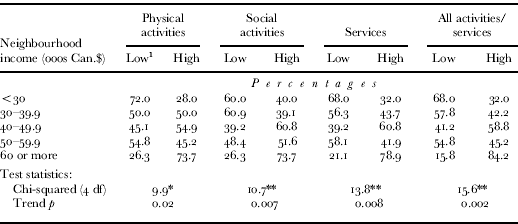
Table 3 shows the relationship between neighbourhood income and the level of the apartments' activities and services. A strong and statistically significant income gradient is apparent, with the provision of activities and services generally increasing with neighbourhood income. The only exception was the $50,000–59,999 income neighbourhoods, which were consistently less resource-rich than $40,000–49,999 income areas. Cochran-Armitage trend tests (Agresti Reference Agresti1990) determined if the proportion of resource-rich buildings increased with neighbourhood income and found statistically significant associations for all four measures. Figure 1 maps the spatial association, by overlaying the low and high activities and services provision buildings on neighbourhood income. It is noticeable that the lowest income neighbourhoods in the downtown area had clusters of resource-poor senior apartments. It is also evident on Figure 1 that senior apartments were unevenly distributed across the city, some neighbourhood clusters having numerous buildings whereas others only a few or none. While the variation is partly a size effect, with the more populous clusters having more senior apartment buildings, there was only a moderate correlation with the older (65+ years) share of the population (r=0.37, p>0.05).
Resource-rich and resource-poor apartment buildings in relation to neighbourhood income, Winnipeg 2005–06.

Neighbourhood income by activities and services, Winnipeg 2005–06
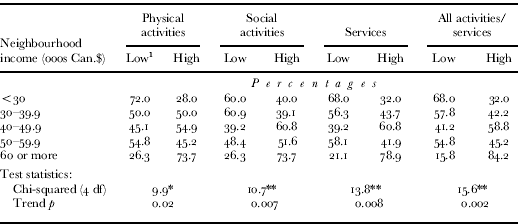
Notes: df: degrees of freedom. 1. ‘Low’ is below the median, ‘High’ at or above the median (per 100 apartment units). Neighbourhood income is based on average household income.
Significance levels: ** p<0.01, * p<0.05.
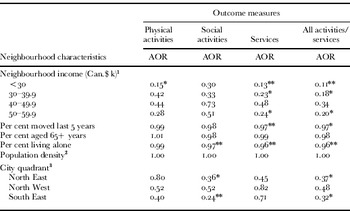
Table 4 presents the results of the regression analyses. Each of the neighbourhood characteristics and city quadrant was entered separately into the model. Apartments in the lowest income neighbourhoods had significantly lower odds of being resource-rich for physical activities and services than those in the richest neighbourhoods. This was also true for the second lowest income group in the case of services. As previously shown with the trend tests, the odds of being resource-rich were lowest in the poorest neighbourhoods, slightly higher for the second lowest income neighbourhoods, and slightly higher again for $40,000–49,999 income neighbourhoods (the adjusted odds ratios for total activities and services were respectively 0.11, 0.18, and 0.34). Apartments in the $50,000–59,999 income areas were, again, unusual in having significantly lower odds of providing services than those located in the highest income areas. The effect for social activities was not significant.
Activities and services by neighbourhood characteristics

Notes: AOR=adjusted odds ratio. Five separate logistic regression models were run, one for each neighbourhood characteristic. The city quadrants variable was included in each of the five models. 1. Reference group Can$60,000 or more. 2. The statistics (all 1.00) are odds ratios, and do not indicate a reference group (per cent moved, per cent aged 65+ years, and per cent living alone and population density were all entered as continuous variables). 3. The South West quadrant was the reference group. Results for city quadrants are shown for the model that also included population density.
Significance levels: * p<0.05, ** p<0.01.
Table 4 also shows that residential stability and the percentage living alone were related to the outcome measures. Apartments in neighbourhoods with a higher percentage of movers (i.e. less residential stability) had reduced odds of being resource-rich for services and for total activities and services. Apartments in neighbourhoods with a higher percentage of older people living alone had reduced odds of social activities, services and total activities and services. The elderly percentage and population density were consistently not related to the four outcome measures. A few differences emerged by city quadrant, with the buildings in the North West and South East having fewer social resources than buildings in the South West. The same differences emerged for total activities and services.
Discussion
This study has examined the availability of activity-related resources in senior apartments in Winnipeg, Manitoba. It was assumed that having activities on-site is advantageous, just as the proximity of activity-related resources in a neighbourhood (such as recreation facilities) has been associated with higher activity levels (e.g. Booth et al. Reference Booth, Owen, Bauman, Clavisi and Leslie2000; Brownson et al. Reference Brownson, Baker, Housemann, Brennan and Bacek2001). It has been found that the resources available in the city's senior apartment buildings vary widely, with some providing none and others many, and that neighbourhood characteristics were related to the resource-richness of senior apartment buildings. Only 28 per cent of the buildings in the poorest neighbourhoods were resource rich for physical activities (per 100 suites), while in the most affluent neighbourhoods 74 per cent of the buildings met this standard. Similar large discrepancies applied to resources for social activities and services. The resource-richness of the buildings in middle-income neighbourhoods fell in between the extremes. Thus, there was a continuous incremental relationship between the resource-richness of senior apartments and neighbourhood income. The finding that residential stability, which is correlated with economic circumstances, was also related to services (but not resources for physical and social activities) corroborates that resource-poor senior apartments tended to cluster in socio-economically disadvantaged neighbourhoods.
There was one departure from a monotonic income relationship: apartments in $50,000–59,000 income neighbourhoods had fewer resources than those in $40,000–49,999 neighbourhoods. Put another way, apartments in the latter neighbourhoods tended to be better resourced than predicted by the neighbourhood SES score. It is not clear why this was the case, but it may be a consequence of idiosyncratic local factors. For example, many senior apartments are located on major streets, and the number of housing units in an area was only moderately correlated with the percentage of the population that was older. If apartments were located on the basis of need, one would expect a stronger relationship between the two, with the highest concentrations of senior apartments and housing units in neighbourhoods with the highest age concentration.
The SES effects found here are consistent with previous evidence that the availability of physical activity resources is negatively related to neighbourhood SES (Estabrooks, Lee and Gyurcsik Reference Estabrooks, Lee and Gyurcsik2003; Giles-Corti and Donovan Reference Giles-Corti and Donovan2002b; Hillsdon et al. Reference Hillsdon, Panter, Foster and Jones2007; Powell et al. Reference Powell, Slater, Chaloupka and Harper2006). This may be one reason why residents of low SES neighbourhoods engaged in less leisure-time physical activity than their counterparts in more affluent neighbourhoods (Kavanagh et al. Reference Kavanagh, Goller, King, Jolley, Crawford and Turrell2005; van Lenthe and Mackenbach Reference van Lenthe, Brug and Mackenbach2005). The findings are also consistent with evidence of the high level of social exclusion experienced by older adults living in socio-economically deprived city neighbourhoods (referring not only to services but also to civic participation) (Scharf, Phillipson and Smith Reference Scharf, Phillipson and Smith2005).
The residents of seniors' apartments are a vulnerable population in that they have more health problems than their counterparts living completely independently in the community (Menec, MacWilliam and Aoki Reference Menec, MacWilliam and Aoki2002; Rinehart Reference Rinehart2002). Their residential situation is intermediate between living independently in the community and long-term institutional care (Shapiro and Tate Reference Shapiro and Tate1988). It therefore seems likely that providing more activity-related resources in senior apartments would lessen health risks and prolong semi-independent living. The present findings suggest, however, that the older adults living in senior apartments in low-income neighbourhoods have disadvantages in these respects because of the relative unavailability of activity-related resources. This speaks to the need to take into account the neighbourhood environment when planning the resources provided in senior housing.
This study has several limitations. The focus was on the activities and services available in senior apartment buildings, not on whether residents actually made use of them. Thus, although some buildings may have many resources available, if they were not used, the residents might be no more active than those living in less resource-rich environments. Whether the resource-richness of senior apartments relates to residents' activity levels and health outcomes needs further research. Secondly, we had no information about the resources available in the neighbourhoods of the buildings, and therefore do not know whether less affluent neighbourhoods had fewer resources than more affluent ones. Lastly, the focus of the present study was on activities and services provided, which may in turn be dependent on other factors such as the age of the building. Nevertheless, the presented findings are a first step in broadening the notion of activity-related resources beyond those available in the neighbourhood. The study has provided a new perspective on the environment in which many older adults live, and suggests that the housing environment is an important factor related to the activity levels and health risks of older adults.
Acknowledgements
This research was supported by the award of a Canada Research Chair in Healthy Aging to V. Menec.