1. Introduction
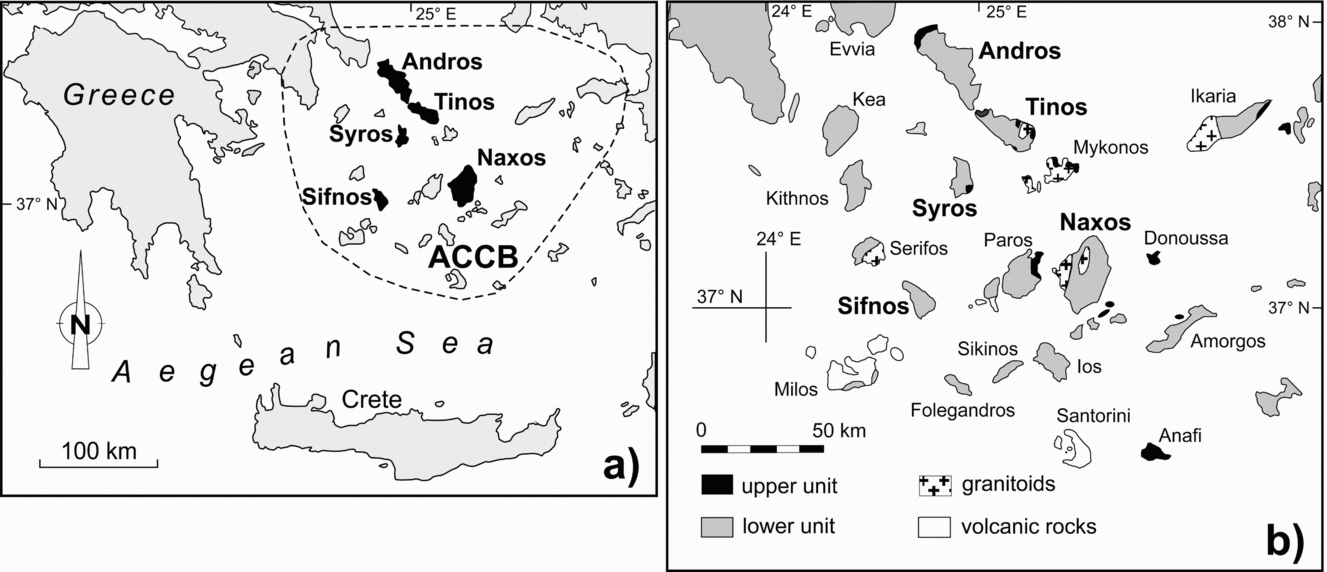
The Attic–Cycladic crystalline belt in the central Aegean region (Fig. 1a) is a major tectonostratigraphic unit of the Hellenides. Known outcrops roughly delineate an area of c. 30000 km2, but most parts of this terrane are submerged below sea level. The Attic–Cycladic crystalline belt records a complex structural and metamorphic evolution which documents various stages in the closure of the Neotethys Ocean and the extensional collapse of the newly formed orogen (e.g. Jolivet & Patriat, Reference Jolivet, Patriat, Durand, Jolivet, Horvath and Séranne1999; Krijgsman, Reference Krijgsman2002; Jolivet et al. Reference Jolivet, Facenna, Goffé, Burov and Agard2003). Regional correlations between different islands are difficult to establish owing to the lack of distinct marker horizons and incomplete knowledge of protolith ages for most parts of the metamorphic succession. The general geological and metamorphic framework is well-documented, but key information pertaining to the pre-metamorphic evolution and the tectonostratigraphy is only poorly constrained.
Simplified geological overview of the Aegean region (modified after Matthews & Schliestedt, Reference Matthews and Schliestedt1984) with key locations discussed in the text. ACCB – Attic–Cycladic crystalline belt.

This study aims at utilizing strontium-, carbon- and oxygen-isotope compositions recorded in marbles as a tool for unravelling litho- and/or tectonostratigraphic relationships across the northern part of the Cyclades as well as the time of sediment deposition. On a local scale, marbles are used as marker horizons to subdivide monotonous schist sequences (e.g. Tinos and Andros; Melidonis, Reference Melidonis1980; Papanikolaou, Reference Papanikolaou1978a, Reference Papanikolaoub), but petrographic characteristics alone are not sufficient to establish correlations between distinct marble horizons occurring on different islands. Sr-, C- and O-isotope data may help to unravel such relationships.
Besides documentation of isotope geochemical affinities between different marble occurrences, valuable information about the time of sediment formation may be obtained. Owing to its long residence time, seawater records a global 87Sr/86Sr isotope signature that is controlled by variable Sr contributions from terrestrial weathering and hydrothermal alteration of basalts (e.g. Banner, Reference Banner2004 and references therein). A well-established Sr-isotope record for Phanerozoic seawater (e.g. Veizer et al. Reference Veizer, Ala, Azmy, Bruckschen, Buhl, Bruhn, Carden, Diener, Ebneth, Godderis, Jasper, Korte, Pawellek, Podlaha and Strauss1999; McArthur, Howarth & Bailey, Reference McArthur, Howarth and Bailey2001) can be used as a reference for Sr-isotope chemostratigraphy of marine carbonates. The Sr-isotope composition is very susceptible to diagenetic and metamorphic alteration, which may obscure the original composition (e.g. McArthur, Reference McArthur1994; Banner, Reference Banner2004; van Geldern et al. Reference van Geldern, Joachimski, Day, Jansen, Alvarez, Yolkin and Ma2006; Nascimento, Sial & Pimentel, Reference Nascimento, Sial and Pimentel2007). The Cycladic marbles have experienced diagenesis and at least two stages of tectonometamorphic overprinting at eclogite to blueschist facies and greenschist to amphibolite facies P–T conditions, respectively. It is, thus, uncertain whether or not this material is suitable for a chemostratigraphic study using Sr isotopes. However, previous studies have documented that high-grade metamorphic carbonate rocks can retain their original Sr-, C- and/or O-isotopic signatures under favourable circumstances (Melezhik et al. Reference Melezhik, Gorokhov, Fallick and Gjelle2001, Reference Melezhik, Roberts, Fallick, Gorokhov and Kusnetzov2005; Thomas et al. Reference Thomas, Graham, Ellam and Fallick2004). We studied selected marble occurrences from the islands of Tinos, Andros, Syros, Sifnos and Naxos (Fig. 1a, b), which represent key locations for the tectonometamorphic evolution of the Cyclades. Here, we report field observations, petrographic characteristics and results of various geochemical analyses (Sr, C, O isotopes; selected trace elements).
2. Regional geology
The Attic–Cycladic crystalline belt consists of two major structural units that are separated by low-angle normal faults (e.g. Dürr et al. Reference Dürr, Altherr, Keller, Okrusch, Seidel, Closs, Roeder and Schmidt1978; Okrusch & Bröcker, Reference Okrusch and Bröcker1990; Avigad et al. Reference Avigad, Garfunkel, Jolivet and Azanon1997). The upper unit is poorly exposed (Fig. 1b) and comprises a heterogeneous sequence of unmetamorphosed Permian to Neogene sediments, ophiolites, greenschist-facies rocks with Cretaceous to Tertiary metamorphic ages (Bröcker & Franz, Reference Bröcker and Franz1998, Reference Bröcker and Franz2006), as well as Late Cretaceous granitoids and medium-pressure/high-temperature metamorphic rocks (e.g. Patzak, Okrusch & Kreuzer, Reference Patzak, Okrusch and Kreuzer1994 and references therein). The lower unit (hereafter referred to as the Cycladic blueschist unit) comprises a pre-Alpine crystalline basement and a metamorphosed volcano-sedimentary succession (e.g. Dürr et al. Reference Dürr, Altherr, Keller, Okrusch, Seidel, Closs, Roeder and Schmidt1978; Okrusch & Bröcker, Reference Okrusch and Bröcker1990). Both experienced at least two stages of metamorphism in Tertiary times. During the first stage, eclogite to epidote–blueschist-facies conditions were reached (T = ~ 450–550°C, P = ~ 12–20 kbar; e.g. Bröcker et al. Reference Bröcker, Kreuzer, Matthews and Okrusch1993; Trotet, Jolivet & Vidal, Reference Trotet, Jolivet and Vidal2001). In the northern and central Cyclades, subsequent overprinting occurred at greenschist-facies conditions (T = ~ 450–550°C, P = ~ 4–9 kbar; e.g. Bröcker et al. Reference Bröcker, Kreuzer, Matthews and Okrusch1993; Parra, Vidal & Jolivet, Reference Parra, Vidal and Jolivet2002), whereas the southern Cyclades (e.g. Naxos) experienced amphibolite-facies metamorphism and partial melting (e.g. Buick & Holland, Reference Buick, Holland, Daly, Cliff and Yardley1989). Regional metamorphism was followed by widespread intrusion of granitoids (e.g. Altherr & Siebel, Reference Altherr and Siebel2002). High-pressure (HP) rocks mostly yield Eocene (55–40 Ma) metamorphic ages, while ages for greenschist- to amphibolite-facies rocks cluster in the Late Oligocene and Miocene (c. 25–16 Ma; e.g. Altherr et al. Reference Altherr, Schliestedt, Okrusch, Seidel, Kreuzer, Harre, Lenz, Wendt and Wagner1979, Reference Altherr, Kreuzer, Wendt, Lenz, Wagner, Keller, Harre and Höhndorf1982; Wijbrans & McDougall, Reference Wijbrans and McDougall1988; Wijbrans, Schliestedt & York, Reference Wijbrans, Schliestedt and York1990; Bröcker et al. Reference Bröcker, Kreuzer, Matthews and Okrusch1993, Reference Bröcker, Biehling, Hacker and Gans2004; Bröcker & Franz, Reference Bröcker and Franz1998, Reference Bröcker and Franz2006). HP metamorphism is mostly considered to be restricted to the Eocene (e.g. Tomaschek et al. Reference Tomaschek, Kennedy, Villa, Lagos and Ballhaus2003), but may have started as early as Cretaceous time (c. 80 Ma; Bröcker & Enders, Reference Bröcker and Enders1999, Reference Bröcker and Enders2001; Bröcker & Keasling, Reference Bröcker and Keasling2006).
3. Local geology
On Tinos, a representative fragment of the Attic–Cycladic crystalline belt is exposed in at least three tectonic subunits (Fig. A1 in online Appendix at http://journals.cambridge.org/geo). The two tectonic subunits occupying the highest structural levels (Akrotiri Unit and Upper Unit) belong to the upper main unit of the Attic–Cycladic crystalline belt and record amphibolite- and/or greenschist-facies P–T conditions (e.g. Patzak, Okrusch & Kreuzer, Reference Patzak, Okrusch and Kreuzer1994; Katzir et al. Reference Katzir, Matthews, Garfunkel and Schliestedt1996; Bröcker & Franz, Reference Bröcker and Franz1998). Most of the island is a part of the Cycladic blueschist unit, which is represented by a coherent marble–schist sequence (= Lower Unit; about 1250 m to 1800 m in thickness). Variably rounded meta-ophiolitic blocks and rock fragments of all sizes (mostly < 1 to 10 m, but up to 300 m) occur widely scattered throughout the Lower Unit (Bulle et al. Reference Bulle, Bröcker, Gärtner and Keasling2010). Although remnants of HP rocks are locally preserved, pervasively overprinted rocks with greenschist-facies mineral assemblages are more common (e.g. Melidonis, Reference Melidonis1980; Bröcker et al. Reference Bröcker, Kreuzer, Matthews and Okrusch1993). The whole succession can be subdivided by means of three mappable marble horizons, m3, m2 and m1 (Melidonis, Reference Melidonis1980; Fig. A3 in online Appendix at http://journals.cambridge.org/geo). Phengite-bearing marbles of these horizons were used for Rb–Sr and Ar–Ar white mica geochronology, indicating metamorphic ages ranging between 43 and 24 Ma (Bröcker et al. Reference Bröcker, Biehling, Hacker and Gans2004; Bröcker & Franz, Reference Bröcker and Franz2005). The lowermost part of the metamorphic rock pile, which consists of dolomite marbles and minor phyllites, has been interpreted as a para-authochthonous Basal Unit (Avigad & Garfunkel, Reference Avigad and Garfunkel1989). Other studies considered the basal carbonate sequence as an integral part of the Lower Unit (Melidonis, Reference Melidonis1980; Bröcker & Franz, Reference Bröcker and Franz2005) and related a tectonic contact on top of this sequence to post-orogenic extension (Gautier & Brun, Reference Gautier and Brun1994; Bröcker & Franz, Reference Bröcker and Franz2005). From the dolomites, Melidonis (Reference Melidonis1980) reported findings of Upper Triassic marine fossils. No biostratigraphic remnants are preserved in the calcite marbles occurring at higher lithostratigraphic levels. The depositional age of the metasedimentary sequences has been inferred to be Triassic to Jurassic, but recent U–Pb dating of zircons from siliciclastic rocks documented a Cretaceous age group (c. 80 Ma) that suggests a considerably younger maximum depositional age (C. Gärtner, unpub. M.Sc. thesis, Univ. Münster, 2008; Bulle et al. Reference Bulle, Bröcker, Gärtner and Keasling2010). The Cretaceous ages in metasediments perfectly correlate with U–Pb zircon ages of meta-igneous blocks, lending support to interpretations suggesting an olistostromatic origin for the Cycladic mélange sequences (Bulle et al. Reference Bulle, Bröcker, Gärtner and Keasling2010). In eastern Tinos (Fig. A1), a composite Miocene granitoid intrusion (c. 17–14 Ma; Altherr et al. Reference Altherr, Kreuzer, Wendt, Lenz, Wagner, Keller, Harre and Höhndorf1982; Bröcker & Franz, Reference Bröcker and Franz1998) caused contact metamorphism that affected both the Upper and the Lower Unit (e.g. Avigad & Garfunkel, Reference Avigad and Garfunkel1989; Stolz, Engi & Rickli, Reference Stolz, Engi and Rickli1997; Bröcker & Franz, Reference Bröcker and Franz1994, Reference Bröcker and Franz2000).
On Andros, the metamorphic succession can be subdivided into two tectonic units, the Makrotantalon Unit and the Lower Unit of Central-Southern Andros (Papanikoulaou, Reference Papanikolaou1978a; Figs A2, A3 in online Appendix at http://journals.cambridge.org/geo). The structurally higher Makrotantalon Unit has a thickness of up to 600 m and mainly consists of clastic metasediments and marbles. Metabasic schists are of subordinate importance. Fossil findings in the dolomitic carbonates yielded Permian ages (Papanikolaou, Reference Papanikolaou1978a). The tectonic boundary with the Lower Unit is roughly marked by serpentinites. Judging from structural and geochronological constraints, the Makrotantalon Unit belongs to the upper group of units of the Attic–Cycladic crystalline belt (e.g. Bröcker & Franz, Reference Bröcker and Franz2006). The Lower Unit (up to 1200 m in thickness) can be correlated with the Cycladic blueschist sequences and mainly consists of a volcano-sedimentary sequence that comprises marbles, carbonate-rich schists, clastic metasediments and metavolcanic rocks (Papanikolaou, Reference Papanikolaou1978a). Mineral assemblages document severe greenschist-facies metamorphism, but relict HP rocks can still be found at many places. Judging from field observations, the marble–schist sequences on Andros either represent the stratigraphic continuation or the lithostratigraphic equivalent to the succession exposed in NW Tinos (Papanikolaou, Reference Papanikolaou1978a). Disrupted bodies of ultramafic, meta-gabbroic and meta-acidic rocks (up to several hundred metres in length) were recognized at various lithostratigraphic levels (Papanikolaou, Reference Papanikolaou1978a; Mukhin, Reference Mukhin1996). Some of the occurrences with meta-acidic rock slabs most likely are not part of a mélange, but instead formed by large-scale boudinage processes that affected structurally coherent volcano-sedimentary successions. Ion probe U–Pb zircon dating of such felsic intercalations yielded Triassic protolith ages (~ 240–249 Ma; Bröcker & Pidgeon, Reference Bröcker and Pidgeon2007). For details of the local geology see Papanikolaou (Reference Papanikolaou1978a, Reference Papanikolaoub), Mukhin (Reference Mukhin1996), Bröcker & Franz (Reference Bröcker and Franz2006) and Bröcker & Pidgeon (Reference Bröcker and Pidgeon2007).
On Syros (Figs A1, A3), the largest part of the island belongs to the Cycladic blueschist unit, which occurs in two lithostratigraphic or tectonic subunits: an interlayered marble–schist sequence (up to c. 2000 m in thickness) and a meta-ophiolitic HP mélange (up to c. 200 m) (Dixon & Ridley, Reference Dixon, Ridley and Helgeson1987; Bröcker & Enders, Reference Bröcker and Enders2001). Compared to other Cycladic islands, the series of repeated marble horizons and their total thickness is unusual, which led Dixon & Ridley (Reference Dixon, Ridley and Helgeson1987) to suggest tectonic duplication of an originally thinner sequence. Schumacher et al. (Reference Schumacher, Brady, Cheney and Tonnsen2008) reported a Lower Carboniferous origin (330–350 Ma) for marbles that occur in the upper part of the metamorphic succession that is based on unpublished findings of presumed foraminifera fossils. Such apparent protolith ages are not supported by U–Pb data of detrital zircons that indicate Triassic to Cretaceous or younger sedimentation (S. Keay, unpub. Ph.D. thesis, Australian National Univ. Canberra, 1998). The Cycladic blueschist unit is tectonically overlain by two allochthonous units: the amphibolite-facies Vari gneisses and a greenschist-facies mylonite sequence. These units show no indications for HP metamorphism and most likely represent down-faulted tectonic slices of the upper group of units (Ridley, Reference Ridley, Dixon and Robertson1984).
On Sifnos (Figs A1, A3), the metamorphic succession (c. 2500 m thick) belongs entirely to the Cycladic blueschist unit and can be subdivided into an upper Eclogite-Blueschist and a basal Greenschist Unit (Avigad, Reference Avigad1993; Trotet, Jolivet & Vidal, Reference Trotet, Jolivet and Vidal2001). The Eclogite-Blueschist Unit comprises well-preserved HP rocks intercalated between marble sequences (e.g. Avigad et al. Reference Avigad, Matthews, Evans and Garfunkel1992; Trotet, Jolivet & Vidal, Reference Trotet, Jolivet and Vidal2001). A felsic metatuffaceous layer from the basal part of the Eclogite-Blueschist Unit yielded two Triassic age groups of 226.6 ± 2.0 Ma and 240.4 ± 2.1 Ma (Bröcker & Pidgeon, Reference Bröcker and Pidgeon2007), constraining a maximum depositional age. The Greenschist Unit (c. 1000 m thick) is separated by a low-angle normal fault from the overlying sequences and mainly consists of strongly overprinted clastic metasediments, metabasic rocks and marbles (e.g. Avigad et al. Reference Avigad, Matthews, Evans and Garfunkel1992). HP relics are widespread. The thickness of the inferred crustal interval removed from between both units is controversial (Avigad, Reference Avigad1993; Wijbrans, Schliestedt & York, Reference Wijbrans, Schliestedt and York1990).
On Naxos (Fig. A2), two tectonic units can be distinguished. The Upper Unit mainly consists of non-metamorphosed sediments (e.g. Gautier, Brun & Jolivet, Reference Gautier, Brun and Jolivet1993). The Lower Unit is built up by a migmatite core and a lower grade marble–schist sequence. The migmatite core includes Mesozoic sediments, S-type granites and Variscan orthogneisses. U–Pb zircon dating constrains the time of partial melting to between 20.7 and 16.8 Ma (Keay, Lister & Buick, Reference Keay, Lister and Buick2001). The marble–schist series has experienced Tertiary polymetamorphism of eclogite to blueschist grade overprinted by greenschist- to amphibolite-facies conditions and documents a zonal pattern of increasing metamorphic grade (from ~ 380°C to ~ 700°C) towards the centre of the migmatite dome (e.g. Buick & Holland, Reference Buick, Holland, Daly, Cliff and Yardley1989; Keay, Lister & Buick, Reference Keay, Lister and Buick2001). For meta-bauxite lenses within some marble horizons, Feenstra (Reference Feenstra1985, Reference Feenstra1996) suggested a correlation with non-metamorphic Jurassic bauxites in mainland Greece and the Balkan region, based on geochemical similarities. In the western part of the island, the Lower Unit is bordered by a post-metamorphic granodiorite, which intruded around 12 Ma (Keay, Lister & Buick, Reference Keay, Lister and Buick2001).
4. Samples
The calcite marbles are fine- to medium-grained rocks that occur in medium- to thick-bedded sequences of variable thickness (< 1 m to several tens of metres) and lateral extent. Individual occurrences are often disrupted by large-scale boudinage. At the outcrop- or hand specimen scale, the calcite marbles show all colour gradations between white and dark grey, often in alternating layers. Other colour varieties are absent. The mineral assemblage mostly consists of calcite, but dolomite is present in some samples. As accessory phases, phengite, quartz, albite, chlorite and graphite may occur. If present, phengite is often enriched on bedding surfaces. Both hetero- and homeoblastic textures are common. Adjacent domains with widely differing crystal sizes may have different isotopic compositions that can affect the results and interpretations. However, rejection of such material would have completely excluded distinct marble horizons. Highly strained textures are rare. Locally the marbles are isoclinally folded. The m1 marbles are always intercalated with millimetre to decimetre thick quartzite layers (Avigad & Garfunkel, Reference Avigad and Garfunkel1989; Bröcker & Franz, Reference Bröcker and Franz2005). From Tinos, we selected samples that represent the three major marble horizons m3, m2 and m1, and the fossil-bearing lowermost dolomite. From Andros, we chose the m4 and m1 calcite marbles that occur in the upper and lower part of the Lower Unit. The focus on these occurrences ensures complete vertical coverage of the litho- or tectonostratigraphic succession. On Sifnos, we concentrated on marbles from the basal part of the Eclogite-Blueschist Unit that occur above and below the meta-tuffaceous horizon dated by Bröcker & Pidgeon (Reference Bröcker and Pidgeon2007). The sample location is at Agios Ekaterini near Kamares (Fig. A1). On Syros, we collected samples from a large operating quarry located near Kini, and marbles from the Kampos area (Fig. A1) which show distinct textures resembling pseudomorphs after metamorphic aragonite (Brady et al. Reference Brady, Markley, Schumacher, Cheney and Bianciardi2004). On Naxos, we focused on marbles that occur closely associated with meta-bauxite lenses. Samples were collected along the road-cut from Koronas to Lionas and near the emery mines that are located NW of Moutsana (Fig. A2).
The dolomites from the Panormos area on Tinos (> 100 m in thickness) are poorly bedded massive rocks. Their colour is less white than the calcite marbles and shows a weak yellowish tint. Locally a breccia structure is developed, but its origin is unclear. Melidonis (Reference Melidonis1980) reported well-preserved Triassic (Norian–Rhaetian) fossils (calcareous algae: Heteroporella, Garwoodia, Cayeuxia, Halimeda, Solenopora and corals: Thecosmilia clathrata). Dolomite-rich marbles of the Makrotantalon Unit occur in at least two stratigraphic horizons (c. 5–30 m and c. 2–20 m thick) with numerous fossiliferous outcrops (calcareous algae, foraminifera and corals) that document Early and Middle to Upper Permian ages, respectively (Papanikolaou, Reference Papanikolaou1978a, Reference Papanikolaoub).
In order to avoid complexities caused by diffusional exchange (e.g. Baker et al. Reference Baker, Bickle, Buick, Holland and Matthews1989; Ganor, Matthews & Paldor, Reference Ganor, Matthews and Paldor1989, Reference Ganor, Matthews and Paldor1991; Ganor, Matthews & Schliestedt, Reference Ganor, Matthews and Schliestedt1994; Bickle et al. Reference Bickle, Chapman, Wickham and Peters1995), our sampling strategy aimed to obtain samples collected at least 0.5–1 m away from contacts with schists. In several cases, however, the outcrop situation either did not allow us to determine the distance to the next lithological contact, or required sampling at a closer distance to the contact. In order to ensure representative regional coverage as well as complete coverage across the metamorphic succession, such samples were not a priori excluded from further consideration.
From a total of c. 150 samples, 75 samples were selected for geochemical studies after petrographic screening under the microscope. Sample selection is based on the assumption that the isotope compositions of bulk samples provide a fit-for-purpose approximation to the original signatures. The presence of dolomite and calcite was determined by staining thin-sections with Alizarin Red-S (Friedman, Reference Friedman1959) and X-ray diffraction of powdered rock material. The main emphasis during final sample selection was to obtain mica-free or mica-poor samples that would be most suitable for Sr-isotope chemostratigraphy. From an early stage on, this approach excluded a relatively large number of marble outcrops, causing a significant disadvantage for regional correlations. In order to assess the isotope geochemical characteristics of ‘less-suitable’ marbles we have also studied some mica-rich samples from Tinos and Sifnos, but in this case concentrated on calcite mineral separates. Sample locations are shown in Figures A1, A2 and Table A1 in the online Appendix at http://journals.cambridge.org/geo. Petrographic information is summarized in Table A2, and pictures of typical hand specimens and thin-sections are depicted in Figures A4–A13 in the online Appendix.
5. Analytical methods
Samples containing very low modal amounts of white mica were studied as whole rocks. For sample preparation, a c. 1 cm thick and 2 × 5 cm rectangular rock slice was cleaned with de-ionized water in an ultrasonic bath and rinsed in ultrapure ethanol. The clean material was crushed in a steel mortar and pulverized in an agate mill. Pre-leaching that is widely used in sample preparation of non-metamorphic carbonates to remove late calcite and/or other contaminants was not performed because all studied samples have experienced diagenesis and complete recrystallization during polyphase metamorphic overprinting. Surface contamination can be ruled out because we studied rock slices with fresh surfaces on all sides that were cut out from the inner part of larger slabs. In the case of higher phengite abundance, the crushed sample was sieved and carbonates were hand-picked from the 180–200 μm grain-size fraction to minimize contamination with micas. Before dissolution, mineral separates were carefully washed in de-ionized water and ultrapure ethanol.
Sr-isotope analyses were carried out at the Institut für Mineralogie, Universität Münster. For this purpose, c. 100 mg of whole-rock powder or c. 20–50 mg of calcite were dissolved in a H2O–HCl (2.5 N) mixture on a hot plate overnight. After drying, 2.5 N HCl was added and this mixture was homogenized on a hot plate overnight. After a second evaporation to dryness and centrifugation to remove any residues, Sr was separated by standard ion-exchange procedures (AG 50W-X8 resin) on quartz glass columns using 2.5 N HCl as eluent. For whole-rock samples, a Sr contribution from acid leaching of insoluble impurities (phengite, albite) cannot be completely ruled out, but is considered negligible because, based on thin-section work, samples with considerable amounts of phengite were excluded from further analyses. Consequently, most whole-rock samples display very low Rb concentrations (< 2 ppm) indicating that correction for radiogenic 87Sr is not required. No significant Sr contribution can be expected from albite. Nevertheless, only the lowest values within individual marble groups should be considered as best approximation to the composition of contemporaneous seawater. Mass-spectrometric analysis was carried out using a ThermoFinnigan Triton TIMS for Sr (static mode). Sr was loaded with HCl and TaF5 on W filaments. Correction for mass fractionation is based on a 86Sr/88Sr ratio of 0.1194. Total procedural blanks for Sr were less than 0.1 ng. During two analytical sessions, repeated runs of NBS standard 987 yielded average 87Sr/86Sr ratios of 0.710221 ± 0.000034 (2σ, n = 22) and 0.710220 ± 0.000016 (2σ, n = 12), respectively. 87Sr/86Sr sample data were normalized to an NBS standard 987 value of 0.710248. The value obtained for the USGS EN-1 standard was 0.709135 ± 0.000016 (2σ, n = 12). Reproducibility was further evaluated by replicate analyses of nine samples.
C- and O-isotope measurements were carried out at the Institut für Geologie und Paläontologie, Universität Münster, using a GasBench connected to a ThermoFinnigan Delta plus XL mass spectrometer via a ConFlo III interface. For individual runs, a sample weight of c. 30 μg was used. Results are reported in the standard delta notation as per mil difference relative to V-PDB (Vienna Pee Dee Belemnite). Accuracy was checked against standards IAEA-CO-1 and IAEA-CO-8. Reproducibility, as determined through replicate measurements, was better than ± 0.2 ‰.
Major and trace elements were analysed by Actlabs, Ancaster, Ontario, with ICP-MS methods (Code 4B analytical package). Rb concentrations were determined with X-ray fluorescence spectrometry in pressed pellets (Code 4C1 analytical package). Detection limits for Fe2O3, MnO, Sr and Rb are 0.01 wt%, 0.001 wt%, 0.2 ppm and 2 ppm, respectively.
6. Results
6.a. Bulk rock composition and isotope characteristics (Sr, O, C) of mica-poor marbles
6.a.1. Bulk rock compositions
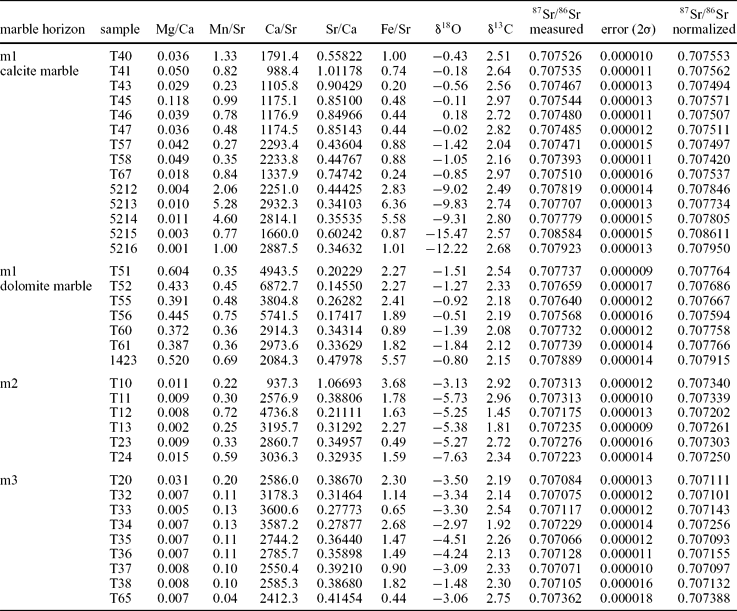
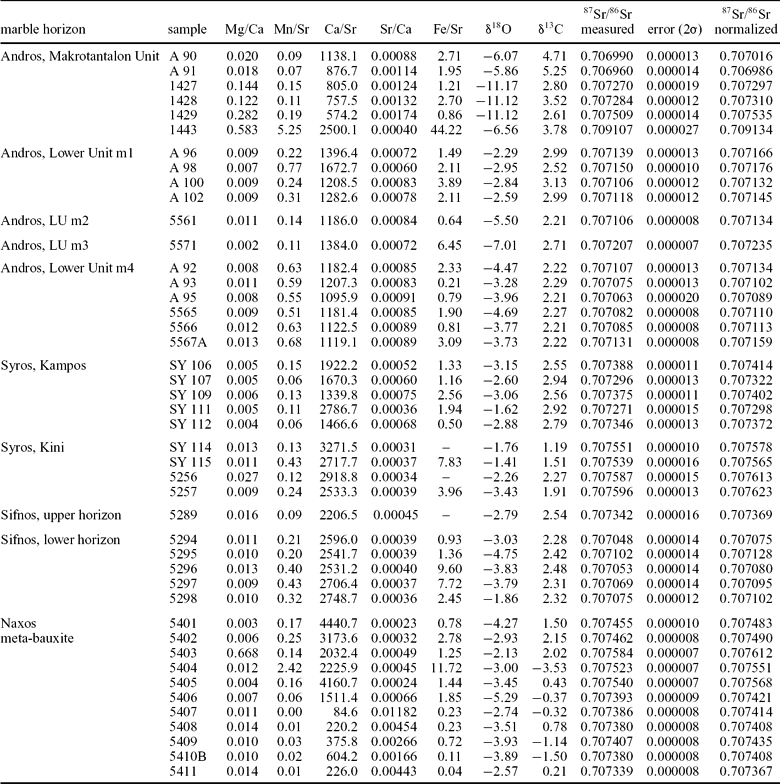
Geochemical data (Table A3 in online Appendix at http://journals.cambridge.org/geo) indicate that the calcite marbles are relatively pure rocks with minor terrigenous contamination. M2 and m3 marbles from Tinos have MgO concentrations that are mostly < 1.0 wt% (Mg/Ca < 0.02), whereas m1 marbles from this island are characterized by more variable MgO contents (< 0.1–6.7 wt%; Mg/Ca up to 0.12), owing to different abundances of dolomite. K2O and Al2O3 concentrations are mostly low (< 0.15 wt% and < 0.1 wt%, respectively). SiO2 concentrations are more variable (mostly < 0.2 wt%) with a maximum of 1.54 wt% in the Tinos m1 marbles. Rb concentrations are very low (< 2–6 ppm). Sr concentrations range from 86 to 418 ppm, with most samples between 150 and 250 ppm. Bulk compositions of calcite marbles from Andros, Syros, the lower horizon on Sifnos and Naxos show mostly similar ranges (MgO mostly < 1.0 wt%, K2O < 0.1 wt%, Al2O3 < 0.26 wt%, Rb < 2–4 ppm, Sr 90–353 ppm). However, samples from Naxos are characterized by more variable SiO2 and Rb contents (0.1–1.45 wt% and < 2–36 ppm, respectively) and significantly higher Sr concentrations than observed in samples from other islands (up to ~ 4650 ppm) (Table A3). Dolomitic marbles from Tinos display Mg/Ca ratios between 0.37 and 0.60. Concentrations of SiO2 (0.07–0.43 wt%, mostly < 0.2 wt%), Al2O3 (mostly < 0.03 wt%) and K2O (< 0.1 wt%) are low, and Sr, Rb and Mn concentrations vary from 44 to 113 ppm, < 2 to 6 ppm and 15 to 77 ppm, respectively. Marbles from the Makrotantalon Unit on Andros are characterized by a broader range in MgO concentrations (1.15–21.02 wt%) indicating variable modal abundance of dolomite (Table A3).
6.a.2. Sr-isotope ratios
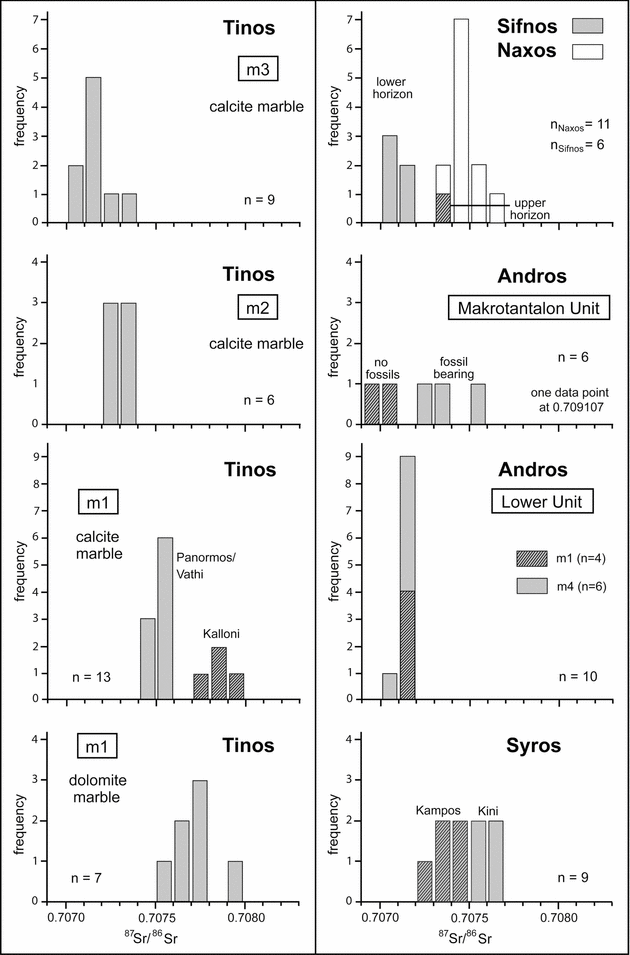
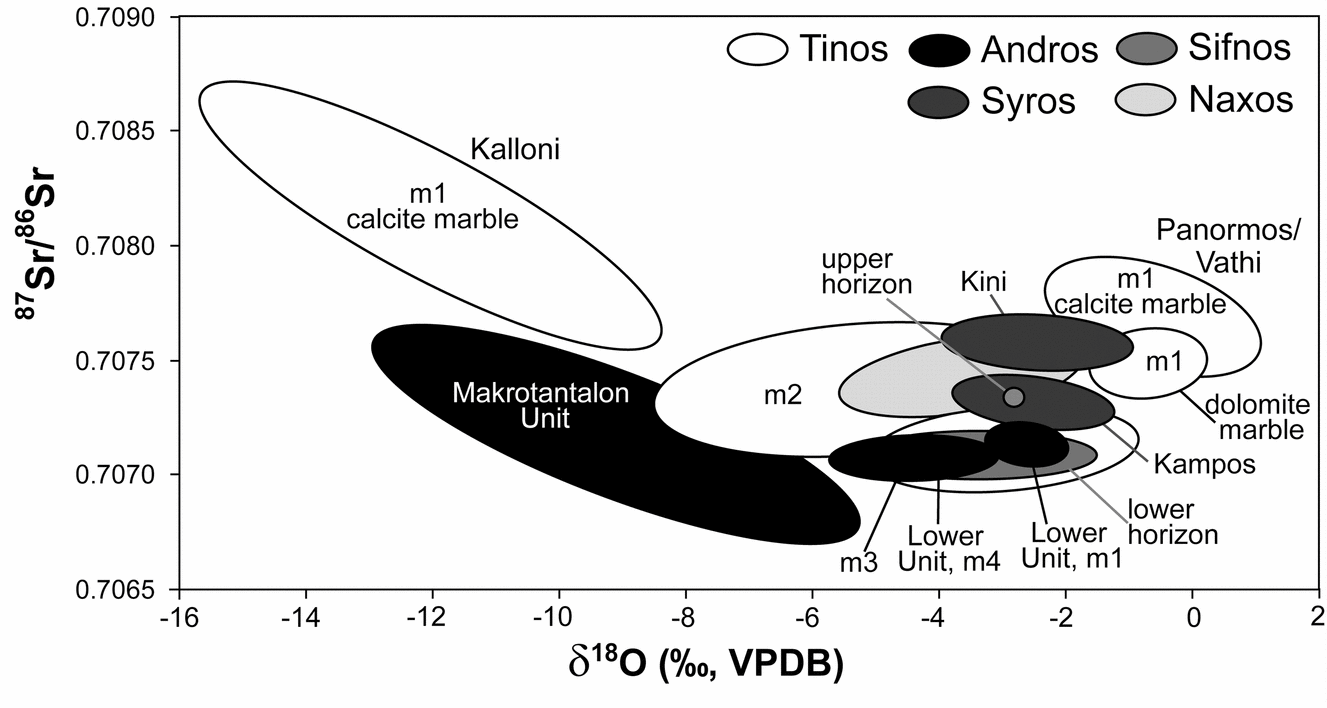
With the exception of two data points, the 87Sr/86Sr isotope ratios of all samples fall within the range between 0.70698 and 0.70800. On Tinos, the most radiogenic Sr signatures are recorded by m1 marbles from Kalloni (0.70773–0.70861) and the dolomite marbles from the Panormos area (0.70759–0.70792), which can both be distinguished from the Panormos m1 marble (0.70742–0.70756). The Tinos m2 and m3 calcite marbles occurring at higher lithostratigraphic levels are less radiogenic (0.70720–0.70734 and 0.70709–0.70739, respectively). Despite some overlap, there is a clear trend of decreasing 87Sr/86Sr values from the m1 marbles towards samples collected from the m2 and m3 horizons (Fig. 2; Table 1). A similar trend has not been observed on Andros where both the lowermost m1 and the topmost m4 marble, which bracket the entire metamorphic succession, show very similar 87Sr/86Sr values (0.70709–0.70718; Fig. 2; Table 1). Here, no suitable m2 and m3 marbles are available, as they are all mica-rich and/or strongly weathered. The Sr-isotope data for fossil-bearing and dolomite-rich samples from the Makrotantalon Unit show considerable scatter between 0.70699 and 0.70913. Two calcite marbles from this unit yielded 87Sr/86Sr ratios similar to those of m1 and m4 marbles from the Lower Unit. Sr-isotope ratios for the m3 marble on Tinos closely correspond to the Sr-isotope data for the m1 and m4 marbles from Andros, and marbles occurring on top of the radiometrically dated greenschist-gneiss sequence from Sifnos. Samples from two different occurrences on Syros show distinct Sr-isotope characteristics. Marbles from the Kini quarry show values between 0.70756 and 0.70762, whereas Sr-isotope ratios of marbles from Kampos are between 0.70729 and 0.70741. Sr ratios of marbles from Naxos are similar to those from Syros and vary between 0.70737 and 0.70761 (Fig. 2; Table 1).
Histograms showing 87Sr/86Sr values of ‘best quality’ (= mica-free or mica-poor) samples, representing various marble units of the Cycladic blueschist belt. For a colour version of this figure see online Appendix at http://journals.cambridge.org/geo.

Selected element ratios and 87Sr/86Sr-, δ18O- and δ13C-values for marbles from Tinos

6.a.3. O- and C-isotope values
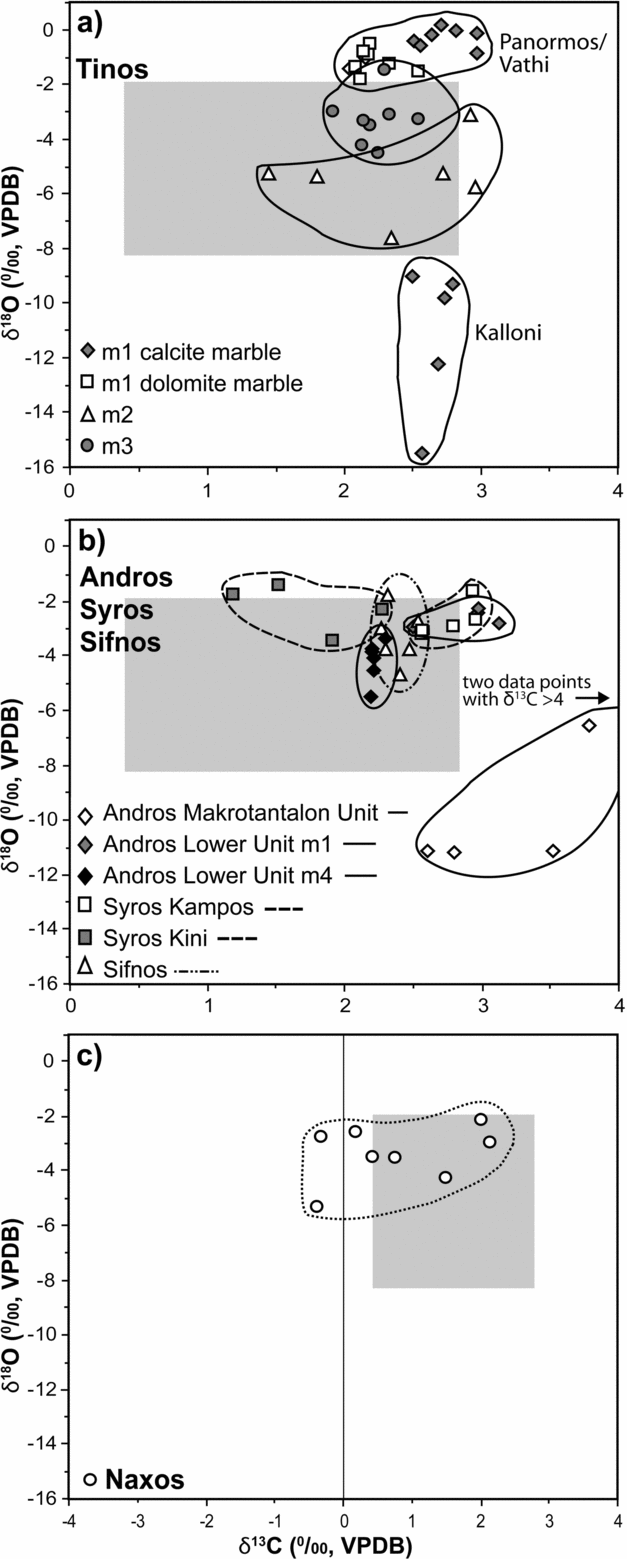
Marbles from Tinos display the highest variability in δ18O with values between −15.5 ‰ and +0.2 ‰ (Tables 1, 2). Despite considerable overlap for some occurrences, δ18O values allow several subgroups to be distinguished (Figs 3, 4). Most samples, however, including all Tinos m3 and one m2 marbles, the Andros m1 and m4 marbles, all samples from Sifnos and Syros, and 10 of 11 samples from Naxos, fall within a relatively narrow δ18O range of −4.8 ‰ to −1.4 ‰. Most of the Tinos m2 marbles and all samples from the Makrotantalon Unit yielded δ18O values varying between −7.6 ‰ and −5.3 ‰ and between −11.2 ‰ and −5.9 ‰, respectively (Fig. 4; Tables 1, 2). δ13C values of most samples overlap and fall within the range of 1.0–3.2 ‰ (Fig. 3; Tables 1, 2). Exceptions are the higher δ13C values of the fossil-bearing samples from the Makrotantalon Unit (1427, 1429, 1443: 3.5 to 5.3 ‰) and the relatively low values (< 1 ‰ to −3.5 ‰) for many samples from Naxos.
Selected element ratios and 87Sr/86Sr-, δ18O- and δ13C-values for marbles from Andros, Syros and Sifnos

δ18O v. δ13C diagram showing isotope data of ‘best quality’ (= mica-free or mica-poor) marbles from the Cycladic blueschist belt. Grey field outlines oxygen- and carbon-isotope compositions of marbles from the western Cyclades (Ganor, Matthews & Schliestedt, Reference Ganor, Matthews and Schliestedt1994) that were collected more than 1 m away from a contact with schists.

87Sr/86Sr v. δ18O diagram showing isotope data of ‘best quality’ (= mica-free or mica-poor) marbles from the Cycladic blueschist belt. For a colour version of this figure see online Appendix at http://journals.cambridge.org/geo.

6.b. Sr-, C- and O-isotope characteristics of calcite from mica-rich marbles
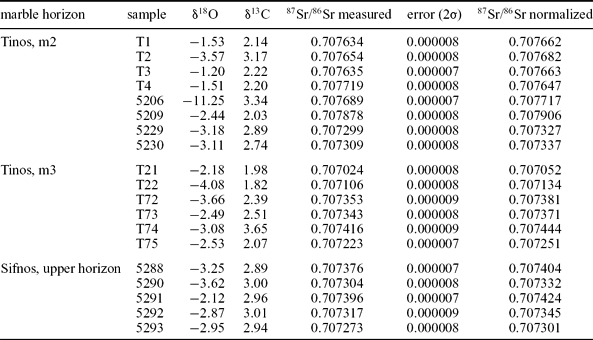
The Sr-isotope characteristics of mica-rich m3 marbles from Tinos (Table 3) are broadly within the range observed for mica-poor samples (Table 1), but a trend towards higher values is obvious. In the case of the Tinos m2 marbles, six out of eight mica-rich samples are characterized by considerably higher 87Sr/86Sr values than mica-poor m2 samples. Mica-rich marbles from the upper horizon of the Kamares area on Sifnos show values between 0.70730 and 0.70742, and can clearly be distinguished from the mica-poor lower horizon (0.70708–0.70713) of this location. O- and C-isotope values of mica-rich samples from Tinos (Table 3) are within the same range as the mica-poor samples (Table 1). A difference between both groups exists for samples from Sifnos (Tables 2, 3). Here, δ13C values from mica-poor samples are less positive than mica-rich samples. The δ18O range of marbles from Sifnos, however, is comparable.
87Sr/86Sr-, δ18O- and δ 13C-values for mica-rich marbles from Tinos and Sifnos

7. Discussion
7.a. Is it possible to use the Sr-, O- and C-isotope ratios of Cycladic marbles for regional correlations?
Owing to their distinct mineralogical composition and colour, marbles are used on some islands to subdivide monotonous schist sequences. However, the lack of distinctive petrographic characteristics (e.g. colour, principal components, characteristic accessory phases, depositional textures) prevents utilization of the metamorphic carbonates for island-to-island correlations. The present study aimed to identify distinctive Sr-, O- and C-isotope characteristics for specific marble horizons that would allow establishment of improved regional correlations and lithostratigraphic subdivision within the study area. For this objective, all samples including the mica-rich marbles were taken into consideration. For general geochemical fingerprinting across the study area, even severely altered marbles have the potential to serve as valuable marker horizons. We focused on systematic sampling of marbles from Tinos and Andros, and studied to a lesser extent marbles from Syros, Sifnos and Naxos. In the case of Naxos, previous studies documented the potential of marble O- and C-isotope data for archaeological fingerprinting (e.g. Herz, Reference Herz1987, Reference Herz1992; Cramer, Reference Cramer1998 and references therein). For Syros and Sifnos, the database is yet too small to fully determine its significance for this purpose.
On a local scale, Sr-, O- and C-isotope characteristics allow discrimination of some occurrences from the total marble population. Based on their 87Sr/86Sr values, the upper and lower horizon exposed in the Kamares area on Sifnos can clearly be distinguished. The Naxos samples show similarities to marbles from Syros, but are clearly separated from marbles occurring on Tinos (m3), Andros (m4–m1) and Sifnos (upper Kamares horizon) (Fig. 2). The combination of Sr- and O-isotope signatures also allows distinguishing between some marble occurrences on Tinos and Andros (Fig. 4). On the other hand, many marbles show significant overlap of Sr-, O- and C-isotope ratios, which either documents primary compositional characteristics or the influence of various post-depositional alteration processes. For example, the 87Sr/86Sr ratios for marbles from Andros (m4 and m1), Tinos (m3) and Sifnos (upper marble horizon) are almost identical. This may indicate simultaneous carbonate precipitation in an area of larger extent and would justify a correlation of these occurrences. In this case, identical Sr-isotope values of marbles representing the lowest and highest parts of the metamorphic succession on Andros would be in accordance with models either suggesting isoclinal folding/thrusting of a single horizon, or very fast sedimentation. However, owing to repeated oscillations of the seawater curve in the most likely Mesozoic–Cenozoic interval of sediment formation, identical Sr-isotope values may also record different protolith ages, possibly implying non-existing temporal and spatial relationships for distinct marble horizons. At this point, we cannot prove or disprove which of these alternatives are correct. With the available information at hand, it cannot be assessed to what extent original Sr signals are preserved. The interpretation of O- and C-isotope data faces similar problems.
The present study complements existing data sets for identification of archaeological provenance of Aegean marbles (e.g. Lazzarini & Antonelli, Reference Lazzarini and Antonelli2003; Capedri, Venturelli & Photiades, Reference Capedri, Venturelli and Photiades2004; Brilli, Cavazzini & Turi, Reference Brilli, Cavazzini and Turi2005; Zöldföldi & Satir, Reference Zöldföldi, Satir, Wagner, Pernicka and Uerpmann2003), but the suitability of Sr-, O- and C-isotope ratios for correlating marble horizons occurring on different Cycladic islands cannot be demonstrated. The Sr-, O- and C-isotope ratios, alone or in various combinations, are not diagnostic enough to unravel mutual relationships between individual marble occurrences.
7.b. Sr-isotope chemostratigraphy: criteria for sample selection
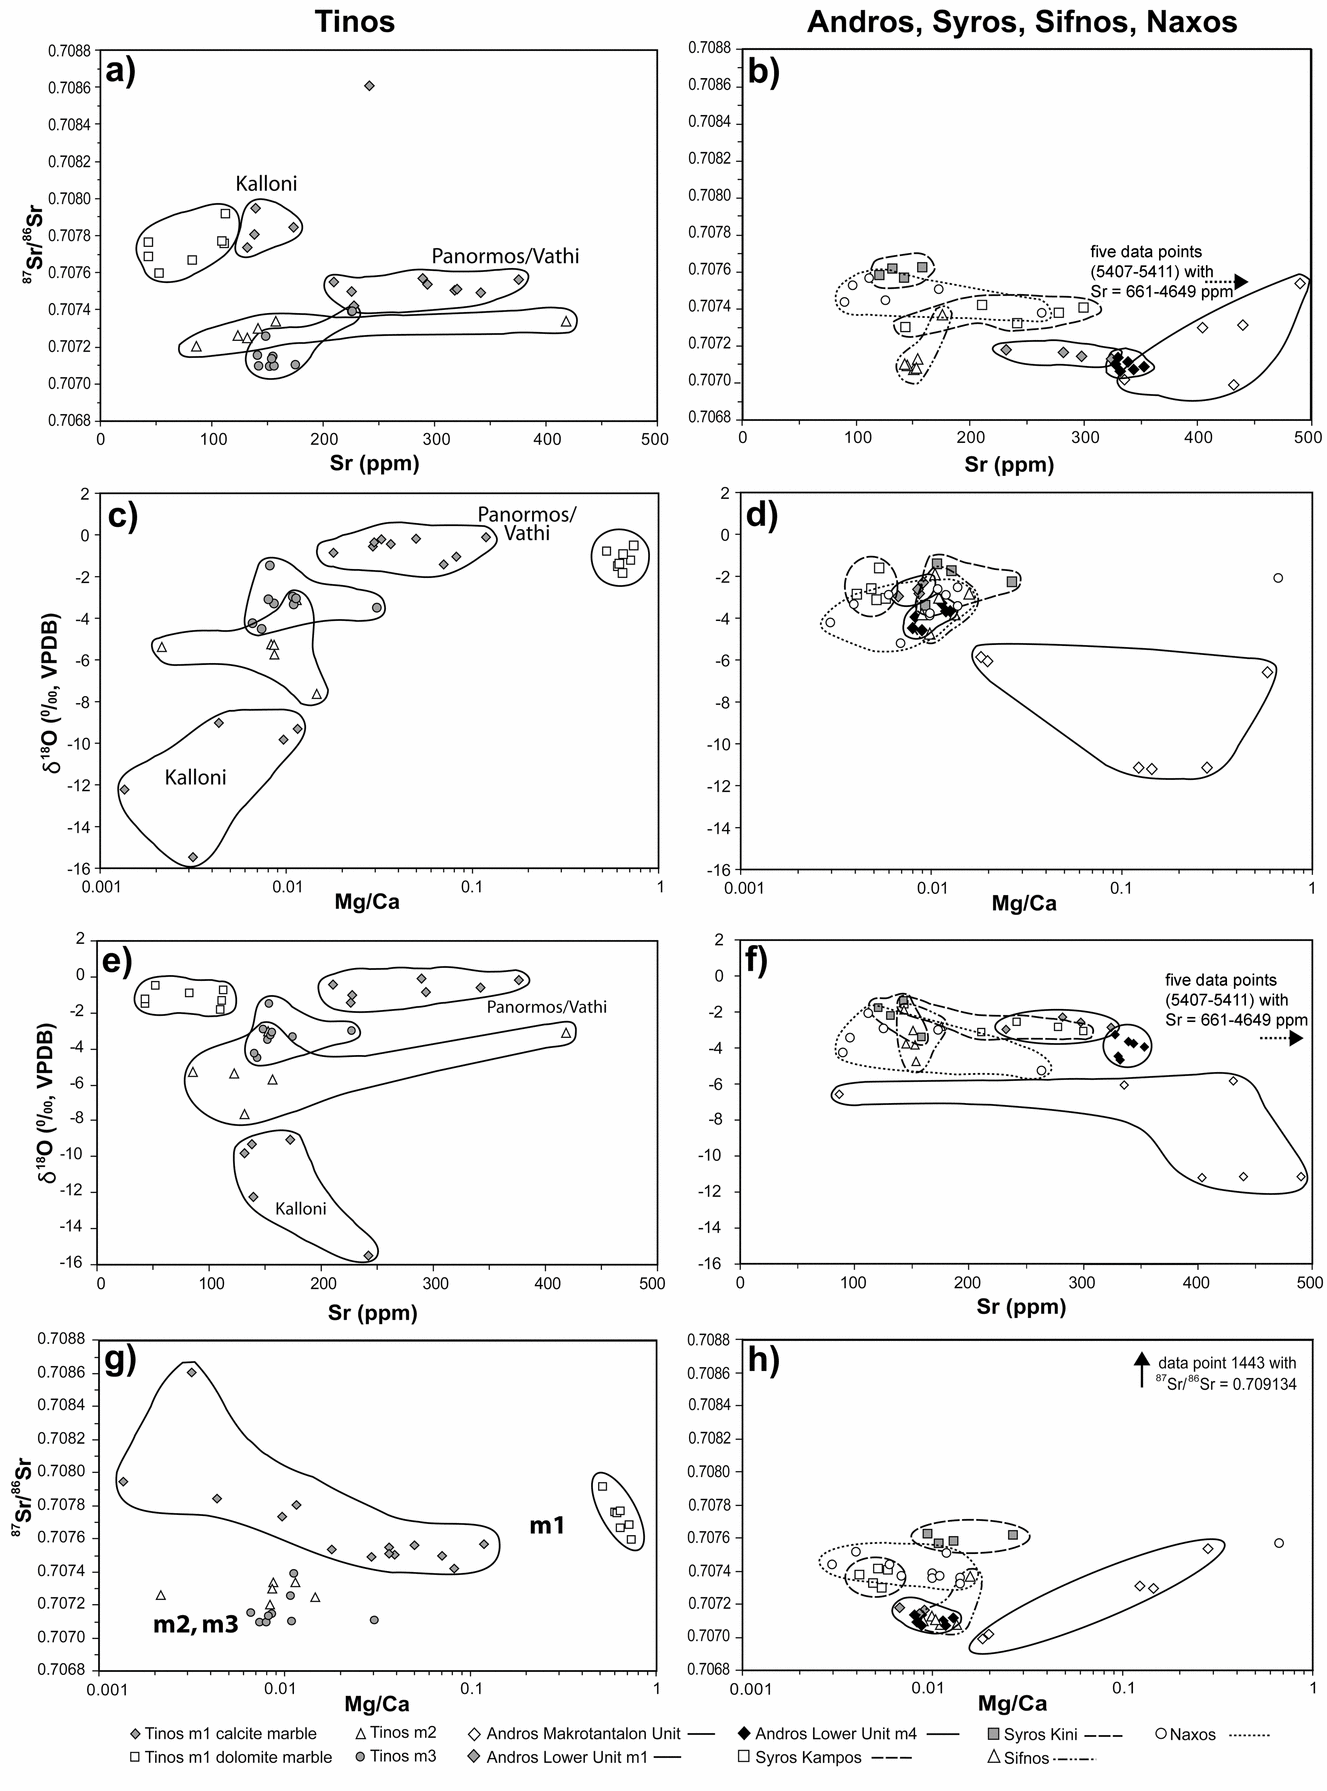
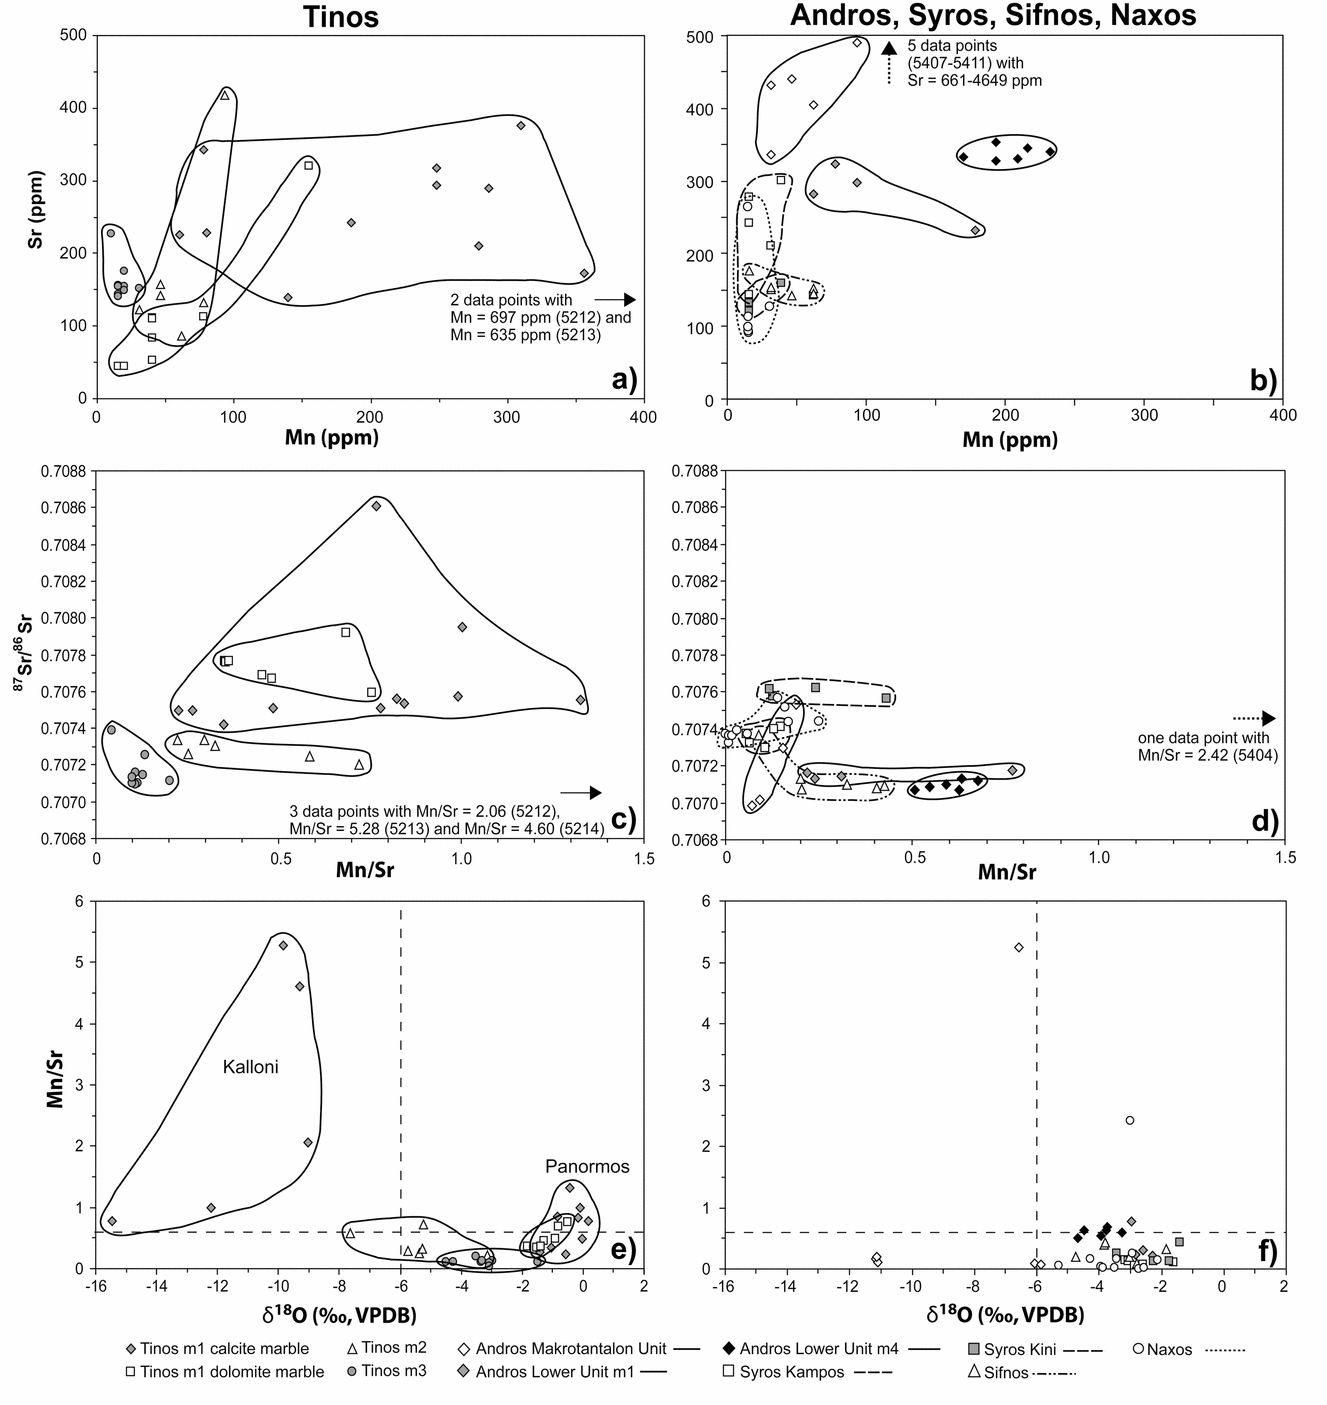
In principle, Sr-isotope chemostratigraphy can provide a depositional age of marine carbonates, if their 87Sr/86Sr ratios have not been altered substantially through post-depositional processes. These include diagenesis (compaction, cementation, dissolution, recrystallization, replacement of aragonite by calcite, interaction with meteoric waters, e.g. Scholle & Ulmer-Scholle, Reference Scholle and Ulmer-Scholle2003) as well as alteration during metamorphic overprinting (e.g. recrystallization, diffusional exchange, deformation, interaction with metamorphic fluids). In addition, modifications of the 87Sr/86Sr values can result from contamination with terrigenous components. Individually or combined, all these processes can have a considerable effect on the apparent age derived from the 87Sr/86Sr ratio. Hence, a rigorous sample screening is necessary in order to identify the least altered rocks. In order to select the most promising samples, we applied a combination of petrographic criteria (rejection of domains with microveins, only mica-free or mica-poor marbles) and geochemical parameters (Figs 5, 6) with the main emphasis on Mn/Sr, δ18O and δ13C values.
Selected geochemical parameters for ‘best quality’ (= mica-free or mica-poor) marbles from the Cycladic blueschist belt. Left-hand column – Tinos; right-hand column – Andros, Syros, Sifnos, Naxos. For a colour version of this figure see online Appendix at http://journals.cambridge.org/geo.

Sr v. Mn, 87Sr/86Sr v. Mn/Sr and Mn/Sr v. δ18O diagrams for ‘best quality’ (= mica-free or mica-poor) marbles from the Cycladic blueschist belt. Left-hand column – Tinos; right-hand column – Andros, Syros, Sifnos, Naxos. Dashed lines indicate the screening parameters Mn/Sr = 0.6 and δ18O = −6 ‰. For a colour version of this figure see online Appendix at http://journals.cambridge.org/geo.

Increased Mn concentrations are considered to represent a sensitive indicator of meteoric diagenetic processes, and the Mn/Sr ratio is often taken as a parameter to identify the least altered samples, although different threshold values have been proposed (e.g. Kaufman & Knoll, Reference Kaufman and Knoll1995; Thomas et al. Reference Thomas, Graham, Ellam and Fallick2004 and references therein). In this study, we follow Thomas et al. (Reference Thomas, Graham, Ellam and Fallick2004) and consider samples with Mn/Sr values < 0.6 as suitable for Sr-isotope chemostratigraphy. Some studies suggested that δ18O isotope values < −6 ‰ also indicate that samples are too altered for Sr-isotope stratigraphy (Kaufman & Knoll, Reference Kaufman and Knoll1995; Fölling & Frimmel, Reference Fölling and Frimmel2002). O- and C-isotope studies of Cycladic marbles showed that δ18O and δ13C values of marbles collected away from contacts with schists record the isotopic composition of marine carbonates (e.g. Ganor, Matthews & Paldor, Reference Ganor, Matthews and Paldor1989, Reference Ganor, Matthews and Paldor1991). For marbles from Tinos, Sifnos and Kithnos that were collected at least 1 m away from a lithological contact, Ganor, Matthews & Schliestedt (Reference Ganor, Matthews and Schliestedt1994) reported O-isotope values of −1.95 ‰ to −8.25 ‰ (recalculated to V-PDB from SMOW (Standard Mean Ocean Water) values of 22.4 ‰ to 28.9 ‰, respectively) and δ13C values of 0.4 ‰ to 2.8 ‰ (Fig. 3) with the alteration trend directed towards more negative δ18O and δ13C values. Similar isotope characteristics were reported by Baker et al. (Reference Baker, Bickle, Buick, Holland and Matthews1989) for unaltered marbles from Naxos. The most recent isotope study from Naxos documented an accumulation of δ18O and δ13C data points for marbles that were collected > 1 m from lithological contacts at −2 ‰ to −9 ‰ and 0 to 4 ‰, respectively (Ebert et al. Reference Ebert, Gnos, Ramseyer, Spandler, Fleitmann, Bitzios and Decrouez2010). Ganor, Matthews & Schliestedt (Reference Ganor, Matthews and Schliestedt1994) also showed that very low δ13C values (−2.2 ‰ to −11.5 ‰) are diagnostic for samples containing late calcite overgrowths or veins.
Using the Mn/Sr criterion, the degree of preservation of primary 87Sr/86Sr signatures is highly variable (see Table 1). On Tinos, all m1 samples from the Kalloni location, half of the m1 sample population from Panormos and two out of six samples representing the m2 marble horizon are considered to be too altered for Sr chemostratigraphy. The lowest Mn/Sr ratios (< 0.2) were recognized in samples collected from the m3 marble horizon. Five out of seven dolomites from the Panormos area are characterized by Mn/Sr < 0.6. With few exceptions, the new O- and C-isotope results (Tables 1, 2) are within the compositional ranges observed for marbles that are unaffected by diffusional exchange (e.g. Ganor, Matthews & Schliestedt, Reference Ganor, Matthews and Schliestedt1994; Ebert et al. Reference Ebert, Gnos, Ramseyer, Spandler, Fleitmann, Bitzios and Decrouez2010). Based on δ18O and δ13C values, the marbles from Tinos can be separated into four groups (Fig. 3a), mostly according to the different marble horizons. δ18O values corroborate that m1 marbles from Kalloni are too altered for Sr-isotope stratigraphy. Most samples from the m2 horizon and all m3 samples appear to be suited for Sr chemostratigraphy, using the Mn/Sr–δ18O data. This also pertains to m1 calcite marbles from Panormos and m1 dolomite marbles (Fig. 6e). Most marbles from Andros, Syros, Sifnos and Naxos show no correlation between the Mn/Sr ratios and δ18O isotope values (Fig. 6f) and plot within the compositional ranges for non-altered marbles. Three samples from Naxos were excluded from further consideration because of δ13C values < −1 ‰ and/or Mn/Sr > 0.6. Five out of six samples from the Makrotantalon Unit on Andros are characterized by favourable Mn/Sr ratios. However, δ18O and/or δ13C suggest alteration. Nevertheless, we accepted the two apparently least altered samples (δ13C = 4.71 and 5.25), because biostratigraphic control is available.
Most of the studied marbles are characterized by relatively low Sr concentrations that possibly indicate considerable Sr loss during the aragonite–calcite transformation. Although the Mn/Sr ratios often are in accordance with low degrees of alteration, and would even be more favourable in the case of higher Sr contents, a high degree of uncertainty remains over what extent the primary Sr-isotope signal is still preserved.
7.c. Is it possible to extract ages from the screened data set?
The 87Sr/86Sr values for the least altered samples intersect the seawater curve multiple times within the likely time interval of original carbonate precipitation (< 240 Ma; as indicated by SHRIMP U–Pb zircon data; e.g. Bröcker & Pidgeon, Reference Bröcker and Pidgeon2007). Thus, an unequivocal age assignment is not possible. At least in the present example, Sr-isotope chemostratigraphy requires bracketing age constraints from radiometric dating and/or biostratigraphy. Such well-defined chronometric fixed points are available for some parts of the studied metamorphic successions.
7.c.1. Tinos
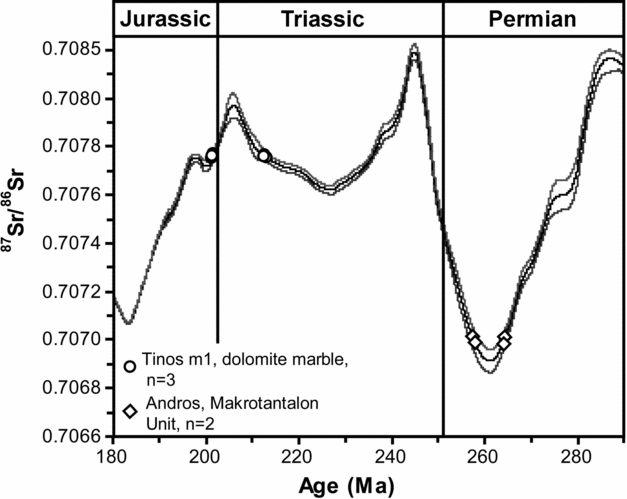
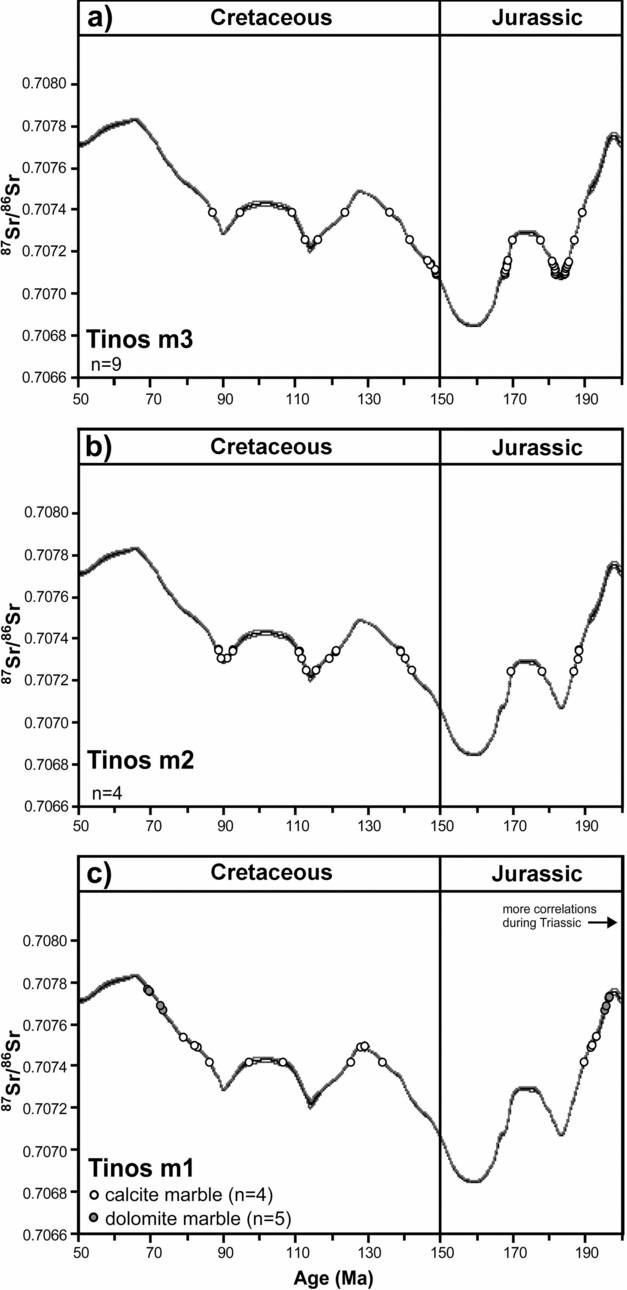
There is general consensus that a tectonic contact separates the m1 calcite marbles from a lower fossil-bearing dolomite sequence; however, the nature of this fault zone is unclear and has either been related to thrusting or extensional processes (Avigad & Garfunkel, Reference Avigad and Garfunkel1989; Bröcker & Franz, Reference Bröcker and Franz2005). Matthews et al. (Reference Matthews, Lieberman, Avigad and Garfunkel1999) showed that the fault zone and adjacent rock volumes are characterized by lowered C- and O-isotope values, which were explained by focused fluid infiltration of externally derived low δ18O–δ13C fluids along the tectonic contact. It is not clear whether or not this process has also influenced the Sr-isotope values. Nevertheless, the m1 calcite marbles and the dolomites have Sr-isotope signatures that roughly correspond to the Rhaetian–Norian fossil record of the dolomites (Melidonis, Reference Melidonis1980; Fig. 7), suggesting an age of 190–215 Ma for carbonate formation. The 87Sr/86Sr data would be in accordance with an interpretation that suggests a relatively small age difference between the rock sequences occurring on both sides of the fault zone. Least altered m2 and m3 marbles that occur at higher lithostratigraphic levels show a relatively small range in 87Sr/86Sr (0.70709–0.70739) that can be projected onto various Jurassic and Cretaceous limbs of the oscillating seawater curve (Fig. 8a, b). The distinct Sr-isotope values for samples collected at different levels of the lithostratigraphic succession suggest that these layers represent a temporal succession and not the tectonic repetition of a single horizon. If we accept this interpretation, the m2 marble should be older than the m3 horizon. This would encourage an interpretation that postulates a c. 185–190 Ma age for the m2 marbles, but still leaving several Jurassic and Cretaceous intercept options for the m3 marbles (Fig. 8a, b). In the case that the interpretation of 80 Ma old zircons in clastic metasediments as detrital phases is correct (Bulle et al. Reference Bulle, Bröcker, Gärtner and Keasling2010), most 87Sr/86Sr values for the m3 marbles would suggest an age that is older than predicted by the U–Pb data.
Apparent depositional ages for marbles from fossil-bearing horizons from Tinos and Andros as indicated by the marine Sr-isotope curve of McArthur et al. (Reference McArthur, Howarth and Bailey2001, LOWESS table 4b database), showing all possible intersections for the most likely time interval of deposition. Tinos – shown are data points with Mn/Sr < 0.6, δ18O > −6 ‰ and δ13C between 0 ‰ and 3.0 ‰. Andros – shown are data points with δ18O < −6.07 ‰ and δ13C of 4.71–5.25 ‰.

Apparent depositional ages for marbles from Tinos, as indicated by the marine Sr-isotope curve of McArthur et al. (Reference McArthur, Howarth and Bailey2001, LOWESS table 4b database), showing all possible intersections for the most likely time interval of deposition. Shown are data points with Mn/Sr < 0.6, δ18O > −6 ‰ and δ13C between 0 ‰ and 3.0 ‰.

7.c.2. Andros
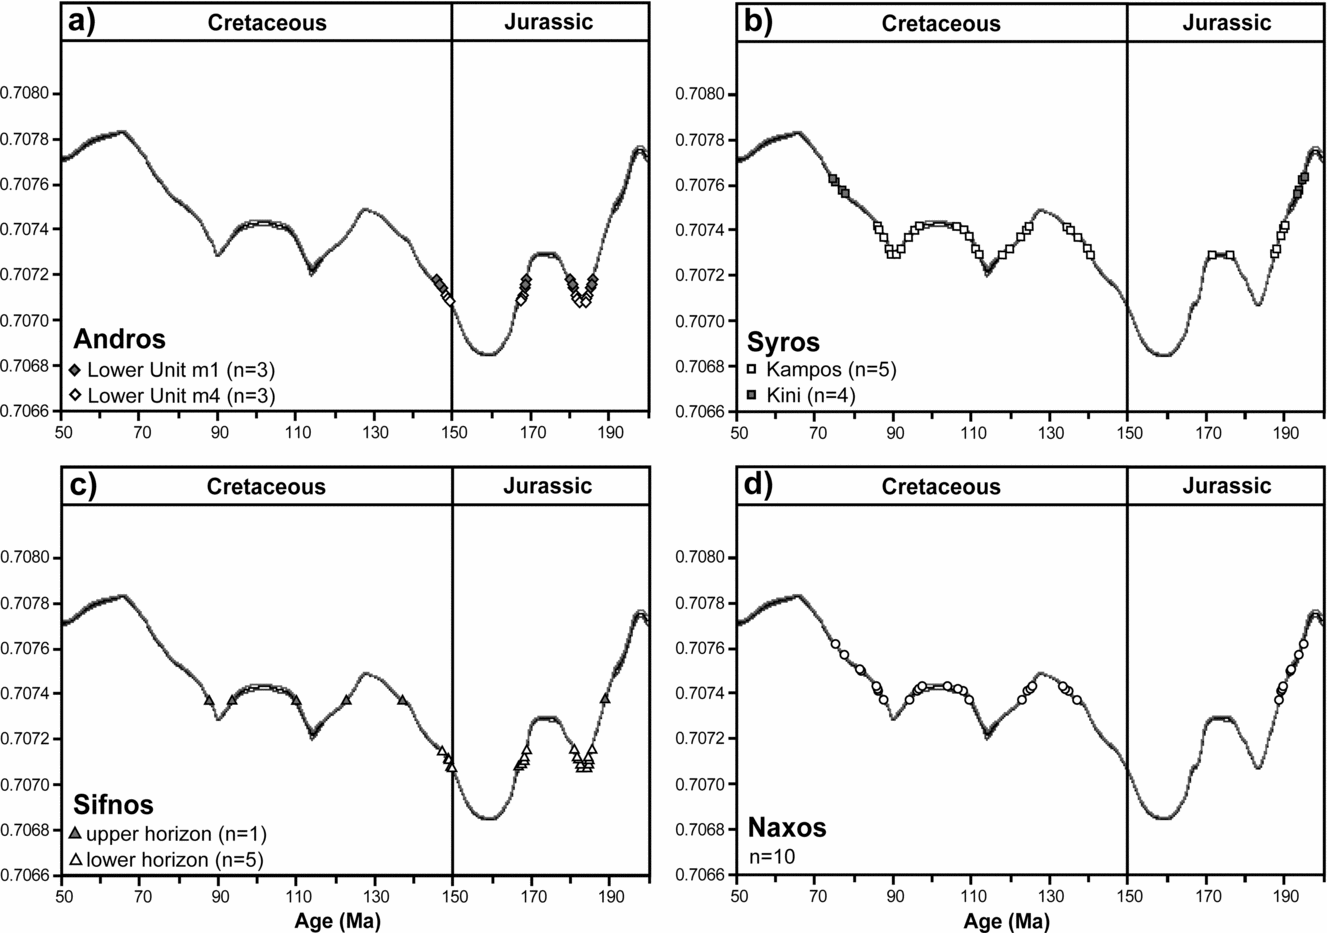
The fossil-bearing dolomitic marbles from Andros show a large variability in 87Sr/86Sr, suggesting disturbance of the original signal. However, two out of six Sr values would still conform to the biostratigraphically assigned Permian age (Papanikolaou, Reference Papanikolaou1978a, Reference Papanikolaoub; Fig. 7). The meta-acidic rocks from the Lower Unit, collected between m4 and m1, most likely represent boudinaged meta-volcanic intercalations that provide a Triassic reference point for sediment formation (~240–249 Ma; Bröcker & Pidgeon, Reference Bröcker and Pidgeon2007). However, caution is warranted in interpreting these U–Pb ages as robust time markers. A proximal meta-igneous source may yield a sediment that largely mimics the bulk compositional and age characteristics of the source rocks (e.g. S. Keay, unpub. Ph.D. thesis, Australian National Univ. Canberra, 1998). In this case, the zircon ages would only constrain the age of the source rocks, but not the depositional age. The m4 and m1 marbles from Andros yield a tight 87Sr/86Sr data cluster. When plotted onto the seawater curve (Fig. 9a), they indicate different Jurassic or Cretaceous ages (c. 180–185 Ma, c. 168 Ma, c. 145–150 Ma) that could only be reconciled with the U–Pb data if the host rocks of the Triassic zircon populations represent recycled material.
Apparent depositional ages for marbles from Andros, Syros, Sifnos and Naxos, as indicated by the marine Sr-isotope curve of McArthur et al. (Reference McArthur, Howarth and Bailey2001, LOWESS table 4b database), showing all possible intersections for the most likely time interval of deposition. Shown are data points with Mn/Sr < 0.6, δ18O > −6 ‰ and δ13C between −0.4 ‰ and 3.1 ‰.

7.c.3. Syros
We consider Triassic to Cretaceous U–Pb zircon ages for clastic metasediments (S. Keay, unpub. Ph.D. thesis, Australian National Univ. Canberra, 1998) as a more reliable indicator for the maximum time of sedimentation than a fossil-based Carboniferous age reported by Schumacher et al. (2009), which is possibly compromised by bad preservation or reworking. The studied marbles define two distinct groups which are both characterized by higher 87Sr/86Sr values than measured for the main Tinos–Andros–Sifnos subgroup (Fig. 9b). Sr-isotope characteristics of marbles from Kini are similar to those of the Panormos m1 marbles, indicating a Jurassic age (c. 190 Ma), but would also be consistent with a Cretaceous age of formation (c. 75 Ma). Sr-isotope values of marbles from Kampos agree with the seawater curve at an apparent age of c. 185–190 Ma and several times between c. 85–140 Ma (Fig. 9b). As on Tinos, the youngest age group recorded in clastic metasediments occurs at ~ 75–80 Ma, but was interpreted, like similar ages in metasediments from Ios and Naxos, as evidence for unspecified metamorphic processes (S. Keay, unpub. Ph.D. thesis, Australian National Univ. Canberra, 1998). The next youngest age groups indicate ages of ~ 108 Ma and 135 Ma.
7.c.4. Sifnos
A fossil occurrence (Négris, Reference Négris1914) and U–Pb zircon data (Bröcker & Pidgeon, Reference Bröcker and Pidgeon2007) indicate a sedimentation age < 230 Ma. The 87Sr/86Sr values of marbles exposed below the meta-tuffaceous Kamares sequence indicate various Jurassic or Cretaceous ages (Fig. 9c), which are in accordance with the independent age constraints.
7.c.5. Naxos
In dolomitic marbles, Dürr & Flügel (Reference Dürr and Flügel1979) recognized remnants of Upper Triassic algae and foraminifers. Detrital zircon populations of various types of metasediments suggest that the maximum depositional ages are younger than Late Triassic–Jurassic (S. Keay, unpub. Ph.D. thesis, Australian National Univ. Canberra, 1998). The Sr-isotope values of marbles from Naxos intersect the seawater curve at c. 185–195 Ma and multiple times between c. 140 and c. 75 Ma (Fig. 9d).
7.c.6. Summary
Only in rare and exceptional circumstances may Sr-isotope chemostratigraphy of metamorphic rocks yield geologically meaningful age information. The preservation of original isotopic signatures is possible, but even in such cases, only very broad time constraints can be deduced if well-defined chronometric fixed points are available. More subtle distinctions are not feasible. The complexities in assessing the degree of alteration as well as the fact that many of the independent age constraints are also not free of ambiguity make it yet impossible to use the Sr-isotope data of the Cycladic marbles for age determination.
8. Conclusions
This study clearly shows the limitations of Sr-, O- and C-isotope ratios in marble as a tool for unravelling the litho- and/or tectonostratigraphic relationships across the Attic–Cycladic crystalline belt that are thus far obscured by the fragmentary outcrop pattern. These isotope ratios, alone or in various combinations, are not diagnostic enough to unravel mutual relationships between individual marble occurrences. Both matching as well as different isotope data may reflect primary compositional characteristics or superimposed effects of various post-depositional alteration processes. In most cases, an unambiguous interpretation is impossible.
The time of sediment deposition of the Cycladic marbles could not be determined based on the Sr-isotope data. Even in the case that the initial marine Sr-isotope ratio is preserved, the Sr signal alone is not sufficient to identify the age of pre-metamorphic carbonate formation. Oscillations of the Sr-isotope seawater curve in the most likely time interval of biogenic precipitation (Triassic–Cretaceous time), and the scarcity of independent time markers prevent a rigid chemostratigraphic interpretation. The Sr-isotope data cannot unambiguously be linked to specific segments of the seawater curve.
The Sr-, O- and C-isotope values of the Aegean marbles will remain of interest for archaeological provenance studies, but are unsuitable to resolve lithostratigraphic relationships on and between different islands. U–Pb dating of zircon-bearing meta-volcanic rocks can assist solving litho- or tectonostratigraphic relationships, but suitable rocks of this kind are thinly distributed over the study area. More promising are the widespread siliciclastic metasediments and the age and provenance information that can be deduced from their detrital zircon populations. A detailed zircon database that documents contrasts and/or similarities in sedimentation history and provenance can provide the foundation for further correlations and subdivisions on individual islands and across the region.
Acknowledgements
This study was funded by the Deutsche Forschungsgemeinschaft (grant BR 1068/12–1). Thanks are due to H. Baier and A. Fugmann for laboratory assistance and support on the mass spectrometers. Thorough reviews by two anonymous reviewers helped considerably to improve the manuscript.