Introduction
The effect of high temperature on pig growth performance has been extensively studied and published in the literature (Holmes and Close, 1977; Close, Reference Close1981; Le Dividich et al., Reference Le Dividich, Noblet, Herpin, van Milgen and Quiniou1998). The effect of temperature on pig performance is affected by factors concerning climate (magnitude and the duration of thermal stress, humidity, air renewal, photoperiod), animal (sex, breed, BW, physiological stage) and management (diet, housing). Pigs respond to high ambient temperature by nutritional and physiological adaptation to maintain homoeothermy. Above the upper limit of the thermoneutral zone (approximately 25°C for growing pigs), an increase of temperature results in a decrease of the average daily feed intake (ADFI), which limits heat production. However, high temperature can also modify the partition of energy intake between protein and lipid deposition (Le Bellego et al., Reference Le Bellego, van Milgen and Noblet2002).
Most of the published studies on the effect of thermal stress on pig performance, animal-related measurements were done with a prior adaptation of 4 to 20 days to the experimental temperature. However, in practice during summer heat waves, especially in temperate climates, pigs are suddenly exposed to high temperatures with detrimental consequences on their health and their performance. Little published information was found about long-term acclimation responses of pigs to heat stress. In general, ADFI significantly decreases within the first 24 h of exposure to elevated temperatures and thereafter it remains constant or increases during the thermal acclimation period. Body temperature follows a different pattern, with an increase during the first 24 h followed by a decline during the successive period (Morrison and Mount, Reference Morrison and Mount1971; Giles, 1992; Renaudeau et al., Reference Renaudeau, Huc and Noblet2007). These results suggest a long-term acclimation to heat exposure, which is mainly related to a reduction in heat production. However, all the published results were obtained with only one level of temperature. The objective of the work was to investigate whether the long-term thermal acclimation responses to an increase in temperature are influenced by the level of temperature. In this study, four levels of temperature were chosen over a range of values from 24°C and 36°C. The 24°C temperature was considered as the thermoneutral temperature (Le Dividich et al., Reference Le Dividich, Noblet, Herpin, van Milgen and Quiniou1998); and 28°C, 32°C and 36°C were considered as hot temperatures.
Material and methods
Care and use of animal were performed according to the certificate of authorization to experiment on living animals, number A-971-18-01 (issued by the French ministry of Agriculture to CA, head of the experimental unit).
Experimental design and animal management
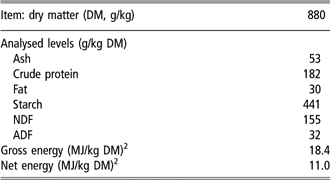
The effect of temperature level (24°C, 28°C, 32°C and 36°C) was tested on growth performance, digestive utilization of feed and physiological thermal responses on a total of 96 Large White barrows used in an experiment with eight successive replicates (two replicates/treatment), conducted at the experimental facilities of INRA in Guadeloupe, French West Indies. Within each replicate, 12 pigs originating from different litters were randomly selected at 11 weeks of age (37.9 ± 4.0 kg BW) and moved to a climatic-controlled room. Pigs were adapted to experimental conditions (housing, diet) for 10 days. During this adaptation period, the ambient temperature was set at 24°C. The experimental period was divided in two phases: pigs were kept at 24°C for 10 days (P0) and thereafter at a constant temperature of 24°C, 28°C, 32°C or 36°C for 20 days (Figure 1). In order to study the effect of duration of exposure to the experimental temperature, the 20-day period was divided in two sub-periods (P1 and P2, from day 0 to 10 and from day 11 to 20, respectively). Between P0 and P1, the temperature was changed on day 0 from 24°C to the experimental temperature at a constant rate of 2°C/h beginning at 0900 h. The relative humidity was kept constant at 80% over the total duration of the experimental period. Pigs were offered ad libitum a diet formulated with soya-bean meal, corn and wheat middlings (Table 1). Pigs were individually housed in an 800 m3 climatic room equipped with 12 metal slatted pens (1.50 × 0.85 m), allowing a separate collection of faeces and urine. Each pen was equipped with a feed dispenser and a nipple drinker designed to avoid water spillage. In the climatic room, ambient temperature and RH were controlled within ±0.2°C and ±3%, respectively. The photoperiod was fixed to 1230 h of artificial light (from 0600 to 1830 h) and the ventilation rate was set at 50 m3/h per pig. Air speed was not controlled but periodical spot measurements at the animal level indicated that it did not exceed 0.15 m/s.
Experimental design.

Diet chemical compositionFootnote 1
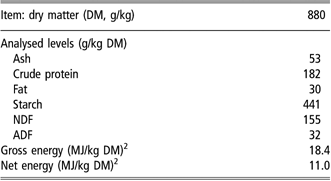
1 Formulated with corn (55%), wheat middlings (22%) and soybean meal (17%).
2 Calculated (MJ/kg) from equations of Noblet et al. (Reference Noblet, Fortune, Shi and Dubois1994 and Reference Noblet, Bontems and Tran2003) and for an average dry matter of 88.0%.
Measurements
All pigs were weighed before and after 24-h fasting period at the beginning and at the end of the experiment. Pigs were also weighed without prior fasting on the morning of day 0 before temperature increase and on day 10 of exposure to the experimental temperature. For each pig, the corresponding fasting BW was estimated from the fasting BW : full BW ratio calculated at the beginning and at the end of the experiment. Every morning, feed refusals were manually collected between 0700 and 0800 h, weighed and sampled for DM determination. A sample of feed offered to the animals was also taken weekly for DM determination, and samples were pooled at the end of each replicate for further chemical analysis. Faeces were collected over three successive 10-day periods on P0, from day 0 to 10 (P1), and day 11 to 20 (P2). Faeces were collected daily, pooled, weighed, mixed and sub-sampled. One faeces sample was heat dried (48 h at 103°C) for the determination of DM and the second one was freeze dried for further chemical analysis.
Rectal (RT) and cutaneous (CT) temperatures and respiration rate (RR) were measured three times daily (0700, 1200 and 1800 h) at day −10, −7, −5, −3, −1, 0, 1, 2, 4, 7, 9, 11, 14, 16, 18 and 20 of the experiment. For each recording period, the following protocol was applied: first, RR rate was visually determined by counting flank movements over a period of 1 min but only for resting animals. As pigs do not sweat, RR variation is considered as a good indicator of the latent heat loss (Kamada and Notsuki, Reference Kamada and Notsuki1987). After RR measurements in all pigs were completed, RT was measured using a digital thermometer (Microlife Corpororation, Paris, France). Then, CT was measured on the backs and bellies (flank) using a digital thermometer (HH-21 model, Omega, Stamford, CT, USA) with a K thermocouple probe. Variation in CT under heat stress conditions is an indicator of increased blood flow to the skin to promote sensible heat loss (Mount, Reference Mount1975).
Chemical analysis
The diet samples were analysed for dry matter (DM; AFNOR NF V18-109), ash (AFNOR NF V18-101), crude protein (CP, N × 6.25; AFNOR NF V18-120), ether extract (EE; AFNOR NF V18-117) and starch contents according to AOAC (1990). Faecal samples were analysed for DM, ash, N and EE, and samples of urine for nitrogen (N) using fresh material. Cell wall components (NDF, ADF and ADL) in diet were determined according to van Soest and Wine (Reference Van Soest and Wine1967).
Calculations and statistical analysis
Apparent digestibility coefficients of DM and nitrogen were calculated for each pig from the results of the digestibility trial.
The CT was calculated as the average of CT measurements on back and flank locations. As the cutaneous temperature is affected by both internal and ambient temperature, it was difficult to analyse the significance of a change in CT without taking into account these other values. According to Curtis (Reference Curtis1983), the three temperatures can be incorporated into a single index (i.e. the thermal-circulation index). This index is used as an indicator of blood and heat transfer to a particular area of skin under steady-state thermal conditions. It can be calculated from the core-to-skin and skin-to-environment temperature gradients with the following formula:

where CT is the average cutaneous temperature, RT is the rectal temperature, and Ta is the mean actual ambient temperature.
For each pig, the daily feed intake data (in g or g/kg BW0.60) were averaged over two periods (P0 and P1 + P2). According to our experimental design, the effect of temperature (24°C v. experimental temperature) was confounded with the increase of BW or age between the two periods of measurement. For this reason, performance, data were analysed for each period (P0 and P1 + P2). Growth performance and digestibility coefficients measured in P0 were analysed with a general linear general procedure of SAS (Proc GLM; SAS, Cary, NC, USA) including the effect of replicate (model 1). Corresponding data recorded in P1 + P2 were analysed with a GLM model including the effect of temperature and replicate nested within temperature effect (model 2). Body temperature and thermal-circulation index measured in P0 were analysed with a linear mixed procedure with the effect of replicate, hour and their interactions (model 3):

with

where Yijk is the value of the response (body temperatures or thermal-circulation index measured at hour k (k = 1, …, 3), on animal j (j = 1, …, 86), at temperature level i (i = 1, …, 4). μ is the average response and the variance–covariance structure for repeated measurements is autoregressive order 1 the variance σ 2e corresponding to the error of measurements.
From day 1 to 20 (i.e. P1 + 2), the latter data were submitted to a linear mixed model with the effect of temperature level, hour and replicate within temperature level, and their interactions as main effects (model 4):

with

where Yijkl is the value of the response (body temperatures or thermal-circulation index) measured at hour l (l = 1, …, 3), on animal j (j = 1, …, 86), at temperature level i (i = 1, …, 4), in the replicate k within the temperature level i (k = 1, …, 8). μ is the average response, and the variance–covariance structure for repeated measurements is autoregressive order 1 the variance σ 2e corresponding to the error of measurements.
The RR measurements followed a Poisson distribution and they were analysed with a log linear model using GLIMMIX macro (Littel et al., Reference Littel, Henry and Ammerman1998).
In order to quantify the effect of duration of exposure to high ambient temperature, i.e. from d0 to 10 (P1) v. d11 to 20 (P2) on performance, experimental data were analysed with a linear mixed procedure including the effect of temperature level from day 0 to 20 (24°C, 28°C, 32°C and 36°C), sub-period (P1, P2), replicate within temperature level and interactions as main effects (model 5):

with

where Yijkl is the value of the response measured at period l (l = 1, …, 3), on animal j (j = 1, …, 86), at temperature level i (i = 1, …, 4), in the replicate k within the temperature level i (k = 1, …, 8). μ is the average response and the variance–covariance structure for repeated measurements is autoregressive order 1 the variance σ 2e corresponding to the error of measurements.
For all analyses described above, the pig was considered as a random effect and the repeated measurement option of the mixed procedure of SAS was used with an autoregressive covariance structure to take into account the correlations between repeated measurements on the same animal. Means comparison was performed according to the Pdiff option of the SAS procedure using the Tukey test for contrasts.
When the Mixed procedure of SAS was used for the statistical analyses, the model of the covariance structure of error was chosen according to the REML estimation and the Akaike and Bayesian information criteria.
Results
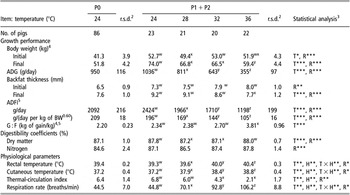
A total of 10 pigs were removed from the experiment because of leg problems (n = 3), rectal prolaspe (n = 4) or diarrhoea (n = 3), so data for only 86 pigs were used in the data analysis. Except for RR, the replicate effect was significant (P < 0.05) for all parameters measured during the first 10 days of experiment at 24°C (Table 2). The ADFI and average BW gain (ADG) were 2092 and 950 g/day, respectively. For the following 20 days of experiment, the average initial BW was found to be significantly lower at 28°C due to a reduced BW on one of the two replicates at this temperature level. During the 20 days of exposure to the experimental temperature, the ADFI was reduced by about 1226 g/day between 24°C and 36°C (2424 v. 1198 g/day; P < 0.001). A significant reduction in ADG in range of temperatures from 24°C to 36°C was found (355 v. 1036 g/day; P < 0.001). According to Table 2, the increase of ambient temperature from 24°C to 36°C resulted in a quadratic decrease of ADFI or ADG when the whole period of exposure to experimental temperature was considered (i.e. P1 + P2); the decrease of ADFI averaged 90 g/day per °C between 24°C and 32°C, and 128 g/day per °C between 32°C and 36°C. The corresponding values for ADG were 50 and 72 g/day per °C, respectively. Feed efficiency remained constant between 24°C and 32°C but significantly increased at 36°C (Table 2). The backfat thickness measured at the end of the experiment numerically decreased between 24°C and 36°C with a significant lower value at 36°C (7.7 v. 9.2 mm; P < 0.01). When the whole 20-day experimental period was considered, the apparent digestibility coefficient for DM was affected by temperature, whereas N digestibility remained constant whatever the temperature level (Table 2).
Effect of temperature on growth performance, on apparent digestible coefficient of nutrient and energy and on physiological parameters in growing pigsFootnote 1 (least square means)

r.s.d. = residual s.d.; ADG = average daily gain; ADFI = average daily feed intake; G:F=food conversion ratio for growth.
1 Within each replicate, pigs were maintained in a temperature controlled room at 24°C for 10 days (from day −10 to −1, P0) and thereafter at a constant temperature of 24°C, 28°C, 32°C or 36°C for 20 days (from day 0 to 20, P1 + P2).
2 A linear general model including the effect of replicate (R) as fixed effect was applied to the growth performance and digestible coefficients data. A linear general mixed model including the effect of hour of measurement (H) and R as fixed effects was applied to the body temperatures and thermal circulation index data. Respiration rate data followed a Poisson distribution. A log linear model was applied to these data with the fixed effects of H and R using GLIMMIX macro. The R effect was significant (P < 0.05) for all analysed parameters except for respiration rate parameter (P = 0.078).
3 A linear general model including the effect of ambient temperature (T) and replicate within temperature (R) as fixed effects was applied to the growth performance and digestible coefficients data. A linear general mixed model including the effect of T, H, R and their interactions as fixed effects was applied the body temperatures and thermal circulation index data. A log linear model with the effect of T, H and S was applied to the respiration rate data using GLIMMIX macro. w,x,y,zWithin a row, means with different superscripts are affected by temperature level (P < 0.05).
4 Body weight determined after a 24-h fast.
5 Calculated for an average dry matter of 88.0%.
During P0 when all pigs were kept at 24°C, RT, CT, thermal-circulation index and RR averaged 39.4°C, 37.2°C, 6.4 and 44.5 bpm, respectively (Table 2). From d1 to 20, RT, CT and RR significantly increased with the temperature increase (+1.1°C, +1.6°C and +61.4 breaths/min, respectively, between 24°C and 36°C). The thermal-circulation index was constant between 24°C and 28°C (6.4), to decrease between 28°C and 36°C. The thermoregulatory responses were affected by the time of measurement (0700, 1200 or 1800 h). On P0 at 24°C, RT and CT gradually increased between 0700 and 1800 h (+0.3 and +0.4°C; P < 0.05). The thermal-circulation index and RR were constant from 0700 to 1200 h (6.3 and 41 bpm, respectively) and increased from 1200 to 1800 h (+0.42 and 13 bpm; P < 0.05). From P1 + 2, the increase in ambient temperature resulted in a change in the diurnal pattern of thermoregulatory responses. Above 24°C, RT increased between 0700 and 1200 h but remained constant between 1200 and 1800 h, whatever the level of temperature considered. A similar result was observed for CT except that CT remained constant between 1200 and 1800 h only at 36°C. Below 36°C, RR increased significantly between 0700 and 1800 h. At 36°C, no diurnal variation was found in RR.
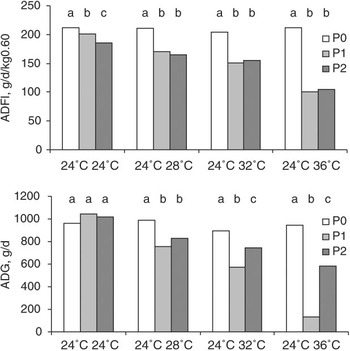
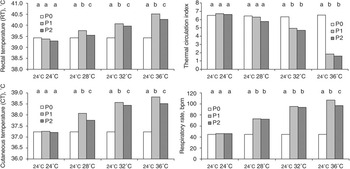
In order to study the effect of duration of exposure to various levels of ambient temperatures, the growth performance and physiological parameters recorded during the first 10-day sub-period of exposure (P1) were compared to those obtained during the last 10-day sub-period (P2) (Figures 2 and 3). Expressed as g/kg BW0.60, ADFI was not influenced by the duration of exposure and no interaction between temperature and sub-period was observed (Figure 2). Except at 24°C and 28°C, a significant effect of duration of exposure to the experimental temperature was found for ADG with higher ADG values during P2 than during P1 (P < 0.05). This increase of ADG depended on the level of temperature: the increase averaged 130 and 458 g/day at 32°C and 36°C, respectively. Between 28°C and 36°C, RT and CT were lower during P2 than during P1 (−0.20 and −0.23, respectively; P < 0.05) (Figure 3). This reduction was not temperature-level dependent (P > 0.10). The RR response was not affected by the duration of exposure between 24°C and 32°C. However, at 36°C, RR was significantly reduced in P2 compared with P1 (97 v. 107 bpm). Whatever the temperature level, the thermal-circulation index remained constant over the duration of exposure to experimental temperatures.
Effect of temperature level on average daily feed intake (ADFI, g/day kg BW−0.60) and average daily gain (ADG, g/day) in growing pigs over the acclimation period to high ambient temperature. Within each treatment, least square means with a different letter are affected (P < 0.05) by the duration of exposure.

Effect of temperature level on rectal temperature (RT), cutaneous temperature (CT), and thermal circulation index, and respiration rate over the acclimation period to high ambient temperature. Within each treatment, least square means with a different letter are affected by duration of exposure to heat (P < 0.01).

Discussion
Effect of high ambient temperature on pig performance
The negative effect of high ambient temperature on voluntary feed intake has been extensively described in the literature. In a review by Le Dividich et al. (Reference Le Dividich, Noblet, Herpin, van Milgen and Quiniou1998), the reduction of ADFI ranged from a minimum of 40 to a maximum of 80 g/day per °C between 20°C and 30°C. According to these authors, this large variability can be explained by many factors including breed, BW, degree of fatness, diet composition and temperature range. The reduced ADFI under hot conditions in pigs leads to reduced thermogenesis and heat stress (Collin et al., Reference Collin, van Milgen, Dubois and Noblet2001a). Most of the published results on the effect of elevated temperature on pigs performance were obtained in pigs previously acclimated to the experimental temperature for 3 to 10 days with a relative humidity ranging between 40% and 60%. In our study, each degree increase in ambient temperature between 24°C and 36°C was associated with a reduction of ADFI to about 100 g/day from day 0 to 20. According to the objectives of the experiment and unlike others studies, our pigs were submitted to heat stress without a previous acclimation period, which could mainly explain the greater effect of temperature in ADFI. Moreover, according to Renaudeau (Reference Renaudeau2005), a high relative humidity limits the animal’s ability to dissipate heat by evaporation and accentuates the effect of heat stress. It can then be suggested that the high relative humidity used in the present experiment emphasised the negative effect of high ambient temperature on pig feed consumption. In addition, as shown by Nienaber et al. (Reference Nienaber, Hahn and Yen1987) and Quiniou et al. (Reference Quiniou, Dubois and Noblet2000) in growing pigs, the effect of ambient temperature on feed intake is quadratic, suggesting that the extent to which temperature affects feed intake depends on the temperature level.
Below 36°C, increase of N digestibility from the first and the last 10-day exposure was not temperature dependent. This change observed in digestibility could be attributed to an increase of pigs live BW. In contrast, we reported a significant increase of DM digestibility during the last 10-day exposure to 36°C. These results suggest that elevated temperatures affect nutrients digestibility when the range of temperature between thermoneutral and hot treatment is greater than 8°C. Similarly, Collin et al. (Reference Collin, van Milgen, Dubois and Noblet2001b) observed an increase of DM, N and energy digestibility coefficients between 23°C and 33°C in temperature-acclimated young pigs. In this study, the effect of temperature on nutrient digestibility was not significant when pigs at 23°C and 33°C received the same amount of feed, suggesting that the increase of DM and N digestibility was mainly related to the reduced feeding level in hot conditions.
The reduction of ADFI under hot conditions results in lower nutrients intake and consequently reduced ADG. In the present experiment, the reduction of ADG from day 0 to 20 averaged 55 g/°C between 24°C and 36°C. This value was higher than those reported by Nienaber et al. (Reference Nienaber, Hahn and Yen1987) between 25°C and 30°C (i.e. −36 g/day per °C) and Massabie et al. (Reference Massabie, Granier and Dividich1996) between 24°C and 28°C (i.e. −24 g/day per °C). As shown for feed intake, the lack of adaptation period to the experimental temperature can explain the greater effect of elevated temperature on BW gain observed in our study. Expressed as a percentage of BW gain measured on P0, the reduction in BW gain at 28°C and at 32°C (−20% and −27%, respectively) was close to the reduction in feed intake (−18% and −27%, respectively). These results suggest that the reduced growth rate at 28°C or 32°C is directly related to the effect of temperature on feed intake. In contrast, the reduction in BW gain at 36°C was greater than the reduction of feed intake (−62% v. −50%, respectively). This result was consistent with the increase of feed conversion ratio at 36°C, suggesting that pigs were less efficient to use feed for growth. In fact, according to the high energy restriction at 36°C, it can be suggested that a greater part of ME intake would be used for maintenance. In other words, the lower efficiency of energy utilization for growth at 36°C could be explained by an increase of relative importance of maintenance requirements.
Effect of temperature level on long-term acclimation responses
On P0, the 24°C treatment was thought to be in the thermoneutral zone as defined by Holmes and Close (1977). During this period, RT and RR averaged 39.4°C and 44.5 bpm, respectively, in agreement with the results of Renaudeau et al. (Reference Renaudeau, Huc and Noblet2007) (39.3°C and 43.0 bpm, respectively) and Brown-Brandl et al. (Reference Brown-Brandl, Eigenberg, Nienaber and Kachman2001) (39.4°C and 44.7 bpm, respectively). Brown-Brandl et al. (Reference Brown-Brandl, Eigenberg, Nienaber and Kachman2001) observed that RT and total heat production were similar at 18°C and 24°C. These results confirm that at 24°C, 50 kg-BW pigs are in their thermoneutral zone.
Within the first 10 days of exposure to the experimental temperature (P1), the thermal-circulation index was constant between 24°C and 28°C and decreased linearly between 28°C and 36°C. This temperature-induced change in the thermal-circulation index suggests that the ability of pigs to lose heat by sensible pathways (conduction and circulatory convection) was reduced at higher temperatures. This result is in agreement with Holmes and Close (1977). In others words, evaporative heat loss would account for practically all the total heat loss at an ambient temperature above 28°C. At this temperature level and according to its low density of active sweat glands (Renaudeau et al., Reference Renaudeau, Leclercq-Smekens and Herin2006) and that heat loss from panting is closely related to RR frequency (Kamada and Notsuki, Reference Kamada and Notsuki1987), pigs rely mostly on respiration evaporation to lose heat by the latent pathway. The effect of temperature on RR was not linear; it increased by 6.3 bpm/°C between 24°C and 28°C and by 3.4 bpm/°C between 28°C and 32°C. These results indicate a possible saturation of evaporative loss pathways above 32°C. This hypothesis is based on the assumption that a constant volume of air is inspired per breath whatever the temperature level. According to Curtis (Reference Curtis1983), the RR response to elevated temperature is biphasic in sheep and cattle with a rapid increase in breathing frequency (thermal polypnea) followed by a drop. This drop is associated with an increase in RR in order to maintain the heat loss rate. It can be suggested that the same mechanism is involved in pigs but this hypothesis remains speculative. According to our results, RT linearly increased from 0.09°C/°C between 24°C and 36°C, indicating that mechanisms implied in reduction in heat production and (or) increase in heat loss are not sufficient to prevent a rise in body temperature. However, the rise in RT can be also considered as a part of the mechanism of the pig to maintain a temperature gradient between core and skin temperature.
According to Morrison and Mount (Reference Morrison and Mount1971) and Renaudeau et al. (Reference Renaudeau, Huc and Noblet2007), the decline in RT over time of exposure to high ambient temperature supports the hypothesis of a long-term acclimation to heat stress. Moreover, the reduction of RT between P2 and P1 was not temperature dependent, suggesting that the slope of thermoregulatory response did not depend on the magnitude of heat stress. In the present study, we reported that RR declines over the thermal acclimation period and that decline was accentuated at 36°C. As suggested by Bianca (Reference Bianca1959) in calves, the reduction of RR would be related to a decrease of evaporative heat loss. However, it could be also assumed that evaporative heat loss per breath becomes more efficient over time of exposure to heat, resulting in a decline of RR. According to Giles (1992), this fall in RR may be related to a reduction of O2 consumption in relation to a decrease in metabolic heat production.
In the present experiment, whereas the ADFI remained constant over the 20-day period of exposure to heat, the ADG significantly increased in P2 compared with P1 only at 32°C and 36°C. In addition, this increase in ADG was temperature dependent. These results suggest that the apparent efficiency of food utilization for growth would increase with time when temperature was above 28°C. Brown-Brandl et al. (2000) and Collin et al. (Reference Collin, van Milgen, Dubois and Noblet2001a) showed a reduction of fasting heat production (FHP) under hot conditions in temperature-acclimated pigs. According to Koong et al. (Reference Koong, Nienaber, Pekas and Yen1982) and van Milgen et al. (Reference van Milgen, Bernier, Le Cozler, Dubois and Noblet1998), this reduced FHP is generally explained by an indirect effect of reduced feed intake on viscera mass. At the end of our work, pigs were slaughtered and we measured a reduction of the relative weight of viscera when the temperature increased above 24°C (Renaudeau et al., unpublished results). Then, the increase of feed efficiency in P2 at 32°C and 36°C could be related to a reduction of FHP and maintenance requirement, implying an increase in the proportion of energy used for growth purposes. This hypothesis implies that mechanisms involved in the reduction of energy requirement for maintenance under heat stress need time to be effective, i.e. more than 10 days.
In conclusion, the present experiment confirms that the negative effect of high ambient temperature on pig performance depends on the magnitude and duration of heat stress. Based on the measurement of BW gain and RT, our results suggest an improved tolerance to heat with duration of exposure. It is suggested that decrease in heat production might play a part in the observed acclimation. Further studies are needed to understand the mechanisms underlying this heat acclimation response. In particular, the changes of the components of heat production in pigs during long-term acclimation to high ambient temperature are not investigated yet and warrant future research. The present study was performed using individually housed pigs but it is well known that single or group-housed animals react quantitatively differently to heat stress. For a practical point of view, complementary studies are therefore necessary in order to quantify the long-term acclimation responses in group-housed pigs.
Acknowledgements
The authors gratefully acknowledge K. Benony, E. Huc, B. Bocage, M. Bructer, E. M. Giorgi, A. Racon, F. Silou and J. L. Weisbecker for their technical assistance, T. Etienne, S. Calif and G. Saminadin for the laboratory analyses and J. Noblet for critical evaluation of the manuscript.