


1. Introduction
Two major complications must be addressed in extending the results of laboratory ice-deformation experiments to the quantitative description of ice flow in ice sheets. The first is the development of anisotropic crystal fabrics with increasing strain, in response to applied stresses. The second is that the nature of flow in the regions near the base of ice sheets is rather uncertain, even though it is in this part of the ice column that ice-sheet models typically develop much of the horizontal deformation velocity. In basal layers, where ice is usually at its warmest and deformation rates can be large, any deviations from the usual presumption of increasing shear stress with depth produce large changes in estimates of shear strain rate and consequently of horizontal velocity.
Laboratory ice-deformation experiments, measurement of borehole-inclination profiles in large ice sheets, and studies of the mechanical properties of ice from those boreholes, all indicate that tertiary deformation rates for shear can be up to an order of magnitude greater than the minimum creep rates for ice with randomly oriented crystals. This occurs once an anisotropic ice-crystal fabric compatible with the dominant applied stress configuration has developed (e.g. Reference Russell-Head and BuddRussell-Head and Budd, 1979; Reference Jacka and BuddJacka and Budd, 1989; Reference Li, Jacka and BuddLi and others, 1996).
We present an ice-flowline model in which the shear flow of ice is enhanced as the ice passes through a range of stress regimes from predominantly vertical compression to predominantly horizontal shear stress, as it flows down through the ice sheet. The enhanced flow, characterised by an increase in strain rates compared to the secondary creep rate for isotropic ice, is based on laboratory measurements of tertiary creep under combined compression and shear stresses (Reference Li, Jacka and BuddLi and others, 1996).
The model is applied to the Law Dome ice cap, East Antarctica, along a transect from the summit to Cape Folger, which has been the location of extensive fieldwork, since data for model inputs and for model verification are available. In particular, the results from the model can be compared with observations from boreholes previously drilled along this line. The calculated strain rates using the rheology based on the laboratory experiments agree well with strain rates determined from borehole-inclination measurements, at least in the upper part of the ice sheet.
We find that using rheology directly based on laboratory measurements forces us to address the second complication, the nature of flow near the bedrock. We used the concept of an envelope topography, smoothing over the higher-frequency bedrock roughness. This is based on observations, from boreholes and radar-echo sounding, showing relatively smooth high shear layers over rough bedrock features. Various explanations have been proposed for the discontinuities in dielectric permittivity that produce the strong internal echoes observed in radio-echo soundings of ice sheets. These mechanisms include synchronous origins, such as deposits of impurities or density variations caused by surface processes, and dynamical causes such as crystal-orientation fabrics or crystal sizes (see, e.g., Reference Fujita and MaeFujita and Mae, 1994). In shallower ice sheets the elongation of air bubbles in high-shear zones also appears to cause internal reflections. During 1967, subsurface echoes were observed in Law Dome, along the line treated in the present paper, at between 250 and approximately 400 m depth (Reference CarterCarter, 1976). Correlations between these reflections and the shear strain-rate profiles from boreholes near the margin of the ice cap, together with related ice-dynamics modelling by Reference Budd and Rowden-RichBudd and Rowden-Rich (1985) (the latter is summarised in Reference Budd and JackaBudd and Jacka, 1989), suggest an identification with crystallographic causes, associated with a high-shear zone. Comparison of oxygen-isotope profiles from the corresponding ice cores (Reference Morgan and McCrayMorgan and McCray, 1985) with the reflections observed by Carter indicates that in Law Dome internal reflections do not necessarily mark isochrones.
Strong reflections deep in ice sheets, above a reflection-free zone near the bedrock, are commonly seen in radar-echo sounding, and are frequently suggestive of a smooth envelope over the bedrock. Reference FujitaFujita and others (1999) comment on the sharp transition from strong echoes which they identify with (shear) crystal-orientation fabrics, overlying an echo-free basal region in studies carried out along the traverse line from Syowa station to Dome Fuji in East Antarctica.
The appropriate spatial scales for smoothing the bedrock deserve further examination. Even using the envelope bedrock, we obtain surface ice velocities which are on average 20 times larger than observed, indicating that probably enhancement of shear flow and shear stress both decrease in lower layers, giving rise to a maximum shear layer at some height above the bed. This agrees with some borehole-inclination measurements from Law Dome (Reference Russell-Head and BuddRussell-Head and Budd, 1979), but is contrary to most simple ice-sheet model predictions. In this paper, as discussed below, we highlight this difficulty by simply halting our vertical integrations of shear strain rate at such a depth that our flow model reproduces the observed horizontal surface velocity. Below this "rheological depth" we artificially set the shear strain rate to zero. While this is obviously an unphysical procedure, it is interesting to observe the consistency with which this depth and the corresponding exaggerated maximum shear layer follow the envelope bedrock. We have also experimented with other prescriptions for a more gradual reduction in strain rates in lower regions of the ice sheet. If an empirical prescription of sufficient generality could be devised then it could be used to calculate ice velocities throughout the Antarctic ice sheet. More extensive work, involving a wider range of ice thicknesses and temperature regimes than encountered in the present study, would be required to attempt such a prescription.
2. Model Input Data from Observations on Law Dome
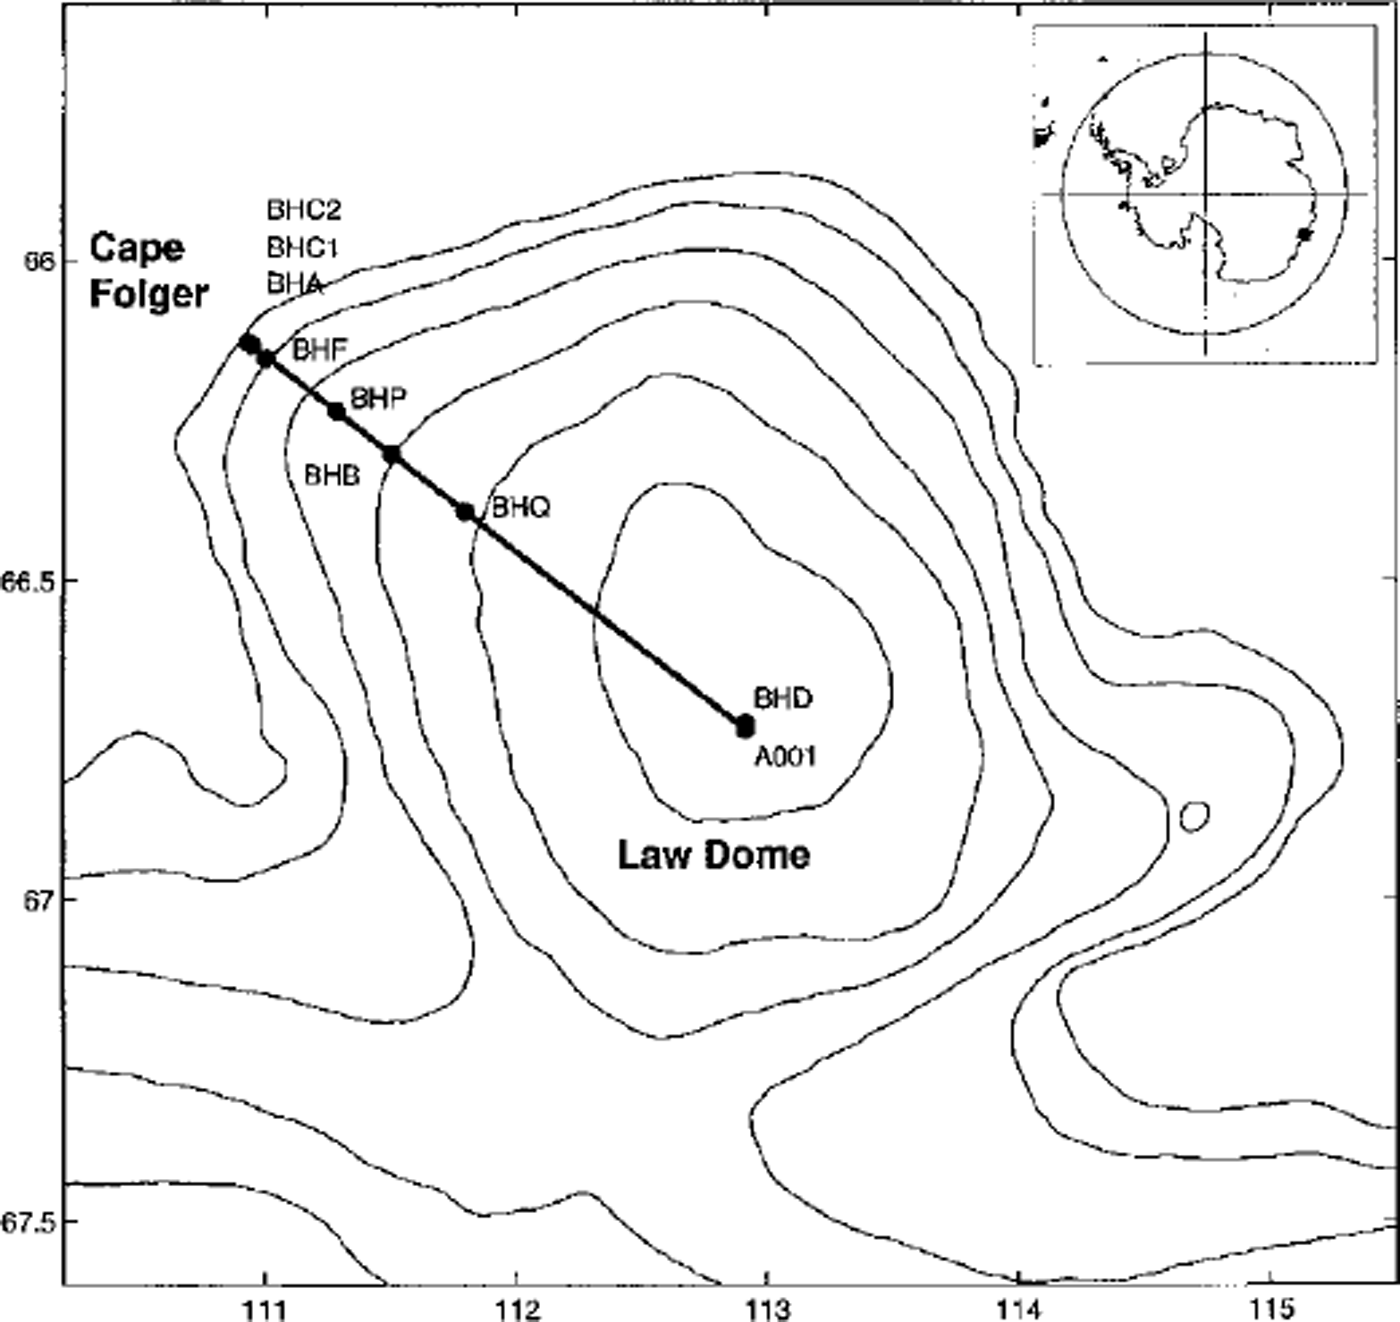
The Law Dome ice cap, about 200 km in diameter with a surface elevation of 1389 m at the summit, adjoins the main Antarctic ice sheet in Wilkes Land at 110-116° E. Since the 1950s, much glaciological work has been carried out to determine the physical characteristics of Law Dome. This work has involved field surveys and ice-core drilling. Figure 1 shows the survey line from the summit of Law Dome to Cape Folger on the coast, and ice-core drilling sites along this line. Surveys undertaken during surface traverses have provided information on the surface physical characteristics of the ice cap including its elevation, ice thickness, mass budget and surface flow velocity (Reference CarterCarter, 1976; Reference PfitznerPfitzner, 1980). The results from measurements of borehole inclinations (Reference Russell-HeadRussell-Head, 1979; Reference Russell-Head and BuddRussell-Head and Budd, 1979; Reference EtheridgeEtheridge, 1989) and analyses of ice cores (Reference Russell-HeadRussell-Head, 1979; Reference Russell-Head and BuddRussell-Head and Budd, 1979; Reference Thwaites, Wilson and McCrayThwaites and others, 1984; Reference XieXie, 1985; Reference Li, Zichu and MaohuanLi and others, 1988; Reference GaoGao, 1989; Reference Jacka and BuddJacka and Budd, 1989; Reference Jacka, Gao and KunJacka and Gao, 1989) have provided a great deal of background information about the internal properties of the ice and its dynamics. All this information makes Law Dome an ideal area for modelling studies.
Map of Law Dome showing the traverse line from the summit to Cape Folger, and the locations of previously drilled ice boreholes. Surface elevation contours (200 m interval) are also shown.
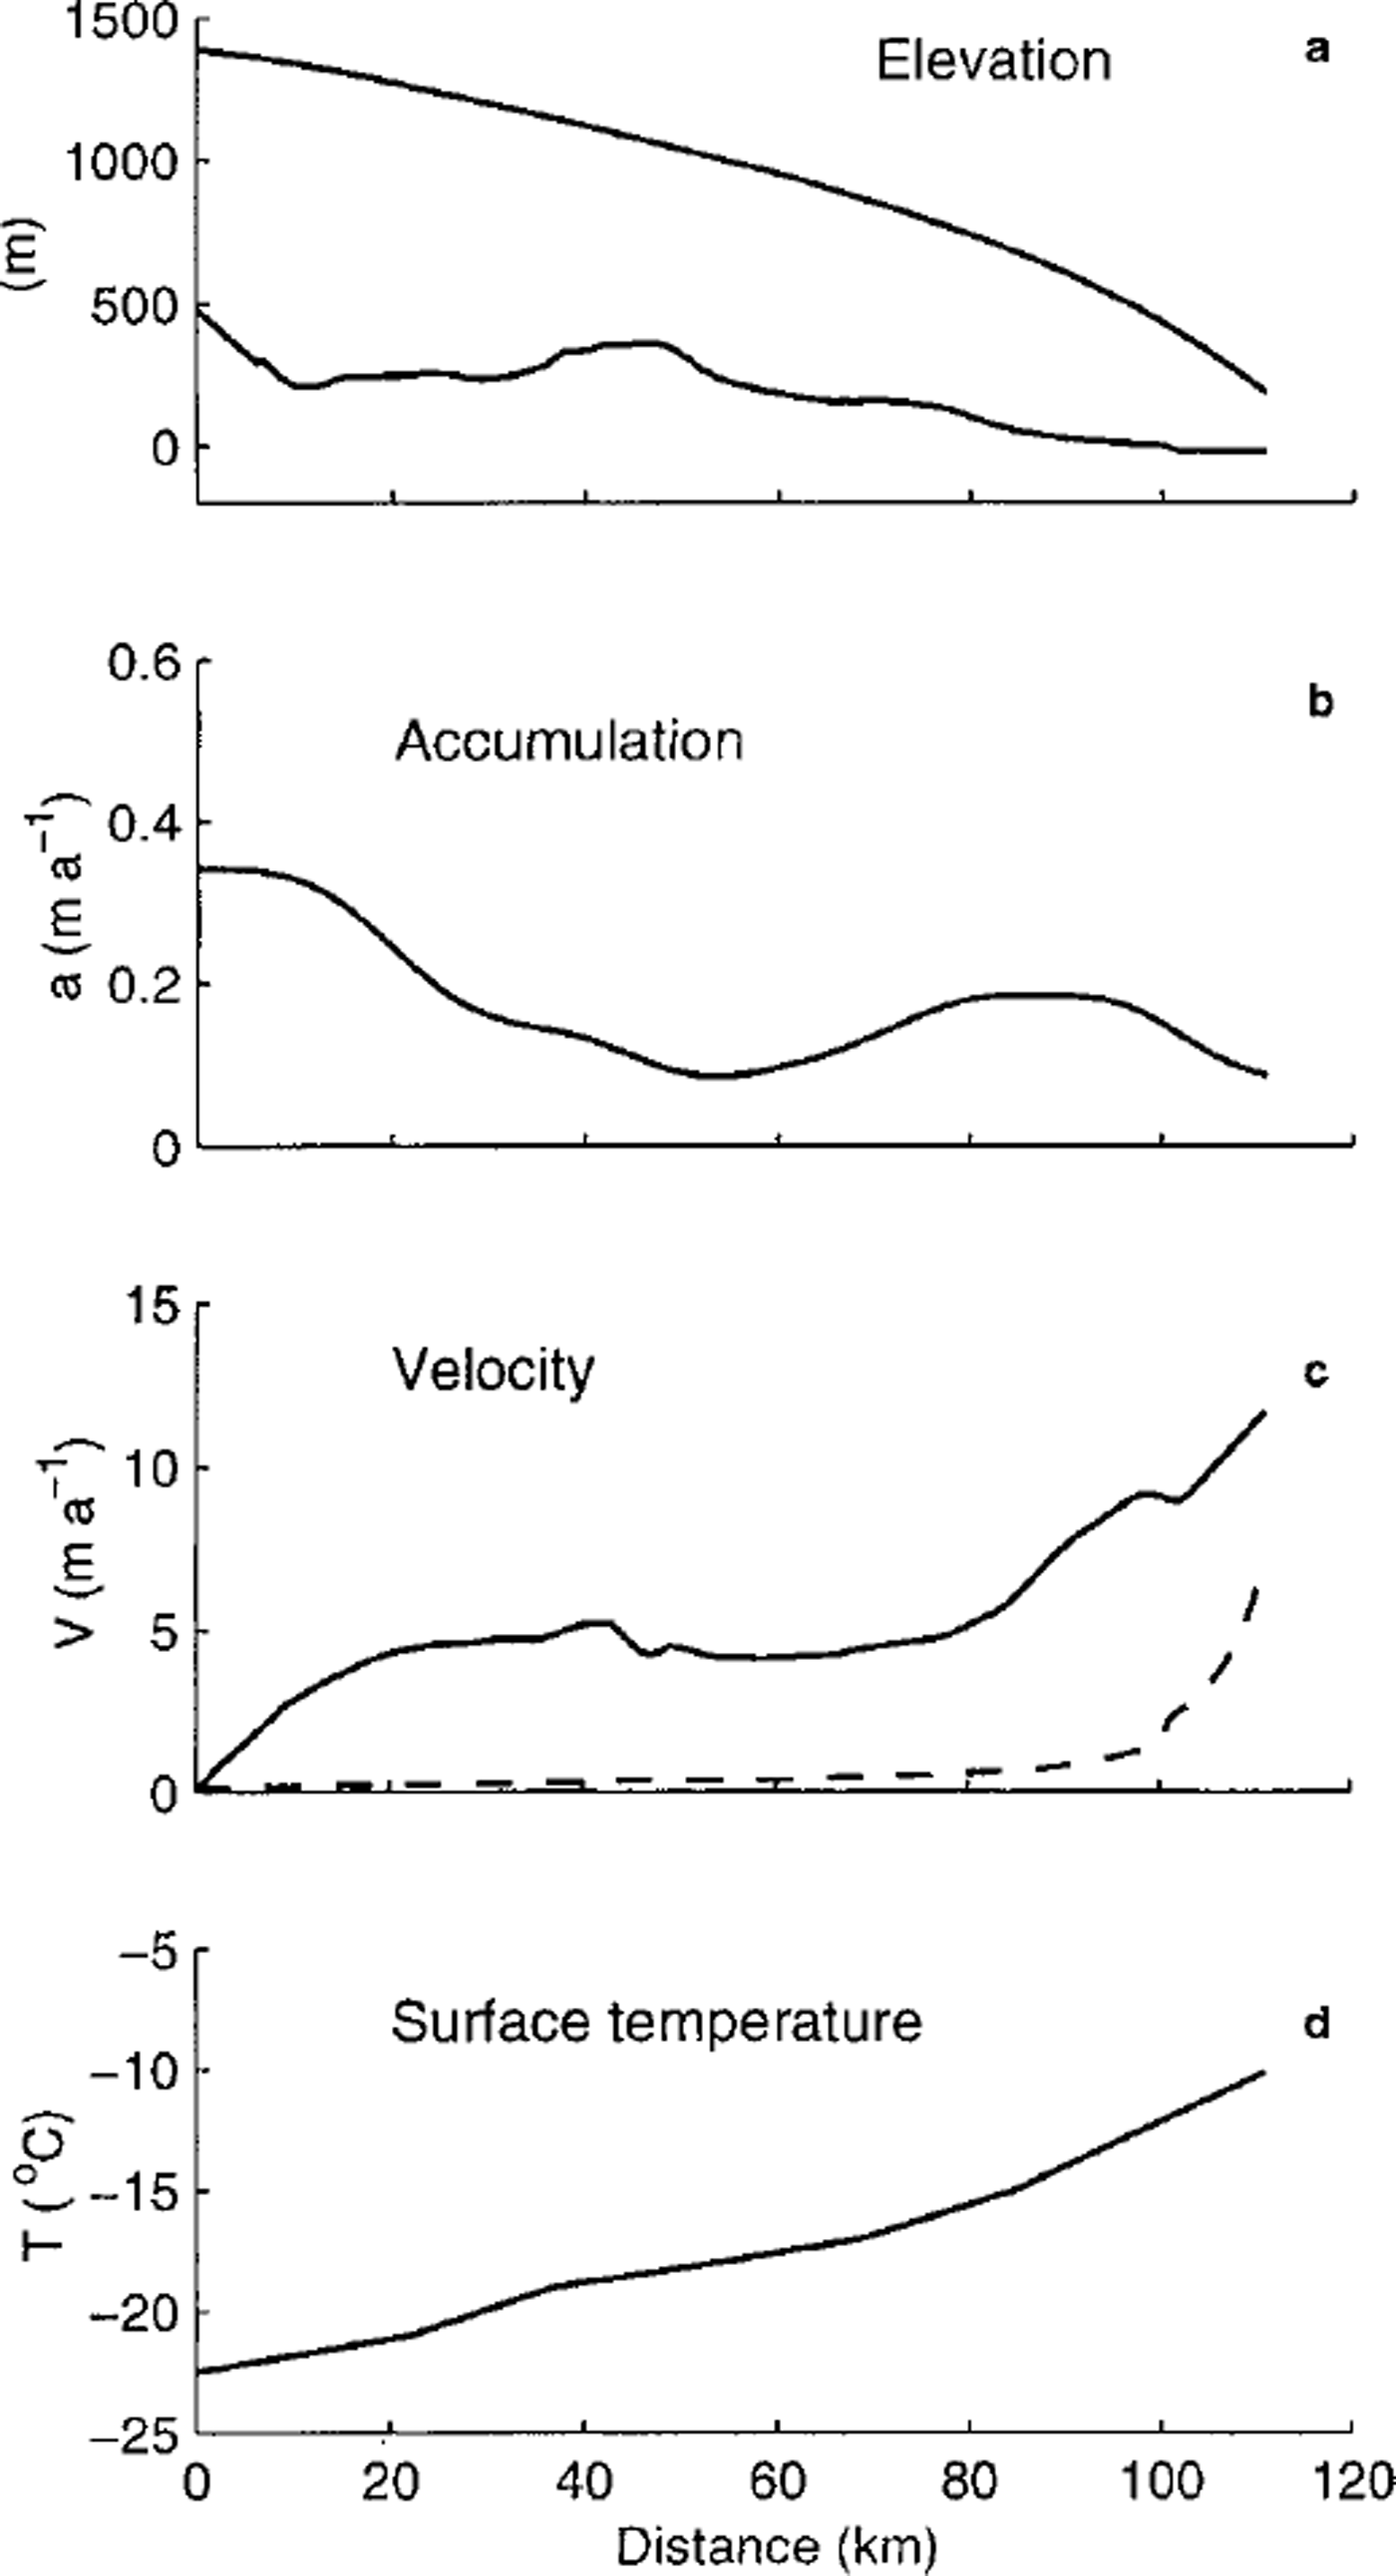
In this paper, an ice-flowline model is applied to the traverse line from the summit of Law Dome to Cape Folger (approximately an ice flowline). The input data-surface and bedrock elevations, surface accumulation rate, surface horizontal velocity and surface temperature - used in the modelling study are shown in Figure 2. They are taken from the observations tabulated by Reference CarterCarter (1976). Surface velocity measurements and borehole-inclination measurements near the margin of the ice cap at BHC1 and BHC2 (Reference EtheridgeEtheridge,1989) reveal that approximately half the ice motion there is due to basal sliding. These measurements have been extrapolated to estimate the generally small sliding contribution to surface velocities along the flowline using a simple model for basal sliding velocity (Reference Budd, Jenssen and SmithBudd and others, 1984),
 , where τb is basal shear stress, z* is ice thickness above buoyancy and kh
is taken as 0.32 × 10⁶m3 bar−1 a−1. This contribution is shown by the dashed curve in Figure 2c.
Input data for the model: (a) surface and bedrock elevation, (b) surface accumulation rate, (c) surface horizontal velocity (solid line) and basal sliding velocity (dashed line), and ( d) surface temperature.
3. Model Description
In a previous model (Reference Wang and WarnerWang and Warner, 1998) we introduced a simple dependence of enhancement of the shear flow on ice-flow history, through the ratio of shear strain to compression strain, and enhanced the shear flow (compared to minimum creep rates) only after the shear strain dominated. Recent experiments have shown that when shear stress is applied to ice which has a fabric compatible with compression, the secondary shear flow is already −2.5 times faster than minimum strain rates for isotropic ice (Reference Li and JackaLi and Jacka, 1998). Here we present a model that is more directly linked to laboratory experiments by Reference Li, Jacka and BuddLi and others (1996), involving combined shear and compression stresses. In this steady-state dynamic and thermodynamic flowline model, the basic assumption of our treatment is that ice is always in tertiary flow, with the ice-crystal fabric always compatible with the current stress configuration. This assumption ignores any delay in the crystal fabric’s responding to (becoming compatible with) the applied stresses, and therefore represents the most rapid response possible of flow to stress conditions. The combination of stresses varies from compression-dominated in the upper part of the ice sheet to shear-dominated in the deeper parts. Since this model involves the relative magnitudes of shear and compression stresses, we have also included the influence of compressive stress on shear strain rates by retaining the octahedral stress,
 in the shear component of our flow relations. This has a direct influence on the shear strain rates in the upper regions of the ice sheet.
For isotropic ice flow, the constitutive relations between the stresses and strain rates represented by Glen’s flow law (Reference GlenGlen, 1955) are

where
 and
 are the strain-rate and deviatonc-stress tensor components, respectively, τ0 is the octahedral shear stress (proportional to the effective shear stress), A(T) is a temperature-dependent coefficient, and the flow-law exponent (n) is usually taken as 3.
Both field and laboratory studies of ice deformation have shown evidence of anisotropic ice fabrics in the deeper ice sheet and their effect on ice-flow properties (e.g. Reference Russell-Head and BuddRussell-Head and Budd, 1979; Reference Shoji and LangwayShoji and Langway, 1988). Some efforts have been made to create flow laws based on the anisotropic crystal fabrics (e.g. Reference LileLile, 1978; Reference BakerBaker, 1982; Reference Dahl-JensenDahl-Jensen, 1985; Reference Shoji and LangwayShoji and Langway, 1988; Reference Azuma and Goto-AzumaAzuma and Goto-Azuma, 1996). These models typically require independent fabric observations, or modelling of the evolution of the crystal fabric. Our approach, as in our previous paper (Reference Wang and WarnerWang and Warner, 1998), is to use laboratory results to go directly to the appropriate tertiary strain rates. This essentially includes the co-evolution of the tertiary crystal fabrics.
In our present model the flow law is based directly on the laboratory experiments by Reference Li, Jacka and BuddLi and others (1996). Those experiments, involving combined shear and confined-compression stresses, showed an anisotropic rheology which they summarised by a flow relation, expressed in terms of octahedral values of stress and strain rate, for the strain rate in tertiary creep
 :

where E(λC)
is an enhancement factor and A0(T) is the temperature-dependent flow coefficient that describes the octahedral minimum creep rate. Reference Li, Jacka and BuddLi and others (1996) described the way the enhancement factor for
in tertiary flow varies between Es
and Ec, the respective enhancement factors for shear or compression alone (they take Es = 10 and Ec = 3), by

in terms of the compression fraction λc, which is defined by

The compression fraction varies from 1 to 0 as the stress situation varies from purely confined compression (shear stress τxz = 0) to simple shear (compressive deviatoric stress τ′z = 0).
Once the isotropic situation of Equation (1) no longer applies, a single relation between the octahedral stresses and strain rates no longer suffices to describe the flow law. As a suitable generalisation for a flowline model, we consider the flow relations for components of shear and compression as


where the x coordinate is in the direction of flow, the y coordinate is transverse to the flow and the z coordinate represents the vertical direction. The shear stress τxz is taken as the driving stress, τxz = ρgaz, in terms of the ice density A the acceleration due to gravity g, the depth z and the surface slope a.
The octahedral shear stress is taken as
 on the assumption made in Equations (5-8) that the ice flow corresponds to a confined-compression stress as well as a shear stress. The temperature-dependent coefficient A0(T) is based on laboratory experiments (corresponding to the octahedral shear stress of 0.1 MPa) summarised by Reference Budd and JackaBudd and Jacka (1989).
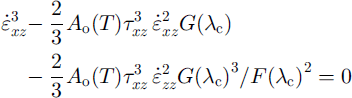
Using Equations (5) and (6) to obtain an expression for τ0 which is substituted back into Equation (5) yields a cubic equation for the shear strain rate
 .
in terms of the compression fraction (λc), the shear stress and the vertical strain rate
 . This equation can be solved iteratively for the shear strain rate, which is then integrated to provide the horizontal velocity. The vertical strain rates can be calculated from the horizontal velocities assuming incompressibility.
Equations (5) and (6) show that G(λC) approaches E(λC) as Ac tends to zero, while F(λC) approaches E(λC) as Ac tends to one. When the shear strain rate is much larger than the compression strain rate, Equation (9) simplifies to the usual relation

The results of laboratory combined-stress experiments (personal communication from Li Jun and T. H. Jacka, 1998) for individual components of the stress and strain-rate tensors show that the ratio G(λC)/F(λC) is of order unity There appears to be a gradual trend for the ratio G(λC)/F(λC) to fall slowly as shear dominance increases, but this is not critical in determining the shear strain rate. Accordingly, for the present study we simplified Equation (9) by taking G(λC) = F(λC) = E(λC) to obtain

which simplifies the calculation of Ac which can now be evaluated directly using strain rates
 , and allows us to use the parameterisation of Reference Li, Jacka and BuddLi and others (1996) for E(λC) given in Equation (3).
The strain rates were determined by treating Equation (11) for the shear strain rates, the heat equation, the compression fraction (λc), the enhancement factor E(λC), etc., by an iterative process. The temperature distribution in the ice sheet and the enhancement factor distribution were treated alternately. For fixed enhancement factors, the heat equation was solved for the steady-state temperature distribution, taking surface temperatures from observations (Fig.2d) and including internal deformation heating, a geother mal heat flux corresponding to a basal temperature gradient of 0.025 Km−1, horizontal and vertical advection and vertical diffusion. This temperature distribution was then used to calculate new shear strain rates using Equation (11) and thus update the velocities. New temperatures were calculated, and this process was repeated until the temperature distribution converged. For a fixed temperature distribution, the enhancement factors were determined by Equation (3) using the compression fractions calculated from the strain rates. This enhancement-factor distribution was then put into Equation (11) to obtain new shear strain rates. The horizontal velocities were then updated and new vertical strain rates determined, allowing an updating of the enhancement factor. The vertical strain rates and velocities can be calculated from the longitudinal strain rates, but for this study an approximation was used which relates them to the surface accumulation rate, ice-sheet geometry and the shape of the depth profile of horizontal velocity at each location. Our model resolution is 1km in the horizontal and uses rescaled vertical coordinates, dividing the ice thickness into 100 evenly spaced bands.
Using these laboratory-based flow relations, the integration of the shear strain rates right down to the bedrock on Law Dome gives surface velocities much higher than the observed values shown in Figure 2c. This problem arises even though the shear strain rates agree well with the borehole-inclination rates in the upper part of the ice sheet, and even though we had replaced the bedrock data with a smoothed envelope topography, in anticipation of complications with the flow near the base of the ice sheet. The bedrock data were smoothed using a running mean over 15 points (i.e. 15 km) and then adding one standard deviation of the bedrock data to produce the enveloping effect. Minor tidying up was done over remaining high points. Our first and simplest response to this problem is simply to terminate the depth integration of shear strain rate at a level zc above the bedrock, to match the observed surface velocities.
This sharp cut-off in strain rate is clearly an oversimplification, but several of the borehole-inclination measurements have shown reduced shear strain rates near the bedrock and maximum values of shear strain rate well above the bedrock at those locations (e.g. Reference Russell-Head and BuddRussell-Head and Budd, 1979; Reference EtheridgeEthendge, 1989; Reference Morgan, van Ommen, Elcheikh and LiMorgan and others, 1998). This reduction is probably due to a combination of reduced shear stress as a result of the influence of longitudinal stresses, and possibly reduced enhancement, since the strong shear fabrics may be disturbed.
We do not know quantitatively how the different processes are responsible for this reduction, so we experimented with applying a more gradual "discount" directly to the shear strain rates at the lower levels. A substantial reduction in strain rates at the lower levels of the ice sheet is required to produce agreement with the observed surface velocities, compared to the simple model expectations of steadily increasing shear stress and warmer ice temperatures with depth. Commencing at a depth zd, the strain rates given by the model were multiplied by functions which decreased monotonically from unity at zd, reaching 0.01 at the bedrock, and the "discount depth" zd was adjusted in each column to produce a match to the observed surface velocities. This appeared to be a reasonably simple way of adjusting the computed velocities to match observations without rescaling the laboratory-based ice rheology These treatments typically produce strain-rate profiles with a band of high shear above the bedrock, which can be compared with observations.
4. Comparison with the Observations, and Discussion
In Figure 3, vertical profiles of shear strain rate from borehole-inclination measurements at three drilling sites on the flowline (see Figs 1 and 4) – BHQ BHC2 (from Reference EtheridgeEtheridge, 1989) and BHF (from Reference Russell-HeadRussell-Head, 1979) – are shown together with the corresponding profiles calculated from two models–the simple "cut-off" model (dotted lines) and an example using a continuous "discount" function (dashed lines) at lower levels. At BHQ (Fig. 3a) and BHF (Fig. 3b) the borehole-inclination logging does not extend to sufficient depth to show a maximum shear layer, although Reference Russell-Head and BuddRussell-Head and Budd (1979) point out that the shear strain rate at BHF cannot continue to increase through the lower levels, given the observed surface velocity and the extent of deformational flow already accounted for. A more complete shear strain-rate profile is available from BHC2 (Reference EtheridgeEtheridge, 1989) a few km downstream of BHF. BHC2 is very close to the end of the flowline, and in matching the surface velocity here it becomes important to deduct the sliding motion. The BHC2 borehole is in a bedrock hollow, and the smoothing of the bedrock also makes the model ice cap appreciably thinner there. With these caveats we display the BHC2 profiles in Figure 3c.
Shear strain-rate profiles from borehole-inclination measurements (solid lines) at (a) BHQ borehole (Reference EtheridgeEtheridge, 1989), (b) BHF borehole (Reference Russell-HeadRussell-Head, 1979) and (c) BHC2 borehole (Reference EtheridgeEtheridge, 1989). Model profiles at these three sites are presented for the "cut-off" model (dotted lines) and a"discount" model (dashed lines).
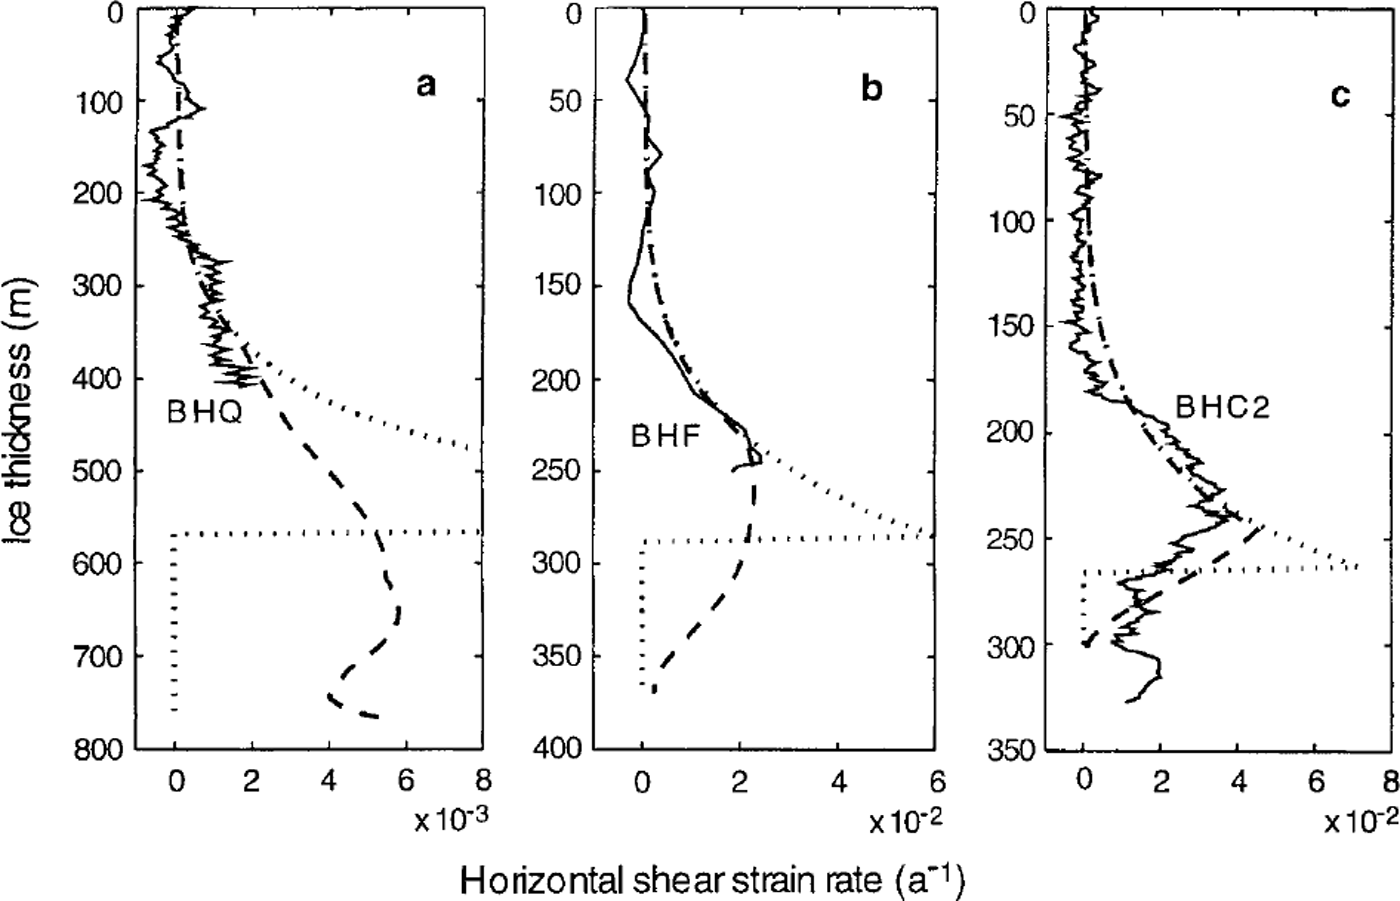
Several aspects of Figure 3 deserve comment. Good agreement is seen between the model strain rates and the observed strain rates in the upper part of the ice sheet. The strain rates at BHQ (Fig.3a) are approximately an order of magnitude smaller than those at BHF (Fig.3b) and BHC2 (Fig.3c). The "cut-off" strain-rate profiles show the need for an improved treatment of dynamics in the lower regions of the ice sheet, to reconcile the agreement with the observed strain rates and agreement with the observed surface velocities. These profiles are of course unrealistic, and the a "discount" model profiles - examples from various experiments that smoothly discount the strain rate at lower levels while maintaining the same surface velocities - may well be more realistic. The depths at which these strain rates diverge from the simple model are clear. Note that a substantial reduction in model strain rates at lower levels is required. We can see that for BHC2 a simple discounting gives a reasonable profile in the lower part of the ice sheet as well. It might be possible to improve the general agreement of the lower part of the shear profiles by careful choices, but there are very few measured profiles to use for this.
Around 180 m depth, the measured profile from BHC2 shows a more rapid increase in shear strain rate than the model profile. This may reflect the failure of one of the assumptions in our model, namely, that the ice fabrics can evolve sufficiently quickly to maintain optimal fabric and tertiary flow conditions with the changing stress conditions encountered as the ice flows through the ice sheet. This assumption about equilibrium tertiary conditions makes the present model a limiting case, since it models the fastest possible adjustment of the anisotropic properties of the ice to the changing stress situation. If the crystal-fabric evolution tends to lag behind the changing stress conditions until sufficient exposure to a period of shear-dominated flow brings it into a compatible fabric, then the enhancement of shear flow will be delayed and concentrated over a thinner band in the ice sheet. Our previous model (Reference Wang and WarnerWang and Warner, 1998), which showed these sharper transitions, represents the other extreme, in that no enhancement was applied in that model until cumulative shear strain overtook compression strain.
The locations in the ice-cap cross-section of contours of the ratio of shear strain rate to compression strain rate are shown in Figure 4. The levels of the "rheologica" or "cut-off" depths, zc, are also indicated in Figure 4, showing that the transition from compression dominance to shear dominance occurs well above that level. Comparing Figures 3 and 4 shows that the most rapid increase in shear lies below the transition from compression to shear dominance. The "cut-off" depth zc lies at a fairly uniform height above the smoothed bedrock, except at the very edge of the ice cap. The mean "cut-off" depth is approximately 78% of the ice thickness (using the smoothed bedrock), with a standard deviation of 4%. Naturally any smoother discounting of shear strain rate must commence higher in the ice sheet.
Profile of the transect from the summit of Law Dome to CaPe Folger, showing the measured bedrock, the smoothed envelope bedrock, three contours of the ratio of shear strain rate to compression strain rate, and the Geological"or "cut-off"depth zc. Crystal-orientationfabrics measured from ice cores from A001 (Reference Jacka and BuddJacka and Budd, 1989), BHQ (Reference Li, Zichu and MaohuanLi and others, 1988) BHF (Reference Russell-HeadRussell-Head, 1979) and BHC2 ( Reference Thwaites, Wilson and McCrayThwaites and others, 1984) and the locations of these fabrics in the boreholes are also displayed.

Analysis of crystal-orientation fabrics in the ice cores from ice sheets has shown that the fabrics develop from a random fabric near the surface to a fully developed fabric with increasing depth. It is also known that the crystal-orientation fabric pattern can be indicative of stress configuration, i.e. a small-circle girdle pattern is compatible with the uniaxial compression-stress configuration, while a single-maximum pattern is compatible with a simple shear-stress configuration (Reference Budd and JackaBudd and Jacka, 1989). Thus, crystal fabrics from ice cores may provide evidence of the location of the transition from compression- to shear-dominated flow.
Some crystal-orientation fabrics from ice cores drilled along our transect-A001 (Reference Jacka and BuddJacka and Budd, 1989), BHQ (Reference Li, Zichu and MaohuanLi and others, 1988), BHF (Reference Russell-HeadRussell-Head, 1979) and BHC2 (Thwaites and others, 1 9 8 4 ) - are shown in Figure 4 together with markers of their depths in the ice sheet. In the upper layers of the ice cap the crystal fabrics appear isotropic. The fabrics at 318 m depth from the A001 core and at 103 m depth from the BHF core, representing girdle patterns, are examples in the vertical compression zone. The single-maximum fabrics from BHQ (at 361 m), BHF (at 282 m) and BHC2 (at 207 m) ice cores are indicative of domination by shear. The relationship between the locations of these fabrics and the ratio of strain rates (and hence in this model the compression fraction λc) is encouraging, and deserves more attention in future work. A multi-maxima fabric near the base at BHC2 is possibly due to basal effects such as higher temperature or reduced stress (Reference Budd and JackaBudd and Jacka, 1989).
Space does not permit a detailed discussion of the temperature distribution, but agreement with borehole-temperature measurements (Reference EtheridgeEtheridge,1989) is reasonable. Temperatures have not been the central concern of our work to date, and while the geothermal heat flux could probably be adjusted to improve the agreement, the high shear stresses computed in basal regions in the present study do not arise from overestimating ice temperatures.
5. Conclusions
A flow model based on ice rheology from laboratory experiments, including enhancement effects measured in combined-stress experiments, gives shear strain-rate profiles that agree well with borehole-inclination measurements along an Antarctic flowline, at least in the upper part of the ice sheet. In spite of this, the simple form of the model predicts much higher surface velocities than are observed on this flowline. With no adjustable parameters in the flow law, the question of reduced shear strain rates in lower levels of the ice sheet must be tackled to reconcile the situation. Explaining the details of flow in these lower levels is expected to be a difficult task, and would depend on the detailed bedrock topography at any location (among other variables). However, the present work suggests that a simpler empirical treatment may merit further investigation. This could be based on the concept of an appropriately smoothed envelope bedrock topography, together with an empirical prescription for the thickness of a basal zone of reduced strain rates. This prescription might depend on quantities such as the ice thickness relative to the smoothed bedrock, and on distance scales associated with some characteristic amplitude of bedrock undulations.
Acknowledgements
We wish to thank W. F. Budd, T. H. Jacka and Lijun for helpful discussions and for access to detailed results of laboratory experiments.



