The importance of depression following a cardiac event in the evolution of cardiac disease has been demonstrated in different meta-analyses (Melle et al., Reference Melle, de Jonge, Spijkerman, Tijssen, Ormel, Veldhuisen and Berg2004; Nicholson, Kuper, & Hemingway, Reference Nicholson, Kuper and Hemingway2006).
However, assessment of depression in heart patients faces serious problems, inter alia the difficulty of distinguishing symptoms of cardiac disease from depressive symptoms. These problems are reflected in prevalence rates of depression in cardiac patients (CPs). The meta-analysis by Melle et al. (Reference Melle, de Jonge, Spijkerman, Tijssen, Ormel, Veldhuisen and Berg2004) showed that prevalence rates of major depression range from 8% to 47% and from 5% to 47% for major depressive disorder in CPs. These differences in prevalence rates may also be attributable to methodological differences in evaluating depression (e.g., questionnaires or diagnostic interviews) and the variety of instruments used (Rutledge, Reis, Linke, Greenberg, & Mills, Reference Rutledge, Reis, Linke, Greenberg and Mills2006). Frasure-Smith and Lespérance (Reference Frasure-Smith and Lespérance2005), for example, report 23 different instruments used in the studies they reviewed. This lack of consensus motivated the National Heart, Lung, and Blood Institute (USA) to convene an interdisciplinary working group to address the issues relating to reliable assessment of depression in patients with cardiovascular disease, resulting in a recommendation to investigate whether depression-measuring instruments used in the general population are applicable to these patients (Davidson et al., Reference Davidson, Kupfer, Bigger, Califf, Carney, Coyne and Suls2006).
The present study is a response to this recommendation and focuses on the study of depression measured with the Zung Self-rating Depression Scale (ZSDS) (Zung, Reference Zung1965) in adult male CPs and healthy people (HP). The ZSDS was used because: (a) it is a widely used instrument (Koivula, Halme, & Astedt-Kurki, Reference Koivula, Halme and Astedt-Kurki2010); (b) it is one of the least complicated self-administered measures of depression and, probably, the easiest to understand (Shumway, Sentell, Unick, & Bamberg, Reference Shumway, Sentell, Unick and Bamberg2004); (c) it independently predicts clinical outcome, especially: 1) death or new hospitalization in hospitalized chronic heart failure patients (Parissis et al., Reference Parissis, Nikolaou, Farmakis, Bistola, Paraskevaidis, Adamopoulos and Kremastinos2008); 2) the relationship between depression after a cardiac event and survival in the elderly (Kamphuis et al., Reference Kamphuis, Geerlings, Giampaoli, Nissinen, Grobbee and Kromhout2009); 3) the risk of death from coronary heart disease or myocardial infarction in subjects free of coronary heart disease at baseline (Ahto, Raimo, Puolijokis, Vahlberg, & Kivela, Reference Ahto, Raimo, Puolijokis, Vahlberg and Kivela2007). We only included men in the study to eliminate a source of variation in the results, because: (a) men experience depression less often than women (Gottlieb et al., 2004); (b) the factor structure of depression is different in the two genders (Steer, Beck, & Brown, Reference Steer, Beck and Brown1989).
Depression consists of various groups of symptoms, but the most widely used instruments in clinical settings have generally failed to justify the clusters of symptoms experienced by individuals and instead have typically offered only global indices of depression. However, excessive dependence on total scores is undesirable, because various profiles of heterogeneous symptoms can be contained in the single dimension of severity. If only total scores are used, it is not possible to identify the different types of depressed people, with prognostic and therapeutic implications.
It is not easy, however, to identify common clusters across miscellaneous populations evaluated with different instruments, and especially in CPs, because: (a) the profiles of depressive symptoms differ in various populations (Steer at al., 1989); (b) the different instruments may be measuring different components of the construct depression; (c) none of the traditional instruments of assessment of depression was specifically designed as an assessment tool for depression in heart patients.
All these problems are evident when reviewing the results obtained with the ZSDS. Most studies involve healthy or non-sick people, with students and the elderly predominating. The structures range from two to four factors. Kitamura, Hirano, Chen, and Hirata (Reference Kitamura, Hirano, Chen and Hirata2004) gathered different factorial solutions published until that date. Later, Shafer (2006) published a meta-analysis of instruments for measuring depression and in the case of the ZSDS opted for a three-factor solution. Construct validity of the ZSDS in CPs using factor analysis has, to our knowledge, only been presented in the study by Barefoot et al. (Reference Barefoot, Brummett, Helms, Mark, Siegler and Williams2000). They analyzed the results of a sample of CPs (1031 men and 219 women) between the ages of 46 and 58 years and for them four factors were the best solution.
The internal consistency of the ZSDS with CPs is not reported in any studies. Zung (Reference Zung1973), using a split-half correlation for the even-odd ZSDS items, obtained a correlation coefficient of .73 and Koivula et al. (Reference Koivula, Halme and Astedt-Kurki2010) a Cronbach’s alpha value of .82 with the Finnish version of the ZSDS.
This study aims, as a first objective, to contribute to the process of ZSDS validation, analyzing the structure of depressive symptoms measured by the ZSDS in a sample of CPs and another of HP and whether dimensional structure is invariant across health status and, as a second objective, to justify its use for screening purposes with CPs.
Method
Participants
Two groups of men, 217 CPs and 191 HP. The CPs correspond to codes I20–I25, ischemic heart disease, according to the International Classification of Diseases-10. Healthy participants were men in whom company physicians or family physicians found no cardiac problems or other physical or mental illness.
Design and Procedure
This study is descriptive and cross-sectional. Study protocols conformed to the ethical guidelines of the 1975 Declaration of Helsinki and were approved by the Ethics Committee of the University Hospital of the Canary Islands, Spain, where the study was carried out. All participants gave informed, written consent.
Data were collected by direct interview. All patients admitted to the Cardiology Department during two calendar years were invited to participate in a study about psychological risks factors for heart disease. Patients were eligible for the study unless they were judged by the clinician to be too debilitated to complete the research protocol (n = 17), or could not understand the informed consent form (n = 36). Twenty four patients refused participation. Although the interval between hospital admission and the interview ranged from 3 to 24 days, more than 85% of the CPs was interviewed within 4 days of admission.
The sample of 191 healthy men completed the protocol on attending their annual medical examination in their respective companies (89%) or during an outpatient medical consultation (11%). Forty one HP refused participation. We selected HP aged between 31–66 years with socio-demographic characteristics as similar as possible to those of the CPs. However, CPs had a significantly lower level of education (25.8% secondary school or higher education), and a higher percentage of CPs were retired (24.9%), compared to the HP (61.3% and 5.2%, respectively, in these socio-demographic categories). Occupational status (manual workers 52.5% of CPS versus 51.8% of HP) was similar between samples, as was marital status (living with partner 92.2% versus 93.7%). The age range of the two samples was the same, 31–66 years, but mean age was significantly higher in CPs, 53.41 (SD = 7.7) versus 48.63 years (SD = 8.5) in HP, t(406) = 5.96, p < .001.
Data Collection Instruments
We used a socio-demographic questionnaire, medical history and the ZSDS among other instruments to assess psychological risk factors for coronary disease. The ZSDS contains 20 items covering affective, cognitive, behavioral, psychological and physiological symptoms of depression. Item responses are ranked from 1 to 4, with high scores corresponding to more frequent or more lasting symptoms. Half of the items are worded negatively and half positively. Total scores on the ZSDS do not correspond with a clinical diagnosis of depression but rather indicate the level of depressive symptoms that may be of clinical relevance. As originally described by Zung, Richards, and Short (Reference Zung, Richards and Short1965), raw scores are summed and then transformed into a ZSDS Index, by dividing the raw score by the maximum score and multiplying by 100 (ZSDS Index = rs/80 x 100). ZSDS Index scores < 50 is normal, i.e. no depression. The mean of the ZSDS Index in CPs is around 48 (Koivula et al., Reference Koivula, Halme and Astedt-Kurki2010) and the prevalence of depressive symptoms is close to 37% (Barefoot et al., Reference Barefoot, Brummett, Helms, Mark, Siegler and Williams2000; Welin, Lappas, & Wilhelmsen, Reference Welin, Lappas and Wilhelmsen2000). In this study we used the second Spanish version of the ZSDS by Conde and Esteban (Reference Conde and Esteban1974). The coefficient of reliability for this version found by Conde and Esteban (Reference Conde and Esteban1975) was .80 using a split-half correlation for the even-odd ZSDS items. Aragonés, Masdéu, Cando, and Coll (Reference Aragonés, Masdéu, Cando and Coll2001) with this same version of ZSDS obtained a Cronbach’s alpha of .78 in primary health-care patients.
Statistical analysis
Exploratory and confirmatory factor analyses (EFA, CFA) were conducted with Mplus 3 using weighted least-squares with mean and variance (WLSMV) adjustment which is optimal choice for categorical outcomes. Mixed linear model (MLM) for non normal data was used when results with WLSMV do not converge. The sample size was adjusted to the recommendations for factor analysis of Guilford (Reference Guilford1954), at least 200 cases, and to those of Thorndike (Reference Thorndike1982), at least 10 subjects per item. The promax rotation algorithm and various criteria for the number of factors, such as Kaiser’s Criterion (eigen values >1.0), the scree test, the Minimum Average Partial (MAP) test and the interpretability of resulting factor structures were used. The primary criterion for item inclusion was set at least at .30 (absolute value).
The confirmatory factor model fit was evaluated with the Tucker-Lewis Index (TLI), the Comparative Fit Index (CFI), and the Root Mean Square Error of Approximation (RMSEA). The TLI and CFI are measures that compare a baseline model in which no relationships are estimated between the variables with a theoretical model in which hypothesized paths are estimated. This index ranges from 0 to 1, where .9 indicates adequate fit, and .8 is considered marginal fit. The RMSEA with fit values less than .05 indicate close fit, and values less than .08 reasonable fit. The RMSEA is sensitive to over-fit, that is, it begins to increase when too many paths have been included (Rigdon, Reference Rigdon1996). These cut-offs apply to models with continuous outcomes, although Yu and Muthén (Reference Yu and Muthén2001) report that they are reasonable for models with categorical outcomes as well.
Results
The factor structure of the ZSDS was analyzed in two ways: separately and jointly in CPs and HP. The criteria used to choose a factorial solution suggested two or three factors.
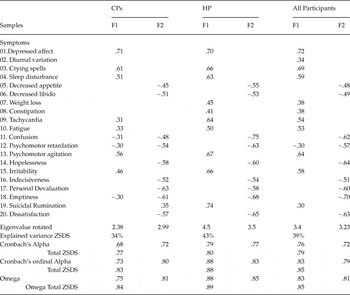
In the two-factor solution, the same structure of the items appeared in the three groups except item 19 which changed factor in CPs, as depicted in Table 1.
Two-factor structure of the ZSDS in all samples

Note:
CPs: coronary patients; HP: Healthy people; All samples: F1 = Negative affect; F2 = Cognitive symptoms.
In the sample of CPs, items 11, 12 and 18 loaded ≥ .30 on both factors and items 2, 7 and 8 did not reach this factor loading on either of them. In the HP sample, no item loaded on two factors ≥ .30 and only item 2 did not load ≥ .30 on a factor. In the total sample, all the items loaded ≥ .30 on a factor and only item 12, Psychomotor retardation, loaded on two factors. Items 1, Depressed affect, 3, Crying spells, 4, Sleep Disturbances, and 13, Psychomotor agitation, loaded ≥ .50 on factor 1 in all samples. Based on items 1 and 3, which Zung (Reference Zung1965) considered to correspond to pervasive depressive affect, this factor can be interpreted as reflecting Negative affect. The items highest loadings on factor 2 show a predominantly cognitive content of depression and the factor can be called Cognitive symptoms. The congruence between factors of the CPs and HP was .86 for Negative affect and .95 for Cognitive symptoms. These values, on surpassing the critical point of .75, allow us to affirm that the factors are similar (Cliff, Reference Cliff1966). MacCallum, Widaman, Zhang, and Hong (Reference MacCallum, Widaman, Zhang and Hong1999) consider these indices respectively borderline and good. Internal consistency of the factors was low (α between .68 and .79) or acceptable, Cronbach’s alpha for ordinal data between .73 and .88 and omega between 75 and 88. The internal consistency of the total scale was acceptable (between .77 and .80 for traditional α) or high (between .83 and .88 for ordinal data and between .85 and .89 for ω).
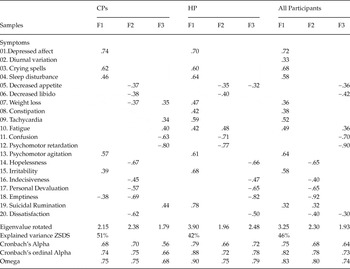
The rotated factor solution with three factors is shown in Table 2.
Three-factor structure of the ZSDS in all samples

Note:
CPs: coronary patients; HP: Healthy people;
CPs: F1 = Negative affect; F2 = Cognitive symptoms; F3 = Somatic symptoms.
HP: F1 = Negative affect ; F2 = Somatic symptoms; F3 = Cognitive symptoms.
All Participants: F1 = Negative affect; F2 = Cognitive symptoms; F3 = Somatic symptoms.
Factors 1, Negative affect, and 2, Cognitive symptoms, remained and a third factor, Somatic symptoms, appeared with items 12 and 11 showing the highest load. This order of factors did not prevail in the factor structure of HP, in which Somatic symptoms relegated Cognitive symptoms to a third factor. In the total sample factor 1 contained practically all the items of factor 1 in HP. Factors 2 and 3 of the total sample share, nevertheless, more items with the same factors of the sample of CPs. The coefficient of congruence between the factor Negative affect in CPs and that of the HP was .76; for factor Cognitive symptoms of the same samples the coefficient of congruence was .72, and for factor Somatic symptoms it was .87. The value .72, on not surpassing the critical point of .75, did not allow us to affirm that the factors are similar (Cliff, Reference Cliff1966), but, as it did exceed .30, congruence between them cannot be ruled out according to MacCallum et al. (Reference MacCallum, Widaman, Zhang and Hong1999). Internal consistency of these factors is slightly lower than that of the two-factors solution except factor 1, Negative Affect, in the sample of CPs, Cronbach’s alpha for ordinal data 74 versus 73, and in the HP sample, omega 90 versus 88.
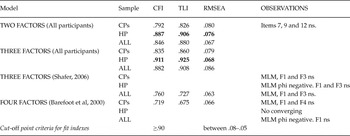
The fit of the results of EFA to four models was analyzed by CFA with all participants. We analyzed a model of two factors obtained from our total sample; two models of three factors, one obtained from our total sample and the other from the meta-analysis by Shafer (Reference Shafer2006); and a model of four factors obtained from the study of Barefoot et al. (Reference Barefoot, Brummett, Helms, Mark, Siegler and Williams2000) in a sample of CPs. The results of these analyses are shown in Table 3.
Confirmatory factor analyses of four factor models of the ZSDS

Note:
ns: not significant. MLM: mixed linear model. MLM for non normal data is used when results with weighted least-squares with mean and variance (WLSMV) do not converge. The indicative values of a reasonable goodness-of-fit are bolded.
Only the HP sample showed adequate or reasonable goodness-of-fit indices with the models of two and three factors specified from our total sample. The CPs showed marginal goodness-of-fit indices for these models. The models of Shafer (Reference Shafer2006) and Barefoot et al. (Reference Barefoot, Brummett, Helms, Mark, Siegler and Williams2000) had convergence problems, a high number of non-significant parameters and inadmissible solutions, e.g., matrices of negative covariance between the factors. These problems, specially presented in table 3, persisted even though we applied the maximum likelihood method (MLM) (associated to the statistical Satorra-Bentler χ2 used frequently for ordinal data) instead of WLSMV. Given the problems of fit or of models, the process of testing for factorial invariance did not seem justified.
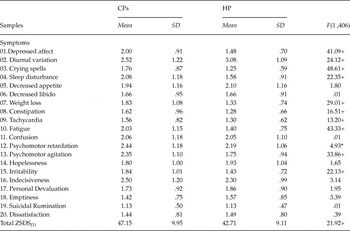
The descriptive statistics of reporting symptoms and comparison of mean values between the two samples are shown in Table 4.
Descriptive statistics of reporting symptoms and comparison of mean values between coronary patients (CPs) and healthy people (HP) AQ1: Si se quieren mantener esos valores en negrita, habría que indicar en Note, por qué se han resaltado.

Note:
Mean values in total ZSDS according to ZSDS Index. * p < .05; + p < .001
The two groups showed significant differences in eleven of the twenty items that compose the ZSDS. In all of them, except in item 2, Diurnal variation, the CPs scored higher than the HP. Mean ZSDS score in CPs was significantly higher, as was the prevalence of CPs above the cut-off point (ZSDS Index ≥ 50) suggested by Zung (Reference Zung1965) to indicate clinically significant depression, 37.85% versus 20.95% in HP.
Discussion
The EFAs supported a two-factor solution in both samples and the congruence between the factors Negative affect and Cognitive symptoms suggested possible invariance. In the three-factor solution the factor Somatic symptoms showed little consistency; strikingly, however, it obtained a higher coefficient in factorial congruence analysis than the other two.
The generalized problems of goodness-of-fit to the models proposed in CFAs indicate that the models of Barefoot et al. (Reference Barefoot, Brummett, Helms, Mark, Siegler and Williams2000) and Shafer (Reference Shafer2006) did not seem suitable for our data, possibly due to cultural and linguistic attributes of the samples. The models elaborated from the data of our participants, only showed reasonable goodness-of-fit in the HP sample, which ruled out evaluation of factorial invariance. The different goodness-of-fit of the factor structure in the two samples highlights the fact that depressive symptoms tend to be structured according to the samples (Costello, Reference Costello1992). Only the HP sample presented adequate goodness-of-fit, suggesting that the ZSDS assesses slightly different aspects of depressive symptoms in CPs and HP.
Total ZSDS showed good reliability (ordinal α, and ω) in the three samples analyzed (CPs, HP and CPs+HP). This result is higher and consistent with the reliability obtained with the same Spanish version of the ZSDS (Aragonés et al., Reference Aragonés, Masdéu, Cando and Coll2001; Conde & Esteban, Reference Conde and Esteban1975) and with the internal consistency obtained in other countries and languages (Koivula et al., Reference Koivula, Halme and Astedt-Kurki2010; Zung, Reference Zung1973).
We found that in the immediate period after a coronary event, CPs presented significantly more depressive symptoms than HP, and that the prevalence of CPs with depressive symptoms was significantly higher than in HP. These results are consistent with the data available and the prevalence of depressive symptoms is practically identical to that found by Barefoot et al. (Reference Barefoot, Brummett, Helms, Mark, Siegler and Williams2000) and Welin et al. (Reference Welin, Lappas and Wilhelmsen2000) in CPs. These results also support the validity and usefulness of the Spanish version of ZSDS for CPs. Our conclusions would, however, have been reinforced if the socio-demographic characteristics of the HP had better matched those of the CPS.
The significant differences in depressive symptoms occurred in nine positively-worded items that load on the factor Negative affect and only on one negatively-worded item, which raises serious doubts about whether the items with reversed scoring are comprehensible. In this way the differences between groups would not only appear in positively-worded items, and the items would not be grouped in factor analyses according to direct or reverse evaluation. It also raises the question about whether the items need reformulation to avoid bias related to direct or reverse evaluation.
The ZSDS item content corresponds to the construct depression, although to update it, this content would need an adjustment to the American Psychiatric Association’s new criteria of depression.
Our study supports the existence of two factors in both CPs and HP, although only the latter group showed adequate goodness-of-fit with a two-factor model. The three-factor structure highlighted important differences between the two groups, and only showed acceptable goodness-of-fit in HP.
Our results thus favor a bi-factorial solution and do not allow us to affirm the existence of structure invariance. This implies the need for specific information and research on the depressive dimensions of CPs, because depression in CPs can be different from that suffered by HP.
The total score provides reliable and consistent results regarding degree and prevalence of depressive symptoms in CPs and HP in different countries; its use is therefore justified as a measure of degree of depression for screening purposes in CPs and HP, although the diagnosis of depression should be validated with data obtained from an external criterion as it is a structured clinical interview administered by well-trained individuals.
The results of this study suggest that we should continue to use ZSDS total score as opposed to factor scores, and that CPs may have depressive symptoms associated or not associated with coronary disease, which require further investigation.