Introduction
Mining is a major component of economic development globally, supplying critical raw materials for infrastructure, technology, and energy systems (Sonter et al. Reference Sonter, Ali and Watson2018). At the same time, like many land-intensive industries, mining can contribute to environmental change through land clearance, soil disturbance, and altered hydrological systems. These processes may lead to habitat modification, fragmentation, and biodiversity loss if not carefully managed (Betts et al. Reference Betts, Wolf, Ripple, Phalan, Millers and Duarte2017; Sonter et al. Reference Sonter, Ali and Watson2018). Consequently, there is increasing recognition of the need to balance resource extraction with biodiversity conservation through improved land-use planning, mitigation strategies, and environmental governance frameworks.
The Philippines is recognised as a global biodiversity hotspot, supporting high levels of endemism alongside growing economic development demands (Myers et al. Reference Myers, Mittermeier, Mittermeier, Da Fonseca and Kent2000). The country’s mineral resources represent an important economic asset, contributing to livelihoods, infrastructure development, and national growth. However, many mineral deposits spatially coincide with the remaining areas of tropical forest and other ecologically sensitive areas, creating potential trade-offs between conservation and development objectives. While mining operations can result in deforestation, habitat fragmentation, and environmental pollution, the extent and severity of these impacts vary depending on operational practices, regulatory compliance, and the effectiveness of mitigation measures (WWF 2015; Laurance et al. Reference Laurance, Clements, Sloan, O’Connell, Mueller and Goosem2014). Understanding these spatial interactions is therefore essential for identifying opportunities to minimise environmental impacts while supporting sustainable development.
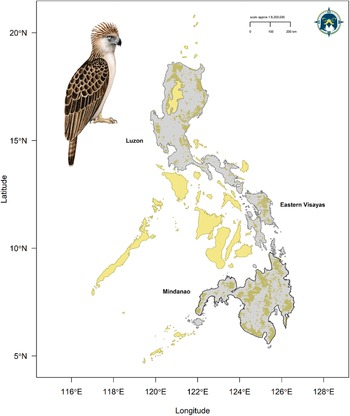
The Philippine Eagle Pithecophaga jefferyi is an evolutionary distinct tropical forest raptor (McClure et al. Reference McClure, Berkunsky, Buechley, Dunn, Johnson and McCabe2023) and one of the most threatened birds globally, currently classified as Critically Endangered on the IUCN Red List (BirdLife International 2018). The Philippine Eagle is endemic to four islands in the Philippine archipelago (Mindanao, Leyte, Samar, and Luzon; Figure 1), but is now sparsely distributed across mainly montane, and some lowland, dipterocarp forests (Salvador and Ibañez Reference Salvador and Ibañez2006; Sutton et al. Reference Sutton, Ibañez, Salvador, Taraya, Opiso, Senarillos and McClure2023a). The population has declined drastically over the past 50 years, mainly due to habitat loss through deforestation (Bueser et al. Reference Bueser, Bueser, Afan, Salvador, Grier, Kennedy and Miranda2003; Kennedy Reference Kennedy1977; O’Bryan et al. Reference O’Bryan, Xie, Li, Buechley, Bader, Allan and Buij2025; Sutton et al. Reference Sutton, Ibañez, Salvador, Taraya, Opiso, Senarillos and McClure2023a) and persecution (Salvador and Ibañez Reference Salvador and Ibañez2006; Ibañez et al. Reference Ibañez, Sumaya, Tampos and Salvador2016a).
Current distribution map for the Philippine Eagle showing range islands (light grey) and Area of Habitat range model from Sutton et al. (Reference Sutton, Ibañez, Salvador, Taraya, Opiso, Senarillos and McClure2023a; brown polygons). Dark grey polygon defines the extent of Mindanao for our modelling. Yellow polygons define the national boundary of the Philippines outside of the species known range. Illustration by Bryce W. Robinson.

Figure 1. Long description
A geographical map plotted on a coordinate system with Latitude on the Y-axis (5 degrees North to 20 degrees North) and Longitude on the X-axis (116 degrees East to 128 degrees East).
* Top-Left: An illustration of a Philippine Eagle by Bryce W. Robinson is positioned in the Northwest corner.
* Top-Right: A scale bar indicates approximately 1 to 9,200,000, with markers for 0, 100, and 200 kilometers. A compass rose is located in the far Northeast corner.
* Map Features:
- Light grey polygons represent the range islands of the species.
- Brown polygons overlaid on the grey islands represent the Area of Habitat range model.
- Yellow polygons represent national boundaries outside the species’ known range, including Palawan in the Southwest and various central islands.
* Regional Distribution:
- North: Luzon island shows fragmented brown habitat polygons concentrated along its eastern and northern coasts.
- East: Eastern Visayas islands show brown habitat polygons covering significant portions of the landmass.
- South: Mindanao is outlined with a dark grey polygon to define the modeling extent. It contains the largest continuous areas of brown habitat polygons, particularly in the eastern and central mountainous regions.
Mindanao currently represents the species’ stronghold, particularly in the eastern portion of the island where relatively extensive forest cover remains (Sutton et al. Reference Sutton, Ibañez, Salvador, Taraya, Opiso, Senarillos and McClure2023a). As a forest-dependent apex predator, the Philippine Eagle is sensitive to changes in forest structure and landscape configuration. Many planned mining concessions coincide spatially with areas of high forest canopy biomass which nesting adult eagles select preferentially (Sutton et al. Reference Sutton, Ibañez, Salvador, Taraya, Opiso, Senarillos and McClure2024a), raising the potential for conflicts between resource extraction and species conservation. However, mining activities are heterogeneous in their impacts, and with appropriate planning, mitigation, and monitoring, there may be opportunities to reduce risks to critical habitats (BirdLife International 2018). Identifying where such overlaps occur is therefore a key step in informing evidence-based land-use decisions for species conservation.
Spatial gap analysis has traditionally been used to evaluate the coverage of protected areas against the distribution of suitable habitats (Scott et al. Reference Scott, Davis, Csuti, Noss, Butterfield and Groves1993; Sutton et al. Reference Sutton, Benjara, de Roland L-A, Thorstrom and McClure2023b). For the Philippine Eagle, this analysis has revealed discrepancies between the eagle’s habitat needs and the protection provided by existing reserves (Sutton et al. Reference Sutton, Ibañez, Salvador, Taraya, Opiso, Senarillos and McClure2023a). Such gaps in protection often occur in regions rich in mineral resources, where mining pressures are high. Hotspot analysis is a complementary approach to gap analysis which then identifies locations with a high concentration of suitable habitats (Erst et al. Reference Erst, Baasanmunkh, Tsegmed, Oyundelger, Sharples and Oyuntsetseg2023). A spatial gap analysis integrated with a hotspot analysis assessed with a predictive species distribution model (SDM) offers a promising approach to mitigating the impacts of mining on the Philippine Eagle. For the Philippine Eagle, SDMs can identify suitable habitats by incorporating ecological variables such as forest cover and topography, similar to previous studies quantifying landscape-scale habitat use for large forest raptors (Natsukawa et al. Reference Natsukawa, Yuasa, Fujisaki, Kobayashi, Maruyama and Masukawa2024; Sutton et al. Reference Sutton, Anderson, Franco, McClure, Miranda and Vargas2022a).
By mapping areas of high habitat suitability, SDMs help pinpoint critical areas that overlap with existing or planned mining concessions. This information is crucial for highlighting high-risk zones where mining activities could threaten eagle populations. Additionally, understanding the current coverage of both protected areas and indigenous land areas is key for Philippine Eagle conservation (Salvador and Ibañez Reference Salvador and Ibañez2006). Many indigenous lands are in montane forest remnants where most Philippine Eagles nest (Sutton et al. Reference Sutton, Ibañez, Salvador, Taraya, Opiso, Senarillos and McClure2023a) and so working with these indigenous communities is important for eagle conservation (Panopio et al. Reference Panopio, Pajaro, Grande, Dela Torre, Raquino and Watts2021; Salvador and Ibañez Reference Salvador and Ibañez2006). Importantly, many planned mining concessions are within areas of indigenous managed land (known as ‘ancestral domains’), thus understanding the extent of habitat across ancestral indigenous areas is key for Philippine Eagle conservation priority setting (Panopio et al. Reference Panopio, Pajaro, Grande, Dela Torre, Raquino and Watts2021).
Nest surveys are a fundamental tool for assessing the impact of mining on wildlife, especially for species like the Philippine Eagle that require specific conditions for nesting and reproduction (Abaño et al. Reference Abaño, Salvador and Ibañez2016; Salvador and Ibañez Reference Salvador and Ibañez2006). By identifying nesting sites and their proximity to mining activities based on a predictive SDM, researchers can evaluate the extent of habitat disturbance and prioritise areas for conservation (Ibañez et al. Reference Ibañez, Miranda, Balaquit-Ibañez, Afan and Kennedy2003). For example, this information can guide the creation of buffer zones around critical habitats and inform land-use planning to minimise overlap between mining operations and key nesting areas. For species like the Philippine Eagle, these surveys are invaluable in shaping conservation strategies that mitigate the impacts of mining while ensuring the protection of the species’ remaining habitats (DENR Reference Cabrido2016).
Here, we aim to: (1) model the current habitat distribution of the Philippine Eagle on Mindanao in relation to environmental variables and known occurrences; (2) analyse the overlap between suitable eagle habitats and existing or planned mining concessions to identify high-risk zones within the EMBC and (3) evaluate the effectiveness of existing protected areas and ancestral domains in conserving the Philippine Eagle within the corridor and propose conservation strategies to mitigate mining impacts. We focused our gap and hotspot modelling on the EMBC, which is a global priority for biodiversity conservation having the largest concentration of Key Biodiversity Areas (KBA) on Mindanao, on one hand, and the greatest number of mining concessions on the other (Ambal et al. Reference Ambal, Duya, Cruz, Coroza, Vergara and de Silva2012). By addressing these objectives, we seek to provide an evidence base for conservation planning and policy recommendations to balance resource extraction with the conservation of the Philippine Eagle and its habitat.
Methods
Species locations
We compiled Philippine Eagle point localities from the Global Raptor Impact Network (GRIN, McClure et al. Reference McClure, Anderson, Buij, Dunn, Henderson and McCabe2021), a data information system for population monitoring of all raptor species. For the Philippine Eagle, GRIN includes presence-only data consisting of nest locations (n = 48) from unstructured surveys (i.e., with no true absence data) conducted on Mindanao by the Philippine Eagle Foundation since 1978 to the present (Ibañez et al. Reference Ibañez, Sumaya, Tampos and Salvador2016a; Miranda et al. Reference Miranda, Salvador, Ibañez and Balaquit-Ibañez2000). We used all nest locations recorded from year 1978 onwards because overall they match the temporal timeframe of the habitat covariates, whilst retaining sufficient sample size for robust modelling (van Proosdij et al. Reference van Proosdij, Sosef, Wieringa and Raes2016). We recognise the temporal mismatch between the habitat covariates and the first year of recording for some nest sites. However, we included all known nests because Philippine Eagles are site-faithful to established nests over decades (Ibañez Reference Ibañez2009) and our date for nests is the earliest recorded year of discovery. We made this decision because our aim was to provide a complete understanding of species-habitat associations irrespective of disturbance events.
Additionally, we included 562 GPS tracking fixes from seven nesting adult Philippine Eagles on the island of Mindanao sourced from the Philippine Eagle Foundation (Supplementary material Table S1) and pooled this with the nest locations to better represent habitat use of a rare species with limited occurrences (Fletcher et al. Reference Fletcher, Hefley, Robertson, Zuckerberg, McCleery and Dorazio2019; See Supplementary material). A total of 80,966 raw unfiltered fixes were obtained from four adult females and three adult males from April 2013 to September 2024. We removed all duplicate fixes and applied a 1 km spatial filter to this raw dataset resulting in 562 spatially-filtered GPS fixes (Supplementary material Table S1). We combined the known nest locations with the filtered GPS tracking fixes, resulting in a filtered subset of 610 occurrence records for the calibration models. We used spatial filtering because it is the most effective method to account for sampling bias (Boria et al. Reference Boria, Olson, Goodman and Anderson2014; Fourcade et al. Reference Fourcade, Engler, Rödder and Secondi2014; Kramer-Schadt et al. Reference Kramer‐Schadt, Niedballa, Pilgrim, Schröder, Lindenborn and Reinfelder2013) and to ensure we retained the nest locations as priority data points because of their geolocation accuracy and direct relevance to optimal conditions and resources for Philippine Eagle nest occurrence.
Habitat covariates
We defined the species’ accessible area (Barve et al. Reference Barve, Barve, Jiménez-Valverde, Lira-Noriega, Maher and Peterson2011) as consisting of the mainland area of Mindanao (Figure 1; dark bordered grey polygon), extracted from the World Wildlife Fund (WWF) terrestrial ecoregions shapefile (Olson et al. Reference Olson, Dinerstein, Wikramanayake, Burgess, Powell and Underwood2001). We selected the ecoregion area corresponding to either lowland or montane moist tropical forest because the Philippine Eagle is a habitat specialist of tropical dipterocarp forests (Bueser et al. Reference Bueser, Bueser, Afan, Salvador, Grier, Kennedy and Miranda2003; Salvador and Ibañez Reference Salvador and Ibañez2006; Sutton et al. Reference Sutton, Ibañez, Salvador, Taraya, Opiso, Senarillos and McClure2023a). All raster environmental layers were then cropped to this delimited polygon consisting of the ecoregions within the mainland area of Mindanao. We selected habitat covariates a prioiri based both on environmental factors related empirically to resources and conditions influencing Philippine Eagle distribution (Bueser et al. Reference Bueser, Bueser, Afan, Salvador, Grier, Kennedy and Miranda2003; Ibañez et al. Reference Ibañez, Miranda, Balaquit-Ibañez, Afan and Kennedy2003; Salvador and Ibañez Reference Salvador and Ibañez2006; Sutton et al. Reference Sutton, Ibañez, Salvador, Taraya, Opiso, Senarillos and McClure2023a).
We predicted occurrence using six continuous covariates at a spatial resolution of 1 km (Supplementary material Figure S1) derived from multiple satellite remote sensing products. We used a 1 km spatial resolution because this is the standard resolution to calculate the area of habitat and is also an effective area size to conduct nest surveys. We used three forest structure indices to assess the combined effects of forest structure and human impact on the distribution of the Philippine Eagle: Forest Landscape Integrity Index (FLII; Grantham et al. Reference Grantham, Duncan, Evans, Jones, Beyer, Schuster and Watson2020), Forest Structural Condition Index (FSCI; Hansen et al. Reference Hansen, Barnett, Jantz, Phillips, Goetz and Hansen2019) and Forest Structure Integrity Index (FSII; Hansen et al. Reference Hansen, Barnett, Jantz, Phillips, Goetz and Hansen2019), all sourced from a globally available repository (https://map.unbiodiversitylab.org/earth) spanning years 2000-2017. We included three indices of forest structure and integrity because they are important predictors for avian SDMs, albeit rarely used (Burns et al. Reference Burns, Clark, Salas, Hancock, Leland and Jantz2020; Leitão and Santos Reference Leitão and Santos2019), and knowing that low level human infrastructure is empirically related to highly suitable Philippine Eagle habitat (Sutton et al. Reference Sutton, Ibañez, Salvador, Taraya, Opiso, Senarillos and McClure2023a). Additionally, these indices provide complementary measures of forest condition, ranging from broad landscape integrity to detailed structural attributes, allowing for a comprehensive evaluation of habitat suitability. We extracted FLII values at 300 m resolution and resampled these pixels to 1 km using bilinear interpolation. We utilised FSCI and FSII data at 30 m resolution and then resampled the raster layers to 1 km using bilinear interpolation to refine our analysis of fine-scale habitat quality.
Forest Landscape Integrity Index (FLII; Grantham et al. Reference Grantham, Duncan, Evans, Jones, Beyer, Schuster and Watson2020) was utilised to quantify the degree of anthropogenic disturbance at a landscape scale. The FLII integrates measures of human modification, including land-use change, infrastructure, and direct forest exploitation, to generate a continuous index of forest integrity, with higher values indicating minimally disturbed forests. Forest Structural Condition Index (FSCI; Hansen et al. Reference Hansen, Barnett, Jantz, Phillips, Goetz and Hansen2019) was employed to evaluate forest structure based on remote sensing-derived tree cover, canopy height, and biomass. This index provides an assessment of forest degradation by measuring deviations from expected structural conditions under minimal human disturbance, with higher values indicating less disturbed forests. Last, the Forest Structure Integrity Index (FSII; Hansen et al. Reference Hansen, Barnett, Jantz, Phillips, Goetz and Hansen2019) was used to measure structural degradation by comparing observed forest structure against a baseline of intact conditions. FSII captures the extent to which human activity has altered vertical and horizontal forest complexity, providing a critical parameter for species reliant on undisturbed forest canopies, with higher FSII values indicating more complex forest structure.
Additionally, we used a homogeneity texture measure calculated from a 1 km resolution Enhanced Vegetation Index (EVI) and a 1 km Leaf Area Index (LAI) measuring forest canopy leaf density, both sourced from the Dynamic Habitat Indices portal (Radeloff et al. Reference Radeloff, Dubinin, Coops, Allen, Brooks and Clayton2019; https://silvis.forest.wisc.edu/data/dhis/). Homogeneity is a biophysical texture measure closely related to vegetation structure, composition, and diversity (i.e., species richness) derived from textural features of Enhanced Vegetation Index (EVI) between adjacent pixels; sourced from MODIS vegetation products, spanning the years 2003-2014 (Radeloff Reference Radeloff, Dubinin, Coops, Allen, Brooks and Clayton2019). We calculated raster cell texture values using 32 grey-level co-occurrence matrices in the R package glcm (Zvoleff Reference Zvoleff2019) using a 3x3 window and a 90° shift to represent the spatial variability and arrangement of vegetation species richness on a continuous scale which varies between zero (minimum homogeneity, high species richness) and one (maximum homogeneity, low species richness).
Leaf Area Index (LAI) is a biophysical measure of the amount of foliage within the plant canopy based on MODIS vegetation products, used here as a composite Dynamic Habitat Index product spanning the years 2003-2014 (Radeloff Reference Radeloff, Dubinin, Coops, Allen, Brooks and Clayton2019). LAI values range from 0 (bare ground) to > 10 (dense coniferous forest) and is a key driver of primary productivity (Asner et al. Reference Asner, Scurlock and Hicke2003). The DHI products summarise three measures of vegetation productivity: annual cumulative, minimum throughout the year, and seasonality as the annual coefficient of variation. Combined, we used both Dynamic Habitat Indices as environmental proxies, with higher LAI values associated with higher prey species richness (Hobi et al. Reference Hobi, Dubinin, Graham, Coops, Clayton, Pidgeon and Radeloff2017) and higher EVI values with higher habitat heterogeneity, both of which are key variables for predicting the distribution of large tropical forest eagles (Sutton et al. Reference Sutton, Anderson, Franco, McClure, Miranda and Vargas2023c, Sutton et al. Reference Sutton, Anderson, Franco, Gomes, McClure and Miranda2024b).
Last, we included Terrain Roughness Index (TRI) as a measure of topographic complexity sourced from the European Space Agency Copernicus 30m Global Digital Elevation Model (ESA 2024). TRI data were extracted at 30m resolution from the Open Topography repository (https://portal.opentopography.org) and then resampled using bilinear interpolation to 1 km to match the existing raster layers. TRI is a measure of variation in topography around a central pixel, with lower values indicating flat terrain and higher values indicating larger differences in elevation of neighbouring pixels (Wilson et al. Reference Wilson, O’Connell, Brown, Guinan and Grehan2007). We used TRI because of the complex mountainous landscape of Mindanao, knowing that Philippine Eagles prefer areas of medium to high topographic complexity for nest sites (Ibañez et al. Reference Ibañez, Miranda, Balaquit-Ibañez, Afan and Kennedy2003). All selected covariates showed low collinearity with Variance Inflation Factors (VIF) all less than 6; Table S2).
Species Distribution Models
We parametrised the SDMs using a fine 1 km pixel grid, equivalent to fitting an inhomogeneous Poisson process (IPP) with loglinear intensity (Baddeley et al. Reference Baddeley, Berman, Fisher, Hardegen, Milne and Schuhmacher2010). We did this because the IPP framework is the most effective method to model presence-only data (Warton and Shepherd Reference Warton and Shepherd2010), common to many raptor monitoring programmes which solely seek to identify occupied areas (Geary et al. Reference Geary, Haworth and Fielding2018). We fitted SDMs using penalised logistic regression, via maximum penalised likelihood estimation (Hefley and Hooten Reference Hefley and Hooten2015) in the R package maxnet (Phillips et al. Reference Phillips, Anderson, Dudík, Schapire and Blair2017). Penalised logistic regression imposes a regularization penalty on the model coefficients, shrinking towards zero the coefficients of covariates that contribute the least to the model, reducing model complexity (Gastón and García-Viñas Reference Gastón and García-Viñas2011). We limited model complexity because this is necessary when the primary goal is to use SDMs for predictive transferability in space (Helmstetter et al. Reference Helmstetter, Conway, Stevens and Goldberg2020).
The maxnet package fits the SDM as a form of infinitely weighted logistic regression (presence weights = 1, background weights = 100), based on the maximum entropy algorithm, MAXENT (Phillips et al. Reference Phillips, Anderson, Dudík, Schapire and Blair2017). MAXENT is designed for presence-background SDMs and is mathematically equivalent to estimating the parameters for an IPP (Renner and Warton Reference Renner and Warton2013; Renner et al. Reference Renner, Elith, Baddeley, Fithian, Hastie and Phillips2015). We used a tuned penalised logistic regression algorithm because this approach outperforms other SDM algorithms (Valavi et al. Reference Valavi, Guillera‐Arroita, Lahoz‐Monfort and Elith2021), including ensemble averaged methods (Hao et al. Reference Hao, Elith, Lahoz‐Monfort and Guillera‐Arroita2020). We evaluated calibration accuracy for the Mindanao model using a random sample of 5,150 background points at a recommended 1:10 ratio to the number of occurrence points (Helmstetter et al. Reference Helmstetter, Conway, Stevens and Goldberg2020), to sufficiently sample the background calibration environment (Barbet-Massin et al. Reference Barbet‐Massin, Jiguet, Albert and Thuiller2012; Guevara et al. Reference Guevara, Gerstner, Kass and Anderson2018). Full details on the model parameter settings are outlined in the Supplementary Material.
We used Continuous Boyce index (CBI; Hirzel et al. Reference Hirzel, Le Lay, Helfer, Randin and Guisan2006) as a threshold-independent metric of how predictions differ from a random distribution of observed presences (Boyce et al. Reference Boyce, Vernier, Nielsen and Schmiegelow2002). CBI is consistent with a Spearman correlation (rs) and ranges from −1 to +1. Positive values indicate predictions consistent with observed presences, values close to zero suggest no difference with a random model, and negative values indicate areas with frequent presences having low environmental suitability. We calculated mean CBI using five-fold cross-validation on 20% test data with a moving window for threshold-independence and 101 defined bins in the R package enmSdm (Smith Reference Smith2019). We further tested the optimal predictions against random expectations using partial Receiver Operating Characteristic ratios (pROC), which estimate model performance by giving precedence to omission errors over commission errors (Peterson et al. Reference Peterson, Papeş and Soberón2008). Partial ROC ratios range from 0 to 2 with 1 indicating a random model. Function parameters were set with a 10% omission error rate, and 1,000 bootstrap replicates on 50% test data to determine significant (
$ \alpha =0.05 $
 ) pROC values >1.0 in the R package ENMGadgets (Barve and Barve, Reference Barve and Barve2013).
Hotspot Analysis
To further refine our analysis, we projected our range-wide continuous SDM for Mindanao into the area of eastern Mindanao (including the provinces of Agusan del Norte and del Sur, Compostela Valley, Davao Oriental and Surigao del Norte and del Sur), to predict hotspots of Philippine Eagle habitat. The projected continuous prediction for eastern Mindanao was then reclassified to a threshold prediction using three discrete quantile classes representing habitat suitability (Low: 0.000–0.382; Medium: 0.383–0.652; High: 0.653–1.000). We calculated class-level landscape metrics on the discrete quantile classes to estimate total and core area of habitat in each class in the R package SDMTools (VanDerWal et al. Reference VanDerWal, Falconi, Januchowski, Shoo, Storlie and VanDerWal2014), based on the FRAGSTATS program (McGarigal et al. Reference McGarigal, Cushman, Neel and Ene2002). Core areas were defined as those cells with edges wholly within each habitat class, with cells containing at least one adjacent edge to another class cell considered as edge habitat (Sutton et al. Reference Sutton, de Roland L-A, Thorstrom and McClure2022b). We then overlaid the current mining concessions shapefile for Mindanao and identified those mining concessions that had continuous core areas of 9 km2 of high habitat cells as priority sites for nest surveys. We used 9 km2 because this is the minimum core home range estimate for adult Philippine Eagles on Mindanao (Sutton et al. Reference Sutton, Ibañez, Salvador, Taraya, Opiso, Senarillos and McClure2024a).
Additionally, we validated our models in conjunction with expert judgement because this approach gives most benefit to conservation priority assessments (Marcer et al. Reference Marcer, Sáez, Molowny-Horas, Pons and Pino2013; Syfert et al. Reference Syfert, Joppa, Smith, Coomes, Bachman and Brummitt2014). We assessed the discrete quantile thresholds for biological realism (25% lower quantile, median, 75% upper quantile), using expert critical feedback to assess the predictive ability of our models, with the 75% upper quantile discrete class evaluated as a plausible range extent for high habitat suitability. We followed this participatory modelling process methodology to ensure a robust expert validation of our models, concurring with current knowledge of species biology and its application to conservation planning (Ferraz et al. Reference Ferraz, Morato, Bovo, da Costa, Ribeiro and de Paula2020).
Spatial Gap Analysis
Last, we assessed the level of protected area coverage within the Eastern Mindanao Biodiversity Corridor (EMBC) and indigenous ancestral domains using the Philippines Department of Environment and Natural Resources (DENR) terrestrial shapefiles. We overlaid and intersected the EMBC and ancestral domain shapefiles to assess the current level of protected area coverage and identify any key gaps in coverage between the two shapefiles compared to areas of highest core nest habitat. We used the R program (v3.5.1; R Core Team, 2018) for model development and geospatial analysis using the raster (Hijmans Reference Hijmans2017), rgdal (Bivand et al. Reference Bivand, Keitt and Rowlingson2019), rgeos (Bivand and Rundle Reference Bivand and Rundel2019) and sp (Bivand et al. Reference Bivand, Pebesma and Gomez-Rubio2013) packages.
Results
Species distribution models
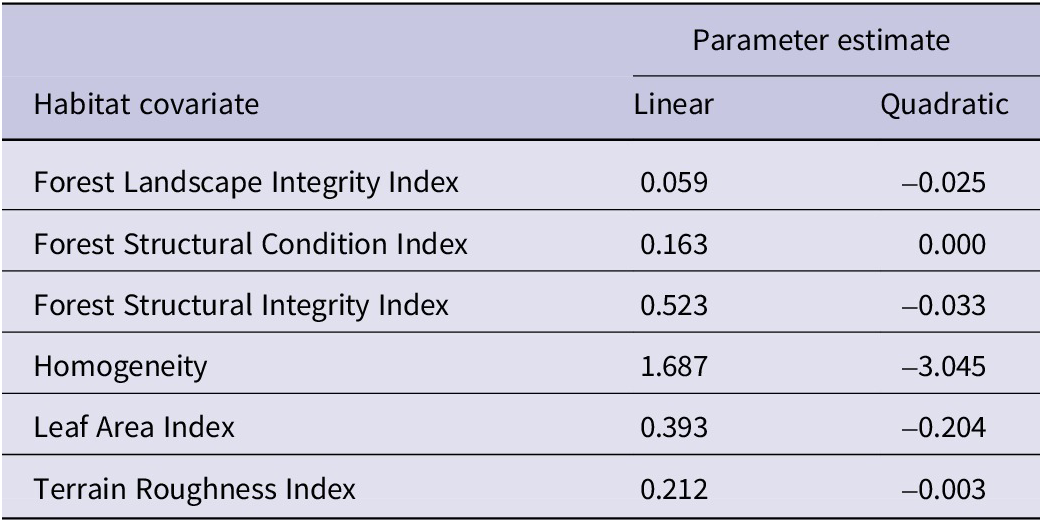
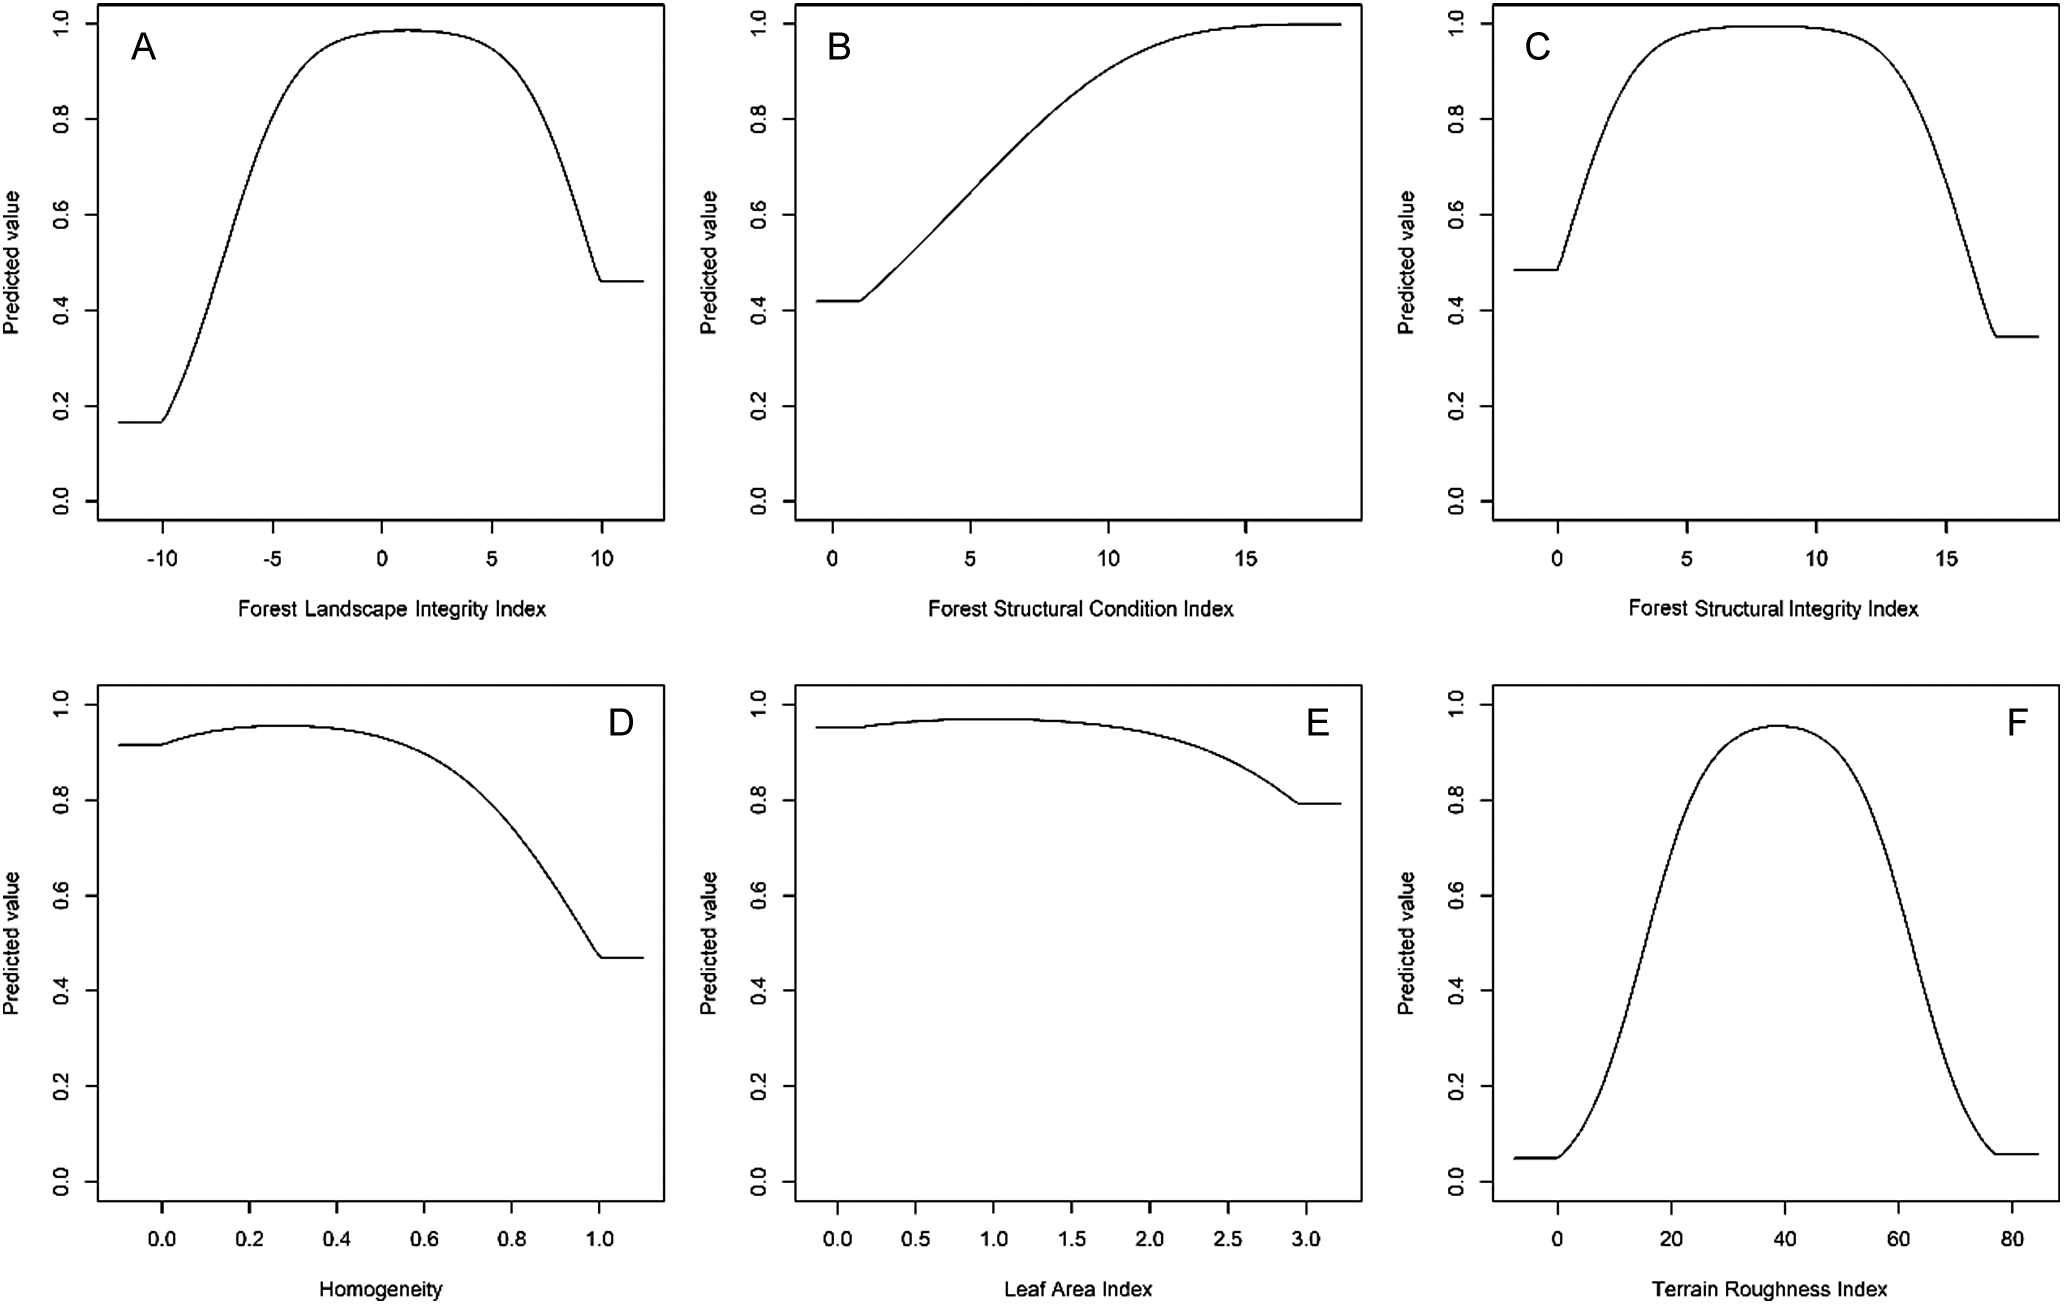
From our 38 candidate models, only one had an ΔAICc ≤ 2 with this best-fit model using a beta coefficient penalty of β = 1 with both linear and quadratic terms as model parameters. Our best-fit model had high calibration accuracy (mean CBI = 0.936), and was robust against random expectations (pROC = 1.602, SD ± 0.049, range: 1.427–1.751). The optimal model shrinkage penalty (β = 1) was able to retain eleven non-zero beta coefficients (Table 1), meaning most covariate terms were highly informative to model prediction (Supplementary material Figures S4–S6). Philippine Eagles on Mindanao were most strongly associated with low Homogeneity values, meaning that high habitat heterogeneity derived from Enhanced Vegetation Index was the optimal predictor for identifying high-suitability eagle nest habitat (Table 1; Figure 2).
Parameter estimates from penalised linear and quadratic beta coefficients derived from the response functions for each habitat covariate from the range-wide Species Distribution Model for the Philippine Eagle on Mindanao.

Table 1. Long description
The table consists of three columns: Habitat covariate, Linear parameter estimate, and Quadratic parameter estimate.
* Forest Landscape Integrity Index: Linear 0.059, Quadratic minus 0.025.
* Forest Structural Condition Index: Linear 0.163, Quadratic 0.000.
* Forest Structural Integrity Index: Linear 0.523, Quadratic minus 0.033.
* Homogeneity: Linear 1.687, Quadratic minus 3.045.
* Leaf Area Index: Linear 0.393, Quadratic minus 0.204.
* Terrain Roughness Index: Linear 0.212, Quadratic minus 0.003.
Penalised logistic regression response functions for each habitat covariate from the optimal Species distribution model for the Philippine Eagle on Mindanao island. Each curve shows the contribution to model prediction (y-axis) as a function of each continuous habitat covariate (x-axis). Maximum values in each response curve define the highest predicted relative suitability. The response curves reflect the partial dependence on predicted suitability for each covariate and the dependencies produced by interactions between the selected covariate and all other covariates. A: Forest Landscape Integrity Index (FLII); B: Forest Structural Condition Index (FSCI); C: Forest Structural Integrity Index (FSII); D: Homogeneity; E: Leaf Area Index (LAI); F: Terrain Roughness Index (TRI).

Figure 2. Long description
A grid of six line graphs arranged in two rows and three columns. All graphs share a y-axis labeled Predicted value ranging from 0.0 to 1.0.
Top-left panel: x-axis is Forest Landscape Integrity Index. The curve starts at a predicted value of 0.2, rises sharply between negative 10 and 0, peaks near 1.0, and then drops to 0.5 at index 10.
Top-center panel: x-axis is Forest Structural Condition Index. The curve shows a steady sigmoidal increase starting from 0.4 at index 0 and reaching a plateau near 1.0 at index 15.
Top-right panel: x-axis is Forest Structural Integrity Index. The curve starts at 0.5, rises to a peak of 1.0 at index 7, and then declines to 0.35 at index 15.
Bottom-left panel: x-axis is Homogeneity. The curve starts high at 0.9, peaks slightly at 0.3, and then shows a downward trend to 0.5 as homogeneity reaches 1.0.
Bottom-center panel: x-axis is Leaf Area Index. The curve remains very high, near 1.0, from index 0 to 1.5, before gradually declining to 0.8 at index 3.0.
Bottom-right panel: x-axis is Terrain Roughness Index. The curve shows a bell-shaped distribution, starting near 0, peaking at 0.95 around index 40, and returning to near 0 by index 80.
Forest Structural Integrity Index (FSII) had a strong unimodal association, with FSII values ranging from four to 11 most suitable for predicting eagle nest habitat (Table 1). Leaf Area Index (LAI) was the next strongest linear predictor, with LAI values ranging from 1.0 to 2.0, followed by a unimodal relationship with Terrain Roughness Index values peaking at 40, meaning eagle nest habitat was positively associated with medium density leaf canopy cover in areas of low to medium terrain complexity (Figure 2). Forest Structural Condition Index values had a clear linear association, with values peaking at 15, with Forest Landscape Integrity Index (FLII) values plateauing either side of zero, meaning eagle nest habitat had a positive linear relationship with areas of high forest structure (ß = 0.163), and a unimodal relationship with forest landscape integrity (Table 1; Figure 2).
The largest continuous areas of Philippine Eagle nest habitat across Mindanao were confined to mountainous regions with high forest cover across the eastern and central mountain ranges of Kitanglad, Pantaron, Diwata, and the Bukidnon plateau (Figure 3). Patchy areas of habitat were identified throughout western Mindanao, largely confined to areas of steep, forested terrain, and extending further south into the Tiruray Highlands and Mount Latian complex. Little habitat was predicted across the now largely deforested lowland plains. The Eastern Mindanao model was able to capture key areas of habitat when projected to eastern Mindanao (Figure 4). Most high nest habitat suitability for the Philippine Eagle was predicted within the boundaries of the Eastern Mindanao Biodiversity Corridor (EMBC), except for the central cluster (#4) where a small but significant area was predicted to be suitable nest habitat (Figure 4).
Range-wide Species Distribution Model for the Philippine Eagle on the island of Mindanao using a penalised logistic regression model algorithm. Map denotes habitat suitability prediction with green areas (values closer to 1) having highest habitat suitability, yellow/brown moderate suitability and white low suitability (values closer to zero). Dark grey border defines eastern Mindano region. Illustration by Bryce W. Robinson.

Figure 3. Long description
A geographical map plotted on a coordinate system with Latitude on the Y axis from 6 degrees North to 9 degrees North and Longitude on the X axis from 122 degrees East to 127 degrees East. At the top left is a scale bar for 0 to 100 k m.
The map shows the island of Mindanao with color-coded habitat suitability. High suitability green areas are most concentrated in the Northeast and East, specifically within the dark grey bordered eastern Mindanao region. Moderate suitability yellow and brown patches are scattered throughout the central and northern highlands. Low suitability white areas dominate the central valleys and coastal plains.
In the Southwest, the Zamboanga Peninsula shows a thin strip of high suitability along its western coast. An illustration of a Philippine Eagle is positioned in the lower-left quadrant over the Celebes Sea area. On the far right, a vertical color gradient legend ranges from 0 at the bottom in white to 1 at the top in vibrant green, with 0.5 marked in yellow.
Projected Species Distribution Model for the Philippine Eagle in eastern Mindanao using a penalised logistic regression model algorithm. Map denotes habitat suitability prediction with green areas (values closer to 1) having highest habitat suitability, yellow/brown moderate suitability and white low suitability (values closer to zero). Light grey polygons define Eastern Mindanao Biodiversity Corridor clusters with respective numbers defining each polygon cluster.

Figure 4. Long description
A geographical map plotted on a coordinate system with Latitude on the Y axis from 7 degrees North to 10 degrees North and Longitude on the X axis from 125 degrees East to 127 degrees East. A vertical color gradient scale on the right ranges from 0 white to 1 dark green. High suitability green areas are concentrated in the North and South, while moderate yellow and brown areas are scattered centrally. Six light grey polygons outlined in black represent the Eastern Mindanao Biodiversity Corridor clusters.
* Cluster 1 is at the northernmost tip, showing low to moderate suitability.
* Cluster 2 is directly South of cluster 1, containing a large concentration of high suitability green.
* Cluster 3 and Cluster 4 are in the central region, showing a mix of moderate yellow and low suitability white.
* Cluster 5 is on the eastern coast, showing high suitability green.
* Cluster 6 is in the South, containing a large, dense area of high suitability green.
A scale bar at the top right indicates 0 to 40 kilometers, and a compass rose featuring an eagle head icon is positioned in the top right corner.
Nest habitat hotspots
The reclassified discrete model for the entire eastern Mindanao region (Figure 5) calculated nest habitat area in the High quantile class (
$ \ge $
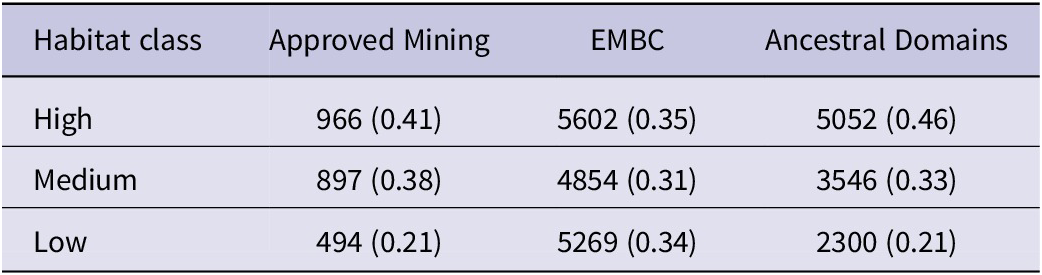
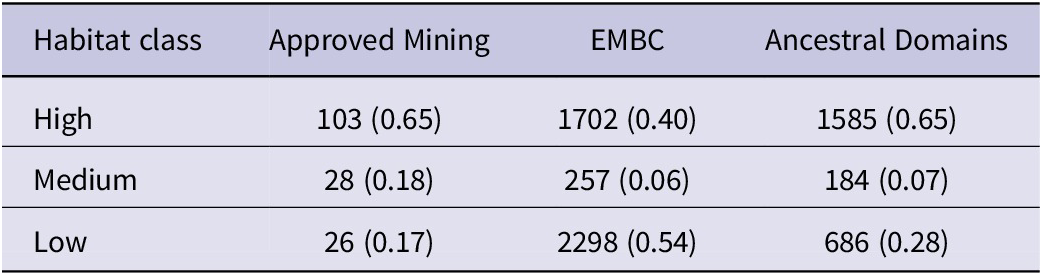
 0.653) totalling 7,791 km2, comprising 29.6% of the total landscape area of 26,259 km2, with 7,999 km2 in the Medium quantile class (30.5%) and 10,469 km2 in the Low quantile habitat class (39.9%). Core areas of High-class nest habitat across eastern Mindanao totalled 2,158 km2 of the total core landscape of 8,047 km2, comprising 26.8% of the total High core habitat area, with 475 km2 in the Medium class (5.9%) and 5,414 km2 in the Low habitat class (67.3%). A high proportion of both total (41%) and core (65%) High-class nest habitat was predicted to fall within approved mining concessions (Tables 2 & 3; Figure 5).
Projected discrete Species Distribution Model for the Philippine Eagle in eastern Mindanao overlaid with priority mining concessions designated for nest surveys (black polygons). Light grey polygons define Eastern Mindanao Biodiversity Corridor clusters with respective numbers defining each polygon cluster.

Figure 5. Long description
A geographical map with Latitude on the Y axis from 7 degrees North to 10 degrees North and Longitude on the X axis from 125 degrees East to 127 degrees East. The map displays a Species Distribution Model S D M color-coded by suitability: dark green for High, light green for Medium, and orange for Low.
Six numbered Eastern Mindanao Biodiversity Corridor clusters are outlined in light grey and distributed from North to South:
* Cluster 1 is at the northernmost tip.
* Cluster 2 is Southeast of cluster 1.
* Cluster 3 is South of cluster 2.
* Cluster 4 is Southwest of cluster 3.
* Cluster 5 is South of cluster 4.
* Cluster 6 is the southernmost large cluster.
Black polygons representing priority mining concessions are scattered throughout the suitability zones, with notable concentrations in the North near cluster 1, the center near cluster 4, and the South within cluster 6. High suitability dark green areas are primarily concentrated in the central-western and southern-central regions of the mapped area. A scale bar at the top right indicates approximately 0 to 40 kilometers.
Habitat class landscape metrics for Philippine Eagle nest habitat from the discrete model for eastern Mindanao. Values given are 1 km2 grid cells, with their respective proportions in parentheses.

Table 2. Long description
The table consists of four columns and four rows including the header. The columns are Habitat class, Approved Mining, E M B C, and Ancestral Domains. Data values represent 1 km super 2 grid cells followed by their proportions.
* Row 1 (Header): Habitat class, Approved Mining, E M B C, Ancestral Domains.
* Row 2 (High Habitat): Approved Mining has 966 (0.41), E M B C has 5602 (0.35), and Ancestral Domains has 5052 (0.46).
* Row 3 (Medium Habitat): Approved Mining has 897 (0.38), E M B C has 4854 (0.31), and Ancestral Domains has 3546 (0.33).
* Row 4 (Low Habitat): Approved Mining has 494 (0.21), E M B C has 5269 (0.34), and Ancestral Domains has 2300 (0.21).
Habitat class landscape metrics for Philippine Eagle core nest habitat from the discrete model for eastern Mindanao. Values given are 1-km2 grid cells, with their respective proportions in parentheses.

Table 3. Long description
The table consists of four columns and four rows. The columns are labeled Habitat class, Approved Mining, E M B C, and Ancestral Domains. The data rows categorize habitat quality as High, Medium, or Low, providing values in 1-km super 2 grid cells followed by their proportions.
* High Habitat Class: Approved Mining has 103 cells 0.65 proportion. E M B C has 1702 cells 0.40 proportion. Ancestral Domains has 1585 cells 0.65 proportion.
* Medium Habitat Class: Approved Mining has 28 cells 0.18 proportion. E M B C has 257 cells 0.06 proportion. Ancestral Domains has 184 cells 0.07 proportion.
* Low Habitat Class: Approved Mining has 26 cells 0.17 proportion. E M B C has 2298 cells 0.54 proportion. Ancestral Domains has 686 cells 0.28 proportion.
Priority conservation areas
Priority mining concessions where resource extraction will intersect with predicted High core nest habitat and should be paused for nest surveys to confirm presence were identified across all six EMBC clusters (Table 4) but with the majority in clusters #2 and #6 (Figure 5). For brevity and visual clarity, the largest mining concessions by area were identified which contain the highest amount of core High-class nest habitat as priority sites for nest surveys and conservation action (Figure 5). The EMBC protected area clusters covered 35% of total High-class nest habitat, followed by 31% and 34% coverage in the Medium and Low classes respectively (Table 2) but with core High-class habitat coverage greater (40%; Table 3). Ancestral domain coverage of both total (46%) and core (65%) High-class habitat was greater than within the EMBC (Tables 2 & 3; Figure 6).
Priority mining concessions in the Eastern Mindanao Biodiversity Corridor where resource extraction should be paused for nest surveys to be conducted to confirm presence of Philippine Eagles.

Table 4. Long description
The table contains four columns: Mining Concession number, Cluster number, Holder, and Commodity.
* E P – 000027-X I I I, Cluster 1, Apical Mining Corp., Gold.
* M P S A – 284 – 2009-X I I I S M R, Cluster 2, Kepha Mining Exploration Co., Nickel, Cobalt, Iron.
* M P S A – 007 – 92-X-S M R, Cluster 2, Suriago Integrated Resources Corp., Nickel.
* E P – 000030-X I I I, Cluster 2, S E M C O Exploration and Mining Corp., Gold.
* M P S A – 109 – 98-X I I I, Cluster 2, Consolodated Ores Philippines Inc., Gold.
* M P S A – 344 – 2010-X I I I, Cluster 3, Philex Gold Philippines Inc., Gold.
* M P S A – 299 – 2009-X I I I, Cluster 4, Philsaga Mining Corp., Gold.
* E P – 000003 – 2010-X I, Cluster 5, Boston Tribal M Purpose Corp., Gold, Silver.
* E P – 000001 – 2001-X I, Cluster 5, Agusan Petroleum and Mineral Corp., Gold, Silver, Copper.
* E P – 000002 – 09-X I, Cluster 6, Agusan Metals Corp., Gold, Silver.
* M P S A – 094 – 97-X I, Cluster 6, Alsons Devt and Investment Corp., Gold, Silver.
* M P S A – 336 A – 2010-X I, Cluster 6, Napnapan Mineral Resources Inc., Gold, Silver.
* M P S A – 320 – 2010-X I, Cluster 6, Oro East Mining Co. Inc., Gold, Silver.
* M P S A – 263 – 2008-X I, Cluster 6, Sinophil Mining and Trading Corp., Unknown.
* M P S A – 197 – 2004-X I-A M D, Cluster 6, Austral-Asia Link Mining Corp., Nickel.
Projected discrete Species Distribution Model for the Philippine Eagle in eastern Mindanao overlaid with indigenous ancestral domains (light grey polygons).

Figure 6. Long description
A geographical map with Latitude on the Y axis ranging from 7 degrees North to 10 degrees North and Longitude on the X axis from 125 degrees East to 127 degrees East. A scale bar at the top right indicates approximately 1 to 1,800,000, with markers for 0, 20, and 40 k m.
The map displays a discrete Species Distribution Model S D M for the Philippine Eagle across the eastern Mindanao landmass. The suitability is categorized into three colors: dark green for High, light green for Medium, and orange for Low.
* High suitability areas are concentrated in the central-western and southern-most mountainous regions.
* Medium suitability areas are widely distributed across the northern and central-eastern corridors.
* Low suitability areas form a buffer around the higher suitability zones, particularly in the central-interior and coastal fringes.
Overlaid across the landmass are numerous light grey polygons with thin black outlines representing indigenous ancestral domains. These polygons are most dense in the northern half of the region, between 9 degrees North and 10 degrees North, and in the southern-central region around 7.5 degrees North. Many of these domains directly overlap with areas identified as High and Medium habitat suitability.
Discussion
By employing a species distribution model in conjunction with spatial gap and hotspot analysis, we identified high-risk zones for a Critically Endangered raptor where mining concessions overlap with predicted nest habitat. Using integrated spatial analysis, we predicted how mining may affect key nesting areas across the species’ range in eastern Mindanao. Our findings indicate that several large mining concessions overlap with predicted high suitability eagle habitat, particularly in regions of high forest cover within ancestral domains. We provide a landscape-scale evidence base to support more informed land-use planning in a region where both biodiversity conservation and resource extraction are important considerations. Rather than implying uniform outcomes, our findings highlight where potential interactions between mining and eagle nest habitat are most likely to occur, allowing for more targeted assessment and management.
Habitat use
The predicted habitat suitability map indicates that the largest continuous areas of suitable habitat are concentrated in the Kitanglad, Pantaron, Diwata, and Bukidnon mountain ranges. These montane forests provide nesting and foraging resources, ensuring the ecological resilience necessary for the survival of the Philippine Eagle (Sutton et al. Reference Sutton, Ibañez, Salvador, Taraya, Opiso, Senarillos and McClure2024a). However, we recognise that pooling GPS fixes with nest sites could include locations outside breeding territories, which may reflect broader patterns of habitat use rather than specifically nesting habitat preferences. Nonetheless, we opted to include GPS fixes because in previous models pooling GPS fixes with nest site locations improved predictions (Sutton et al. Reference Sutton, Ibañez, Salvador, Taraya, Opiso, Senarillos and McClure2023a) and is biologically relevant due to the relatively small core home range of adult eagles reflecting nest site fidelity (Sutton et al. Reference Sutton, Ibañez, Salvador, Taraya, Opiso, Senarillos and McClure2024a). Despite the high habitat suitability of these regions, the threat of habitat fragmentation due to proposed mining operations remains a concern. Mining activities in the Philippines can accelerate forest loss, leading to potentially negative impacts on biodiversity (Posa et al. Reference Posa, Diesmos, Sodhi and Brooks2008; Sonter et al. Reference Sonter, Ali and Watson2018). For species like the Philippine Eagle, whose home ranges cover extensive forested landscapes, habitat fragmentation can limit dispersal, reduce gene flow, and increase the risk of local extinctions (Bacus et al. Reference Bacus, Gaite, Acaso, Cambronero, Ramos and Numeron2025; Valle et al. Reference Valle, Ibañez, Raghavan, Almeda and Miller2025). However, the extent of these effects is likely to depend on the scale, configuration, and management of mining activities. As such, distinguishing between areas where impacts can be avoided, minimised, or mitigated is an important next step.
Impact of mining on Philippine Eagle habitats
A significant proportion of predicted Philippine Eagle nest habitat (41% of total and 65% of core areas) falls within active or proposed mining concessions. This level of habitat encroachment is concerning given the species’ specialised breeding requirements and sensitivity to human disturbance. Mining operations can lead to direct habitat destruction through deforestation and introduce secondary threats such as increased human activity, noise pollution, and fragmentation of remaining forest patches (Laurance et al. Reference Laurance, Clements, Sloan, O’Connell, Mueller and Goosem2014; Sonter et al. Reference Sonter, Ali and Watson2018). These cumulative impacts are especially detrimental to large, territorial raptors like the Philippine Eagle, which require undisturbed forest canopies for nesting and hunting (Ibañez et al. Reference Ibañez, Sumaya, Tampos and Salvador2016a; Miranda et al. Reference Miranda, Salvador, Ibañez and Balaquit-Ibañez2000). However, we recognise that mining operations vary widely in their environmental footprint, depending on factors such as extraction methods, regulatory oversight, and the implementation of mitigation measures. Environmental impact assessments, biodiversity management plans, and site-specific safeguards can reduce potential impacts and, in some cases, contribute to improved ecological knowledge, for example through baseline surveys that identify previously unknown nesting sites.
Mining-induced fragmentation also increases the vulnerability of eagle populations to other anthropogenic threats, such as illegal hunting and human-wildlife conflict. For example, fragmented landscapes often facilitate easier access for subsistence hunters into eagle nest habitat, leading to an increased risk of illegal hunting (Gonzales et al. Reference Gonzales, Ibañez and Salvador2005; Ibañez et al. Reference Ibañez, Sumaya, Tampos and Salvador2016a). Additionally, the opening of forested areas for mining infrastructure creates new human-wildlife interfaces, increasing the likelihood of retaliatory killings when eagles prey on domestic animals (Paguntalan and Jakosalem Reference Paguntalan and Jakosalem2008). Previous work on the Harpy Eagle Harpia harpyja, another threatened tropical forest raptor, showed that habitat fragmentation and increased human encroachment can lead to a significant decline in reproductive success and increased nest abandonment rates (Miranda et al. Reference Miranda, Peres, Carvalho-Rocha, Miguel, Lormand and Huizinga2021). Conversely, mining can provide economic benefits to local communities, which may influence land-use dynamics in ways that are relevant to conservation outcomes, although these relationships remain context-dependent and warrant further study. The interaction between mining and other anthropogenic pressures also merits consideration. For example, increased access associated with infrastructure development may elevate risks such as hunting or disturbance in some contexts, while in others, improved livelihoods and governance may reduce these pressures. Understanding these coupled dynamics is important for designing effective, context-specific management responses.
The impact of mining is further exacerbated by its intersection with indigenous ancestral domains, which serve as crucial refugia for the Philippine Eagle. Indigenous communities play an important role in habitat protection, often acting forest guards and nest wardens, as the first line of defence against illegal logging and poaching (Panopio et al. Reference Panopio, Pajaro, Grande, Dela Torre, Raquino and Watts2021). However, the encroachment of mining into ancestral lands may threaten community-based conservation and exacerbate habitat loss. Our results show that 46% of high-suitability habitat and 65% of core nest habitat overlap with indigenous ancestral domains, underscoring the need for stronger partnerships between the mining industry, conservation organisations and indigenous communities to safeguard critical eagle habitats (Panopio et al. Reference Panopio, Pajaro, Grande, Dela Torre, Raquino and Watts2021). Co-management arrangements, participatory planning, and recognition of indigenous governance systems may help ensure that conservation interventions are both effective and socially equitable. Integrating indigenous knowledge with spatial modelling outputs could further refine conservation priorities and improve on-the-ground implementation.
Priority nest surveys and mining moratoriums
Our findings underscore the need for proactive conservation actions to mitigate the impact of mining on Philippine Eagle populations, and we propose that given the high spatial overlap between eagle habitats and mining concessions, systematic nest surveys should be conducted in those priority mining sites ahead of any resource extraction. These surveys will help identify critical nesting areas and inform land-use planning decisions. Nest surveys have proven effective in identifying sensitive eagle nesting sites and can provide early warning signs of population stress, such as reduced breeding success or territory abandonment (Abaño et al. Reference Abaño, Salvador and Ibañez2016; Ibañez et al. Reference Ibañez, Miranda, Balaquit-Ibañez, Afan and Kennedy2003). Similar nest monitoring programs have been implemented successfully for other threatened raptors, such as the Bonelli’s Eagle Aquila fasciata in Spain, where regular monitoring of nesting sites has informed conservation actions and reduced nest disturbance (Carrete et al. Reference Carrete, Sánchez-Zapata, Tella, Gil-Sánchez, Moleón and Bermejo2002).
In places where mining poses a potential threat to breeding eagle populations, temporary moratoriums on new mining concessions are recommended while surveys and conservation assessments are conducted. The identification of alternative resource extraction sites that minimise environmental impact should also be explored. Such moratoriums would provide a critical window of opportunity to assess the ecological impact of ongoing mining activities and evaluate the effectiveness of mitigation measures (Sonter et al. Reference Sonter, Ali and Watson2018; WWF 2015). Similar moratoriums have been successful in protecting biodiversity hotspots, such as in the Amazon basin, where restrictions on deforestation for mining have reduced habitat loss and carbon emissions (Finer et al. Reference Finer, Jenkins, Pimm, Keane and Ross2013). Further, once surveys have identified key nest habitats future work could include comparisons between how mining footprint size and expansion impact breeding productivity and assessing optimal buffer sizes to facilitate this.
Once active nesting sites are identified and delineated, we recommend that such “critical habitats” should be excluded and legally protected from any form of mining and other extractive resource uses. Philippine Eagles exhibit very high nest site fidelity – generations of breeding pairs use the same nest site repeatedly, which makes keeping nesting sites protected a key factor in the survival and conservation of the species (Ibañez Reference Ibañez2009, Ibañez et al. Reference Ibañez, Austin, Garnett, Hassan and L’Abbé2016b). Additionally, establishing buffer zones around known nesting sites can minimise disturbance from mining activities. These buffer zones should be incorporated into environmental impact assessments and enforced through mining regulations because buffer zones around key nesting areas can reduce disturbance and enhance reproductive success in sensitive raptor populations (Gonzales et al. Reference Gonzales, Ibañez and Salvador2005; Paguntalan and Jakosalem Reference Paguntalan and Jakosalem2008).
We caution however against any interpretation of the absence of Philippine Eagles in high-quality habitat to justify its destruction. Even if current surveys find such areas unoccupied, these habitats are important for the species’ long-term survival and potential recovery (Sutton et al. Reference Sutton, Ibañez, Salvador, Taraya, Opiso, Senarillos and McClure2023a). Limiting conservation efforts only to areas currently occupied risks confining the species to its present, often fragmented, distribution, preventing future recolonisation or range expansion. High-quality yet unoccupied habitats may serve as crucial dispersal corridors, future breeding grounds, or climate refugia. Recent field observations from Mindanao suggest that suitable nest habitat can transition rapidly from unoccupied to occupied, with the discovery of at least three new territorial pairs indicating recent establishment. This included two cases where the breeding females were previously tagged as immature birds that had only recently reached sexual maturity, and one case where notably relatively small nest characteristics were consistent with a newly built nest structure (Philippine Eagle Foundation, unpublished data). Thus, destroying habitat simply because it is temporarily unoccupied is short-sighted and incompatible with the goals of long-term species recovery.
Additionally, telemetry research provides direct evidence that non-territorial dispersing Philippine Eagles use and may temporarily occupy suitable habitats not held by territorial breeding pairs, further highlighting the conservation value of currently unoccupied but high-quality areas as dispersal routes and transient prospecting habitat. In Mindanao, satellite-tracked juveniles were documented moving through narrow riparian-forest corridors embedded within open, human-modified landscapes, demonstrating functional connectivity and ‘stepping stone’ habitat use rather than exclusive reliance on occupied core forest blocks (Abaño et al. Reference Abaño, Tampos, Taraya, Salvador and Ibañez2015). Consistent with this pattern, a single GPS-tracked female showed repeated use of non-nesting sites and riverine cover during long-distance movements, further supporting transient habitat use by dispersing non-breeders (Philippine Eagle Foundation, unpublished data).
Strengthening indigenous land management
Indigenous communities play a key role in protecting Philippine Eagle habitats through traditional ecological knowledge of known nest sites and community outreach (Salvador and Ibañez Reference Salvador and Ibañez2006; Ibañez et al. Reference Ibañez, Sumaya, Tampos and Salvador2016a). Conservation initiatives should build on that traditional ecological knowledge and support indigenous-led habitat monitoring and enforcement efforts. Co-management agreements between indigenous groups and government agencies can enhance habitat protection within ancestral lands (Panopio et al. Reference Panopio, Pajaro, Grande, Dela Torre, Raquino and Watts2021). Empowering indigenous communities to manage their ancestral domains not only safeguards eagle habitats but also promotes culturally sustainable conservation practices. Similar initiatives have been successful in protecting Amazonian forests, where indigenous lands have proven more effective in preventing deforestation than strictly protected areas (Nepstad et al. Reference Nepstad, Schwartzman, Bamberger, Santilli, Ray and Schlesinger2006).
Protected areas and indigenous land
Our spatial gap analysis revealed that the Eastern Mindanao Biodiversity Corridor (EMBC) contains 35% of total high-suitability habitat, particularly in regions where mining activities are most concentrated. Our findings suggest that the implementation of protected areas should be prioritised in regions within indigenous ancestral domains where conservation efforts can be built upon through legal recognition and support (Geldmann et al. Reference Geldmann, Barnes, Coad, Craigie, Hockings and Burgess2013; Rodrigues and Cazalis Reference Rodrigues and Cazalis2020). This can be achieved through the designation of new conservation zones and cooperation with indigenous-managed conservation areas within ancestral domains. Enforcing protected area policy within the EMBC and integrating them with indigenous ancestral domains through Indigenous and Community Conserved Area (ICCA) management or Other Effective Conservation Measure (OECM) modalities will ensure that critical eagle nesting habitats remain intact (Salvador and Ibañez Reference Salvador and Ibañez2006; Sutton et al. Reference Sutton, Ibañez, Salvador, Taraya, Opiso, Senarillos and McClure2023a).
Our predictive SDM provides a valuable tool for guiding future conservation planning for the Philippine Eagle on Mindanao. We advise that land-use policies should incorporate species distribution models to identify areas where mining activities should be restricted or modified to reduce their ecological impact and recognise that these model-led policy actions are already being implemented following previous SDM research (Sutton et al. Reference Sutton, Ibañez, Salvador, Taraya, Opiso, Senarillos and McClure2023a). By implementing targeted conservation actions, including habitat protection, nest monitoring, and community-based conservation initiatives, we can mitigate any negative effects of mining and ensure the long-term viability of the Philippine Eagle. Future research should focus on refining habitat models by (a) using nest locations as model validation data which may confirm whether broader movement patterns reinforce or dilute the patterns of nesting habitat selection, (b) through continued long-term monitoring of eagle populations, and (c) assessing the effectiveness of conservation interventions. Additionally, collaborations between the mining industry, conservation organisations, government agencies, and indigenous communities will be critical for achieving sustainable conservation outcomes for the Philippine Eagle and its habitat (Ibañez et al. Reference Ibañez, Sutton, Virani and McClure2025).
Supplementary material
The supplementary material for this article can be found at http://doi.org/10.1017/S0959270926100586.
Data accessibility statement
The raster and shapefile data that support the findings of this study are available on the data repository figshare https://doi.org/10.6084/m9.figshare.28911785. Due to confidentiality of nest locations for this Critically Endangered species we are unable to publicly share our occurrence dataset. We thank Antonio-Román Muñoz and an anonymous reviewer for comments that helped improve the text and the editors for handling the manuscript.
Acknowledgements
We thank all staff and volunteers from the Philippine Eagle Foundation who conducted fieldwork, including local forest guards, nest wardens and indigenous co-researchers, who contributed data to the GRIN information system. LJS thanks The Peregrine Fund’s Tom Cade Endowment and the Philippine Eagle Foundation for funding and CJWM thanks the M.J. Murdoch Charitable Trust for funding. The PEF would like to thank all of its local government units and Indigenous people’s partners, as well as the Department of Environment and Natural Resources through the Biodiversity Management Bureau and its regional and local offices on Mindanao (DENR Regions 9, 10, 11, 12, and 13). This study is also funded by the DENR-UNDP/GEF Biodiversity Corridor Project, with support from the Global Environment Facility (GEF) and implemented by the Department of Environment and Natural Resources (DENR) and the United Nations Development Programme (UNDP).
Author contribution
LJS conducted the analysis and led the writing with support from all other co-authors. Philippine Eagle Foundation staff provided all occurrence data.