1. Introduction
In developing countries, the dominant contributor to greenhouse gas emissions is land conversion, in particular the conversion of forest land to agricultural land use. Forests in developing countries, especially those having significant tracts of tropical forest, retain large volumes of carbon dioxide (CO2), ranging from 100 to 250 metric tons per hectare (Crutzen and Andreae, Reference Crutzen and Andreae1990; Naughton-Treves, Reference Naughton-Treves2004). Land clearing, through slash-and-burn farming or shifting cultivation, leads to a release of stored CO2 into the atmosphere.
The environment is significantly influenced by institutional factors such as a country's distributional profile (Koop and Tole, Reference Koop and Tole2001), institutional quality (Tamazian and Rao, Reference Tamazian and Rao2010), and type of political institutions (López and Galinato, Reference López and Galinato2005a; Bernauer and Koubi, Reference Bernauer and Koubi2009). Understanding how governance affects the environment has been a central focus in the literature (World Bank, 2002). The ability to govern is affected by corruption, which is the misuse of public office for private gain through practices such as lobbying or bribing to skew policies, and by political stability, which is the ability of policy makers to stay in office while implementing and continuing programs.
Corruption and political instability can reduce natural resources and diminish environmental quality. Corruption skews policies in favor of rent-seeking firms (Bulte and Damania, Reference Bulte and Damania2008) and reduces public expenditure, while political instability creates uncertainty which leads to less resource conservation (Deacon and Mueller, Reference Deacon and Mueller2004) and a reduction in resource stocks. Given the extent to which the rural economy is dependent on agriculture and forest land, the type of governance could have a significant effect on deforestation-induced CO2 emissions. We have not come across any study that focuses on the impact of political stability and corruption on CO2 emissions due to deforestation.
This article measures the short- and long-run effects of political stability, corruption control and economic growth on CO2 emissions due to deforestation. We present a conceptual model that links the effect of political stability, corruption control and economic growth on two direct factors of deforestation which lead to CO2 emissions. We estimate a model to test how political stability and corruption control affect the CO2 emissions–income curve given changes in forest cover. Our empirical analysis has important policy implications because this is the first study we are aware of that measures the immediate and long-term effects of corruption control and political stability on deforestation-induced CO2 emissions in developing countries.
The mechanisms relating income to industrial CO2 emissions differ from the mechanisms relating income to deforestation-induced CO2 emissions. Deforestation depends on direct factors that immediately contribute to the conversion of forest land to other land uses, such as agricultural land expansion and road building, as well as underlying factors that influence the severity of the direct factors such as economic growth, political institutions and trade openness (Barbier, Reference Barbier2004). Thus, there is a need to understand the relationship between income and governance on deforestation to derive the effect of income and governance on CO2 emissions due to changes in forest cover.
Reduced-form estimation using cross-country forest data from the Food and Agriculture Organization (FAO) have yielded a U-shaped relationship between income and forest cover (Cropper and Griffiths, Reference Cropper and Griffiths1994; Barbier and Burgess, Reference Barbier and Burgess1997). These studies have the advantage of deriving the net effect of income on forest cover but there are two important limitations. First, a reduced form estimation fails to control for the effect of omitted underlying factors. To the extent that these underlying factors are correlated with income, estimates of the effect of income on forest may be biased. Second, FAO forest data are derived through interpolations using a few actual data points which may also bias the effect of income if income is used in interpolation.
Microstudies use satellite imaging and GIS data to measure the effect of the direct factors on forest cover. An advantage of these types of studies is the strong quality of forest cover data and direct factors data but it is difficult to analyze the effect of underlying factors on forest cover given the nature of the dataset. López and Galinato (Reference López and Galinato2005a) overcome this problem by constructing a structural framework that estimates the effect of underlying factors on the direct factors of deforestation, and combining them with estimates from microstudies. However, they do not consider the effects of political stability and corruption control.
We hypothesize that under certain conditions, more political stability and less corruption will lead to more forest cover in the short and long run and, consequently, reduce CO2 emissions. Countries that are more politically stable are more likely to establish and enforce forest protection laws (Deacon, Reference Deacon1994) leading to less conversion of forest land to agricultural land and a decrease in net CO2 emissions. On the other hand, corruption increases the cost of infrastructure building (Kenny, Reference Kenny2006), ceteris paribus, which affects road building in the rural economy and can affect the set of technologies available for the farmer in the agricultural sector. Bridgman et al. (Reference Bridgman, Livshits and MacGee2007) and Bulte et al. (Reference Bulte, Damania and López2007) show how lobbying groups have an incentive to block the adoption of superior technology in order to maximize rents, thereby yielding inefficient modes of agricultural production. Thus, an increase in corruption control may increase available technology in the agricultural sector. If land use and technology are substitutes in production, corruption control could lead to the intensification of cultivating agricultural land which reduces the need to convert forest land to agricultural land, thereby avoiding release of CO2.
There are two studies to our knowledge that tried to integrate different measures of governance to understand the impact of income on forest cover. López and Galinato (Reference López and Galinato2005a) utilize a measure of polity which measures if a country is more democratic or dictatorial. They find that a more democratic country will have a higher turning point than a less democratic country, but the forest–income curve may or may not shift depending on country characteristics. Bhattarai and Hammig (Reference Bhattarai and Hammig2004) use a reduced form specification to measure the effect of an overall index of governance, capturing rule of law, bureaucratic quality and governmental corruption on deforestation rates. They find that improved governance fosters better management of forests resulting in a lower income turning point.
Our study differs from the previous studies because we account for the effect of two different governance variables – political stability and corruption control – in a structural framework instead of a reduced form formulation. Furthermore, we measure the short- and long-run effects of income and governance on forest land and CO2 emissions. Finally, we create a unique dataset that isolates the amount of agricultural land encroaching on forest land.
The rest of the article is organized as follows: section 2 presents the conceptual model; section 3 formulates the empirical model; section 4 describes the data; section 5 presents the regression results and CO2 emissions simulations; and section 6 concludes the study.
2. Conceptual model
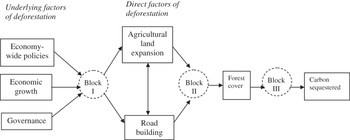
Figure 1 illustrates the conceptual foundation linking governance variables and economic growth to deforestation-induced CO2 emissions. We outline three blocks of causation and use different approaches to integrate each aspect into our empirical estimation.
Linking deforestation-related CO2 emissions to governance and economic growth.

In Block I, we compiled a new data set to empirically estimate the effect of economic growth and governance on the direct factors of deforestation. We focus on two key direct factors that contribute to the conversion of forest land: agricultural land expansion and road building.Footnote 1 There may be a bi-causal relationship between agricultural land clearing and road building because road construction in forest regions induces land clearing for agricultural purposes and agricultural expansion leads to increased lobbying to develop rural infrastructure such as roads. The decision to expand land for agricultural purposes or the decision to build roads is dependent on underlying factors such as economic growth (Koop and Tole, Reference Koop and Tole1999), political institutions (Nguyen Van and Azomahou, Reference Nguyen Van and Azomahou2007) and trade openness (López and Galinato, Reference López and Galinato2005b).
Political stability, corruption control and economic growth have different effects on agricultural land clearing and rural road building. Political stability is likely to reduce land clearing and increase rural road building if rural development projects and environmental protection policies continue across successive administrations (Galinato and Galinato, Reference Galinato and Galinato2010). The effect of corruption control on agricultural land clearing and rural road building will depend on the complementarity or substitutability of different inputs to technology in agricultural production. Corruption control increases the availability of technology to all users. If the available technology complements road and land use, then corruption control may lead to forest clearing and rural road building (Galinato and Galinato, Reference Galinato and Galinato2010). Economic growth directly increases agricultural land expansion, ceteris paribus, but has an ambiguous effect on rural road infrastructure. For example, unpaved roads may decrease as the economy grows because they are considered inferior goods.
In Block II, we use coefficient estimates from existing studies in the literature that measure the effect of agricultural land expansion and road building on forest cover. A number of recent microstudies that analyze the determinants of deforestation relied on data from satellite images, local surveys and remote sensing (Panayotou and Sungsuwan, Reference Panayotou, Sungsuwan, Brown and Pearce1994; López, Reference López1997, Reference López2000; Cropper et al., Reference Cropper, Puri and Griffith2001; Chomitz and Thomas, Reference Chomitz and Thomas2003). There is a consistent negative effect of expansion of agricultural land and road building on forest cover.
In Block III, we simulate the effect of a change in forest cover on CO2 emissions. Any reduction in forest cover leads to a release of CO2 while continuing to keep forests intact leads to CO2 sequestration. It must be noted that we only focus on changes in forest cover as our source of CO2 flow. Agricultural production and different cultivation practices may also lead to CO2 emissions or sequestration (Dale and Polasky, Reference Dale and Polasky2007). We do not consider these other sources of CO2 emissions.
We combine our estimates from Block I, parameter estimates gathered from the literature from Block II along with the simulated estimates in Block III to arrive at the total effect of economic growth and governance on deforestation-induced CO2 emissions.
3. Empirical model
We start by postulating the impact of the underlying factors on two direct factors of deforestation from Block I,
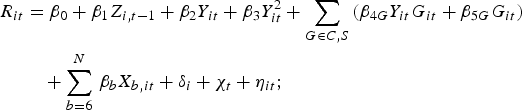
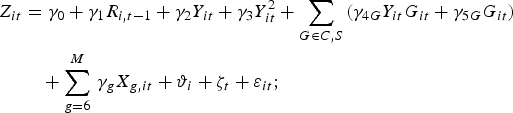
where subscripts i and t represent country and time, respectively and β and γ are parameters; R it is the log of the length of road networks in the rural sector; Z it is the log forest land cleared for agricultural purposes; Y it is log of gross domestic product per capita; the two governance variables G it are C it, which is log corruption control and S it, which is log political stability;ϑ i and δ i are country effects which can be fixed or random, ζ t and χ t are time effects common to all countries; and ɛit and η it are random disturbance. X b and X g are other variables associated with parameters β b and γ g, respectively.
We categorize five factors affecting roads and agricultural land clearing: (1) income per capita; (2) measures of governance captured by political stability and corruption control; (3) macroeconomic policies; (4) unmeasured country-specific factors; and (5) global economic conditions affecting all countries in a given time period. Because we are interested in examining if there exists a reasonable turning point on income per capita in relation to deforestation-induced CO2 emissions, we specify income per capita squared in our model. Political stability and corruption control affect our CO2–income relationship by influencing the income turning point and the CO2 emissions level.
Macroeconomic policies include trade policies, foreign direct investment and other country characteristics that change over time. Unmeasured country-specific factors are structural characteristics that change little, if at all, over time, such as climate, geographical conditions and factor endowments. We use fixed or random effects to capture these variables. Lastly, global economic conditions are international shocks that are likely to affect all countries at the same time. We use time dummies to capture this effect.
The expansion of agricultural crop production into forested areas may not immediately induce an increase in the rural road network and rural road building may not immediately lead to agricultural land expansion. For this reason, agricultural expansion is lagged in equation (1) and road networks are lagged in equation (2).
From Block II, we specify the impact of the direct factors on forest cover,

where F is the log of forest area, μ is a random disturbance term and the coefficients b and c are the elasticities of road networks and agricultural land area on forest cover, respectively. We do not estimate equation (3); instead we use estimates from microstudies to proxy for b and c.
In Block III, CO2 emissions attributed to a change in an underlying factor, E X, are dependent on the change in forest cover and are specified as
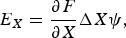
where X is a particular underlying factor and ψ is a conversion coefficient that estimates the amount of CO2 sequestered or emitted from a change in forest area. We simulate CO2 emissions levels using (4) given estimates from equations (1)–(3).
Naughton-Treves (Reference Naughton-Treves2004) uses the following conversion coefficient formula, ψ = λ · θ · ρ, where λ is aboveground live biomass of forest megagrams per hectare (Mg/ha); θ is the CO2 fraction of dry biomass; and ρ is the burning efficiency of forest clearance, which refers to the percentage of heat content in the wood that can be extracted and used. Naughton-Treves (Reference Naughton-Treves2004) uses different parameters for primary and secondary forests. For mature forests, θ is 0.5 and λ is 407 Mg/ha. The estimated value of ρ is 0.4 if reburning of primary forests occurs (Crutzen and Andreae, Reference Crutzen and Andreae1990). For fallow or secondary forests, ρ is 0.6 but θ is still 0.5. The biomass, λ, from fallow forest is equal to the average accumulation of aboveground biomass multiplied by the fallow period. Naughton-Treves (Reference Naughton-Treves2004) assumes that biomass fallow is 11.5 Mg C/(ha year) and the average fallow period is 3.2 years.
There are two important items to note linking the effect of an underlying factor on deforestation-induced CO2 emissions. First, the level effects of the underlying factors may have an impact on forest cover but not CO2 emissions. If there are no changes in the factor, there will be no changes in forest level, all else being constant; therefore there will be no CO2 emissions. Only a change in the factor can induce CO2 emissions. Second, it is difficult to compare the short- and long-run effects of underlying factors given the interaction of road building and agricultural land clearing.
Equations (1)–(4) define the system of equations that solve for the effect of income, political stability and corruption control on deforestation-induced CO2 emissions. The subsequent equations show how income and governance affect forest cover.
3.1. The effect of income and governance on forest cover
The total effect of income on forest cover due to agricultural land expansion and road building is
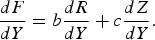
The short-run effect of income on roads and agricultural land clearing areFootnote 2


Using (6) and (7) into (5), we derive the total short-run effect of income per capita on forest cover. In the long run, the effect of any variable at time t is the same as time t – 1. By simultaneously solving for the effect of Y in (1) and (2), we obtain the long-run equation linking income to the direct factors of deforestation,


Using (8) and (9) into (5), we derive the long-run effect of income on forest cover.
We hypothesize that the forest–income curve is a U-shaped relationship where initial increases in income result in a decrease in forest cover. It may reach a turning point, or per capita income level where the slope of the forest–income relationship is zero, and any income level beyond it will yield an increase in forest cover. A U-shaped relationship forest–income curve exists if the derivative of (5) with respect to income is positive.
The short-run turning point is derived by substituting (6) and (7) into (5) and equating to zero to solve for Y. A similar procedure is conducted to derive the long-run turning points but now (8) and (9) are substituted into (5). The short-run and long-run turning points, Y srt and Y lrt respectively, are expressed as


The main difference in the short and long run is the potential for road building and agricultural land clearing to affect each other in the latter but not in the former. If road networks and agricultural land demand are complements, the long-run turning point is likely to be larger than the short-run turning point, all other variables being constant. However, if income reduces road infrastructure in the rural areas because of rural–urban migration or has a negative effect on agricultural land demand then it is difficult a priori to compare the short-run and the long-run effects of income on forest cover.
Corruption control and political stability may affect the steepness of the forest–income curve as well as the turning point. If improvements in both governance variables induce economic growth, the turning point may be lower. Corruption control and political stability may also have an indirect effect on the level of forest cover through road building and agricultural land expansion. The short-run effect of the governance variables are derived by taking the derivative of (3) with respect to C and S,


The long-run level effects are derived by simultaneously solving for the effect of C and S in (1) and (2) when t = t – 1 and substituting the results into (3),


It is not clear a priori if the short-run effect is larger or smaller than the long-run effect since it will depend on the relationship between road building and agricultural land clearing as well as the indirect effects of the governance variables through income.
3.2. Hypotheses
From our empirical model, the following hypotheses are formulated and tested:
(1) Countries with more political stability and less corruption will have higher forest levels in the short and long run. This implies testing if equations (12) to (15) are positive.
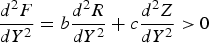
(2) The forest–income relationship is U-shaped in the long run and short run. For this to hold, the second derivative of income on forest cover must be positive, i.e.,
 .
(3) The turning point is lower in more politically stable and less corrupt countries in the long run and short run. To test this hypothesis, we examine if the partial derivatives of equations (10) and (11) with respect to corruption control and political stability are negative.
 .
4. Data description
The set of countries in our sample were selected based on the methodology of López et al. (Reference López, Maggiora and Galinato2002) where developing countries with significant absolute and relative forest cover are identified. Furthermore, we focused only on countries where there is a prevalence of agricultural crop encroachment on forest land. There is consistent evidence of tropical deforestation in Latin America due to agriculture and pasture conversion practices (Houghton et al., Reference Houghton, Leftwowitz and Skole1991), while shifting cultivation is widespread in Asia, especially in Southeast Asian countries (Rerkasem et al., Reference Rerkasem, Yimyam and Rerkasem2009). Deforestation in African countries is mainly driven by the collection and consumption of fuelwood (Ribot, Reference Ribot1999), while land clearing for urban developments was the main driver for developed countries and developing countries in Europe (EEA, 2006). Since our conceptual framework focuses on the impact of underlying factors on CO2-based forest cover change through agricultural land use, we exclude African countries, developed countries and developing countries in Europe in our sample. Thus, we have 22 countries in our sample, all from Latin America and Asia.
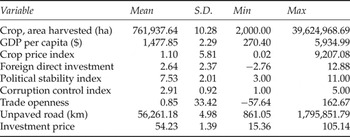
Table 1 shows the descriptive statistics from our sample, covering the periods 1990–2003. The key variables in our study are agricultural cropland and roads encroaching on forest cover and two governance indices: political stability and corruption control. We calculated our own measure of cropland expansion by identifying crops encroaching on forested areas for each country in our sample. Crops are selected based on available reports and studies regarding the country's food/cash crops and forest resources.Footnote 3 We classify a crop as encroaching on forest land only if a study or report specifically identifies it as such. We add the total amount of harvested land area for each crop using data from FAOSTAT in each country. The total amount of cropland that encroaches on forest cover is used as a measure of agricultural expansion in forest land. By creating this variable instead of using aggregate cropland area, we are able to avoid overestimating the effect of governance on cropland area encroaching on forest regions.Footnote 4 We used unpaved road length in kilometers from the World Development Indicators because it is a common type of rural infrastructure that connects agricultural and forest land.
Summary statistics of variables

We obtained data from the International Country Risk Guide for the political stability and corruption control indices. Political stability assesses the government's ability to implement its programs and to stay in office. Scores range from 0 to 12 where a score of zero equates to low political stability. The corruption control index measures corruption within the political system. It captures: financial corruption such as bribes for police protection, tax assessments, export/import licenses or loans; and insidious forms of corruption such as nepotism, job reservations, favor-for-favors and secret party funding. The score of the corruption index ranges between 0 and 6, where zero means low corruption control. The appendix presents the definitions and data sources of all variables in the study.
We compiled unbalanced panel data for 22 countries from 1990 to 2003. In the following section we present Two Way Fixed Effects (TWFE), Random Effects (RE), Hausman Taylor Random Effects (HTRE) and Generalized Method of Moments (GMM) estimations that all account for unobserved time invariant variables.
5. Results
We present the regressions showing the effect of governance on cropland expansion and unpaved road development into forest areas. Next, we combine the estimates of our regressions with coefficients from studies that measure the effect of direct factors on forest cover. Lastly, we simulate the CO2 emissions given changes in forest cover.
5.1. Underlying factors and direct factors of deforestation
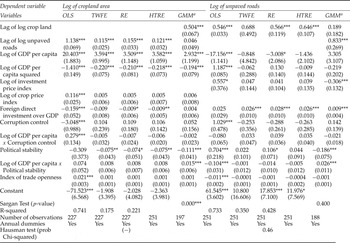
Table 2 summarizes the effects of the underlying factors on road building and agricultural crop expansion. Per capita income significantly increases agricultural land clearing at a decreasing rate. On the other hand, per capita income has a negative impact on unpaved road construction, albeit not as significant as agricultural land clearing. The negative effect indicates that unpaved road construction is an inferior infrastructure commodity.
Determinants of cropland area and unpaved roads in developing countries

Notes***5%, **10%, *15% levels of significance.
a Windmeijer finite-sample corrected standard errors in brackets. Instruments are collapsed which implies creating one instrument for each variable and lag distance only.
Political stability has a negative and significant effect on agricultural land clearing which is consistent with our discussion where political stability may lead to more programs that protect natural resources. Political stability has a positive effect on road building which is also consistent with the idea that more stable governments can establish more public projects. Corruption control does not seem to have any direct significant effect on either of our direct factors of deforestation. However, a joint test on our corruption control variable and corruption control and income per capita interaction variable shows that they are jointly positive and significant in affecting agricultural land clearing.
We chose the TWFE estimates for the cropland regression and RE estimates for the road regressions as our base estimates in calculating the total effect of political stability, corruption control and income on deforestation-induced CO2 emissions. These estimates are not significantly affected by the correlation of errors with the variables of interest nor are they afflicted by weak instrument problems.
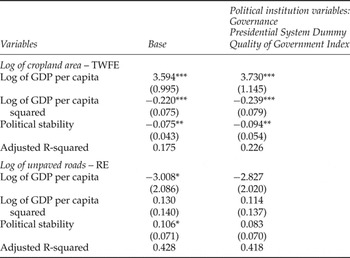
Omitted time varying variables could bias the coefficients of the variables of interest. We employ a procedure developed by Altonji et al. (Reference Altonji, Elder and Taber2005) to test for the significance of the effect of omitted time varying variables. They show that if adding control variables that are highly correlated with an omitted time varying variable do not significantly change the sign and significance of the variables of interest when the goodness of fit improves, then it is unlikely that time varying omitted variables affect the estimates. Also, if the goodness of fit decreases when adding the control variables, then omitted time varying variables do not significantly affect our estimates.
Rural development programs that influence agricultural development and rural road building may be an important omitted time varying variable. Types of political institutions may be highly correlated with rural development programs. We add variables that capture the type of political institutions as added control variables in our estimation and compare the change in the coefficient estimates of political stability and income per capita in table 3. Adding the set of variables that proxy for political institutions raises the adjusted R2 in the TWFE model for cropland but does not affect the sign and significance in the variables of interest. On the other hand, the adjusted R2 decreases relative to the base level in the RE estimates for roads. Thus, even though there may be omitted time varying variables such as rural development programs, they are not likely to significantly affect our estimates.
Robustness checks for GDP per capita and political stability coefficient estimates

Note:***5%, **10%, *15% levels of significance.
5.2. The total effect of underlying factors on forest cover
In order to determine the total effect of underlying factors such as income on forest cover, we estimate equation (5) by obtaining measures for parameters b and c. We use parameter estimates from microstudies that use individual country survey statistics, remote sensing or GIS data to analyze the effect of direct factors on deforestation. There are only a few microstudies that have derived the long-run and short-run effects of forest-competing crop area and roads that are most compatible with our estimates based on methodological estimation and availability of descriptive statistics.
The short- and long-run effects of crop area on forest cover were taken from two studies. López (Reference López2000) finds that a 1 ha increase in area cultivated results in a 4.4 ha decrease in forest cover in rural villages in Western Ivory Coast, which implies a short-run elasticity of –0.27 and a standard error of 0.02. Maertens et al. (Reference Maertens, Zeller and Birner2006) estimates a 1 ha increase in the area of shifting cultivation in Indonesia from 1980 to 2001 that yielded a decrease in forest cover by 0.88 ha, which implies a long-run elasticity of –0.05 and a standard error of 0.01. Panayotou and Sungsuwan (Reference Panayotou, Sungsuwan, Brown and Pearce1994) find that a 1 km increase in road networks decreases forest cover by 0.27 km2, which implies an elasticity of –0.02 and a standard error of 0.01. Unfortunately, we were not able to find any studies that estimated the long-run effects of road networks on forest cover, so we assume that the short- and long-run effects of road building are the same in our calculation.
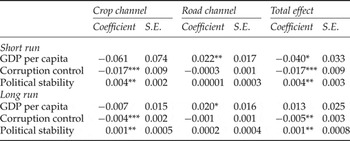
The elasticity of income on forest cover is derived using equations (5), (6) and (7) in the short run and (5), (8) and (9) in the long run where the parameters b and c are taken from our selected microstudies and the parameter estimates from TWFE and RE from the cropland and road regressions are used, respectively. Table 4 summarizes the total effects of income per capita and our two measures of governance on forest cover are evaluated at the mean levels. The short-run effect of income per capita on forest cover is negative and significant. Income per capita decreases forest cover through increased agricultural crop expansion but has a tendency to increase forest cover by reducing unpaved road construction where the former effect outweighs the latter effect. We do not find any significant effect of per capita GDP on forest cover in the long run.
Total effect of GDP per capita and governance on forest cover

Note***5%, **10%, *15% levels of significance. S.E., standard error.
The average economic growth in Latin America over our sample countries is 1.61 per cent, while it is 3.27 per cent in Asia. This growth would lead to a decrease in forest cover of about 0.06 and 0.13 per cent in Latin America and Asia, respectively, in the short run. The actual rates of deforestation in Latin America and Asia are higher at 0.6 and 0.7 per cent, respectively. Thus, income growth explains less than a quarter of deforestation. The combined impact of other policies such as governance, trade and foreign direct investment may explain other sources of deforestation.
We calculate the effect of corruption control and political stability on forest cover using a similar methodology. We find the impact of corruption control on forest cover is negative and significant in the short and the long run. Although corruption control has an insignificant effect on road building, it has a significant negative effect on forest cover because it induces an increase in agricultural land clearing. One explanation is that more corruption control could induce technological innovation and, if technology and land are complements in production, it could lead to more land clearing for agricultural purposes. In contrast, political stability increases forest cover in the short and long run because it induces a reduction in agricultural land clearing. Interestingly, there is a significant lingering effect in the long run in both of our measures of governance on forest cover but the magnitude is smaller. This result highlights the potential structural impacts of governance on natural capital. Our results partially verify hypothesis 1. We do find that more politically stable countries have higher levels of forest cover but countries with higher levels of corruption control have lower forest cover, all else constant.
We simulate the effect of corruption control and political stability for Brazil and Indonesia, the countries with the most tropical forest cover. If the corruption control level of Brazil and Indonesia improved to the same stringency as Costa Rica, the country with the highest measure of corruption control in our sample, we estimate a 0.7 and 2.2 per cent decrease in forest cover from agricultural land expansion in the short run, respectively. If Brazil and Indonesia improved political stability to similar levels to those in China, the most politically stable country in our sample, we estimate an increase in forest cover by 0.3 and 0.2 per cent, respectively, in the short run.
5.3. Turning point in the forest–income curve
The income turning point we derive in the short run is approximately $2,600, a value significantly lower than those calculated in other studies such as Cropper and Griffiths (Reference Cropper and Griffiths1994) since not all direct factors of deforestation are captured in our estimation. The long-run turning point is significantly lower than the short-run turning point at $1,200. The take away point is not the absolute magnitudes of the turning points themselves but the potential for lowering the turning point in the long run given the interaction of agricultural land clearing and unpaved road construction.
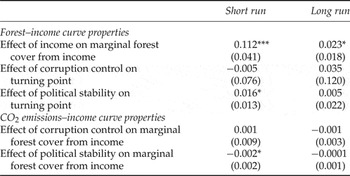
Table 5 summarizes the tests on the forest–income and CO2 emissions–income curves. Hypothesis 2, which tests if a U-shaped forest–income curve exists, is verified since we show that ∂ 2F/∂ Y 2 is positive and significant. The effect is more significant and positive in the short run than the long run which implies that there is a larger confidence interval for the income turning point in the long run.
Tests on forest–income curve and CO2 emissions–income curve properties

Note: ***5%, **10%, *15% levels of significance.
Hypothesis 3 regarding a lower turning point for politically stable and less corrupt countries is not statistically verified. We find a weak significant but positive effect of political stability on the turning point in the short run. Economic growth may complement the effect of political stability by increasing agricultural land expansion leading to a higher turning point.
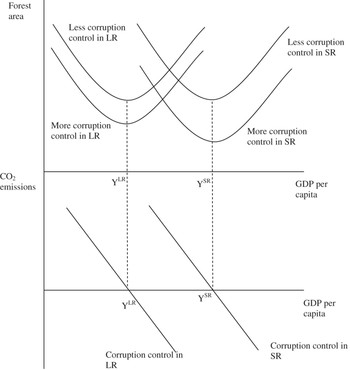
The results from our hypothesis tests imply that we can derive forest–income curves in the short and long run as illustrated in the top panel of figures 2 and 3. In the short run, when there is more corruption control, the forest–income curve shifts down but the turning point does not change. As we move to the long run, the turning point is now lower and more corruption control again leads to a lower forest–income curve.
Effect of corruption control on forest cover-income curve and CO2 emissions-income curve in the short run (SR) and long run (LR).

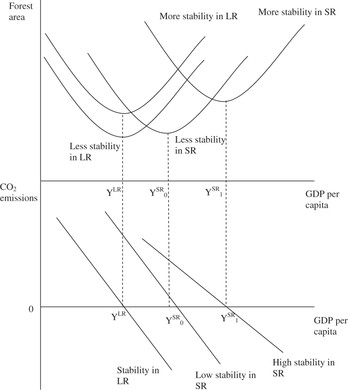
Effect of political stability on forest-income curve and CO2 emissions-income curve in the short run (SR) and long run (LR).

The effect of political stability on the forest–income curve is more complicated. In the short run, as countries become more politically stable, the forest–income curve shifts up and to the right, signifying an increase in forest cover, and a higher income turning point. In the long run, the turning point is lower and the forest–income curve shifts up as countries are more politically stable.
5.4. CO2 emissions and governance
Unlike industrial CO2 emissions, deforestation-induced CO2 emissions only occur if there are changes in underlying variables as shown in equation (4). Thus, for income per capita to have any effect on deforestation-induced CO2 emissions, the country would need to be growing or contracting over time. If we have a U-shaped forest–income curve, the corresponding CO2 emissions–income curve would be downward sloping and crosses the income-axis at the turning point. Any point to the left of the turning point implies that there are CO2 emissions, and to the right of the turning point CO2 is sequestered because of an increase in forest cover.
If a governance variable decreases the slope of the forest–income curve, then CO2 emissions are less responsive to income changes. We find that corruption control does not have any significant effect on the slope of the forest–income curve in the short run or long run. Thus, the effect of corruption control on the CO2 emissions–income curve is illustrated as such in the bottom panel of figure 2.
Political stability has a more complicated effect. More political stability decreases the marginal effect of income on forest cover in the short run leading to a flatter slope of the forest–income curve. This implies that the CO2 emissions levels will be lower for countries with more political stability given the same level of income. Also, since the turning point increases with more political stability, the CO2 emissions–income curve shifts to the right. In the long run, the same curve shifts to the left because of a decrease in the income turning point.
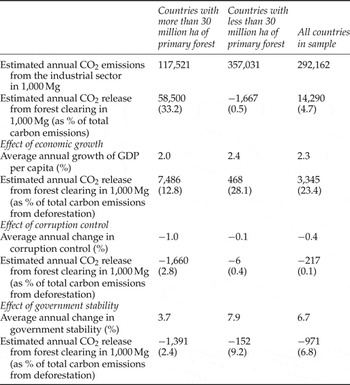
We simulate the effect of CO2 emissions caused by deforestation in the 1990s using equation (4) and summarize the results in table 6. Across all countries in our sample, CO2 emissions from deforestation explain about 4.7 per cent of total CO2 emissions. We break down the sample into two: countries that have more than 30 million ha of primary forest and those that have less than 30 million ha. Countries that have at least 30 million ha of primary forest release about 33 per cent of their CO2 emissions from deforestation. Thus, forest clearing explains a significant share of total CO2 emissions in countries that have large remaining primary forests. For countries that have less than 30 million ha of primary forest, we find a net uptake instead of a release in CO2. Among the countries in this subset, China has seen a decrease in primary forest cover but it has been compensated for by a significant increase in secondary forest from 1990 to 2000 leading to a net CO2 uptake. If we leave China out of the sample, we find a decrease of 1,000 ha of forest cover which implies that deforestation accounts for 2 per cent of total CO2 emissions for the remaining countries in the sample.
Estimated annual CO2 emissions due to growth in GDP per capita, corruption control and government stability

Note: Short-run parameter estimates are used in the simulations.
Economic growth explains 23 per cent or approximately 3.3 million Mg per annum of deforestation-induced CO2 emissions. For countries that have more than 30 million ha of primary forest and those that have less than 30 million ha, economic growth explains 13 and 28 per cent of deforestation-induced CO2 emissions, respectively. This implies that the net effect of all non-growth factors is to exacerbate deforestation and related CO2 emissions.
The average corruption control levels have decreased for countries in our sample. The largest decreases came from countries with more than 30 million ha of primary forest. We find CO2 uptake because decreased corruption control has a positive effect on forest cover. Corruption control accounts for 0.1 per cent of deforestation-induced CO2 emissions.
Political stability has increased for countries in our sample. More stable governments preserve more forest cover and, therefore, increase CO2 uptake. There is a larger amount of variation explained by political stability compared to corruption control because it accounts for 7 per cent of deforestation-induced CO2 emissions.
6. Conclusion
The main objective of this article is to determine the short- and long-run effects of income per capita, political stability and corruption control on the forest–income relationship and the corresponding CO2 emissions–income curve. Income per capita has a negative and significant impact on forest cover in the short run but does not have any lingering effects in the long run. In contrast, we do find that more politically stable countries have higher levels of forest cover but countries with higher levels of corruption control do not have higher forest cover. The effects of both governance variables are persistent since their effects continue in the long run albeit at a smaller magnitude.
A U-shaped forest–income curve exists. Political stability and corruption control do not lower the turning point. The resulting deforestation-induced CO2 emissions–income curve is downward sloping and is based on changes in income per capita affecting forest cover. More political stability flattens the CO2 emissions–income curve in the short run leading to less responsive CO2 emissions given changes in income.
One limitation of our current model is that we focus only on two direct causes of deforestation: cropland expansion and road building. We do not include other potential channels of deforestation such as logging and rural poverty. A future study may want to examine the total effects of including other potential channels and verify how the income and governance effects may differ through these channels. If the effect of income and the governance variables on other direct factors are in the same direction as cropland expansion and road building, we are likely to see a more pronounced U-shaped forest–income curve with a higher turning point. On the other hand, the net effects may be more difficult to hypothesize if there are countervailing effects across different direct channels.
Appendix. Definition and sources of variables used in the study

a Food and Agriculture Organization of the United Nations (FAO) (2009), FAOSTAT – Production (Crops) and Prices (PriceSTAT) databases, [Available at] http://faostat.fao.org/.
b World Bank (2009), World Development Indicators, Washington, DC.
c PRS Group, Inc (2009), International Country Risk Guide, [Available at] http://www.prsgroup.com/ICRG.aspx.
d Center for International Comparisons of Production, Income and Prices (CIC) (2006), Penn World Tables 6.3, [Available at] http://pwt.econ.upenn.edu/php_site/pwt63/pwt63_form.php.