1. INTRODUCTION
1.1. Integrated design
“Design consists of many interdependent decisions” (Lewis et al., Reference Lewis, Chen and Schmidt2007). These decisions are complex; each has associated goals, constraints, alternatives, and analyses. Project complexity motivates the division of large decisions into smaller ones, but project value often lies at the intersections of these separate and specialized knowledge disciplines (Rechtin, Reference Rechtin1991). Architecture, engineering, and construction (AEC) design teams struggle with this tension between specialization and integration.
Integrated AEC design is becoming more complicated because of an increase in the number of options, objectives, and ways that these elements impact each other. Every day, new building technologies enter the marketplace. Because of interactions, arithmetically increasing numbers of options creates geometrically increasing numbers of potential holistic alternatives. Furthermore, this enlarging set of possible alternatives has impacts for new and more quantitative and qualitative project goals and constraints. The collection of these objectives is often represented by the ecology–economy–equity trilogy of goals used to represent integrated building performance (i.e., McDonough & Braungart, Reference McDonough and Braungart1998). For example, during feasibility design of the Green Dorm at Stanford University, stakeholders identified 30 objectives relating to environmental impact, research potential, cost, human comfort, sociability, and privacy (EHDD Architects, 2006). Design teams must somehow equitably and efficiently evaluate all increasing numbers of potential alternatives based on these new and varied objectives.
Hawken et al. (Reference Hawken, Lovins and Lovins1999) describe the concept of “tunneling through the cost barrier,” providing a notable example of how project value can be found in the interactions of options and objectives. They describe the scenario of a design team trying to decide which energy efficiency improvements to make on a conventional house. In traditional practice, designers would weigh the cost of any improvement against the money saved by not having to pay for the extra energy, with successive additions resulting in fewer energy savings until the cost of installation outweighed the lifetime energy cost savings (Fig. 1). In this traditional process of value engineering, the interdependencies of options and objectives are ignored, and the cost of green improvements quickly outweighs their monetary benefit.
A diagram of the concept of “tunneling through the cost barrier,” based on Hawken et al. (Reference Hawken, Lovins and Lovins1999).

The concept of tunneling through the cost barrier recommends proceeding differently, analyzing the consequences of making all the improvements simultaneously. They find doing so decreases the energy load of the house to a level that can be managed with much smaller heating and cooling equipment, or even without equipment at all. This savings in initial capital (as opposed to just in lifetime energy costs) far outweighs even the costs of all the improvements together, and as a result, achieves positive gains in both cost and energy use (Fig. 1). Successfully sorting through many new technologies and the addition of a new objective (energy use) eventually lead to a more holistic and higher value solution.
In essence, Hawken et al. (Reference Hawken, Lovins and Lovins1999) succeed in finding a more energy-efficient and cost-effective design, because they note interactions between technologies (places where the value of a combination of options is greater than the sum of the individual parts) that have positive consequences for project objectives (cost and energy). Such success should encourage the construction of a method that can systematically document these interactions and generate high-performing alternatives. However, two obstacles to such a method currently exist. First, although rare experts such as Amory Lovins (author of the chapter in Hawken et al., Reference Hawken, Lovins and Lovins1999) himself may have the knowledge to analyze a building as an entire system, in traditional AEC practice, the responsibility for different decisions (e.g., windows and insulation) often fall to different people who lack the knowledge base of the other. It is entirely conceivable that without explicit frameworks for doing so, they may not communicate about the potential for positive interactions between options in their separate disciplines. Second, although Lovins is able to tunnel through a cost barrier by identifying positive interactions in energy savings, goals for modern buildings are much broader than these alone; further barriers through which to tunnel may exist.
Project management theory recommends exploring this complexity as early in the design process as possible (Barrie & Paulson, Reference Barrie and Paulson1992) to increase knowledge of interdependencies and develop better alternatives before the potential for such integrated solutions is removed (Simpson et al., Reference Simpson, Rosen, Allen and Mistree1998). Communicating about sets of options early in design can prevent the constraining of a design team's thinking to one particular solution (Sobek & Ward, Reference Sobek and Ward1996). At the beginning of a design process, however, design teams are faced with a theoretically infinite number of potentials alternatives. Thus, they need a method to rationally explore this large space in search of a smaller and more addressable number of alternatives for further investigation. At these early stages of design, there exists much uncertainty about precise performance data, making exploration of project value for increasing numbers of options extremely difficult. Design teams do not have the time or the resources needed to resolve this uncertainty, and thus they require flexible conceptual tools for input and inquiry.
Theorists such as Krishnamurti (Reference Krishnamurti2006) and industry laboratories like the Jet Propulsion Laboratory (Girerd, Reference Girerd2005) have defined a large “solution space” containing all possible candidate solutions and a smaller “tradespace” of feasible and valuable candidate solutions to be investigated further. With these definitions, we can formally define our observed problem:
Currently, AEC projects lack an explicit, multidisciplinary conceptual design method to explicitly and flexibly define, manage, and narrow a multidecision, multiobjective solution space to a feasible and valuable trade space-through analysis of interactions.
As a result, design teams tend to select only a few candidate alternatives from a very large number possible without a way of ensuring confidence in the alternatives they have chosen to explore or a clear rationale to justify their decisions. To address this challenge, this paper formulates a conceptual design method. Section 2 further defines motivating case studies using the framing of our observed problem. Section 3 establishes our theoretical framework of requirements and metrics for conceptual design systems. Section 4 reviews several existing design management systems with respect to the requirements. Section 5 describes a methodology, multiattribute interaction design (MAID), which we developed to satisfy the requirements. Section 6 presents initial validation from laboratory charettes that suggests MAID's potential for improving conceptual design and provides motivation for further testing. Section 7 briefly details its contribution to design theory literature. Section 8 concludes with a discussion of practical impact and issues for further research, including a discussion of a more rigorous development and validation that could help take MAID from idea to practice.
2. MOTIVATING CASE STUDIES: IMPACT OF OBSERVED PROBLEM ON CURRENT PRACTICE
To demonstrate the effect of our observed problem on industry practice, we take two industry case studies: first, the case of the California High Speed Rail Authority's planning process for the South Bay Area, and second, the Stanford Green Dorm Feasibility Study.
As part of this proposed route of the California high-speed rail, the High Speed Rail Authority required a station to be placed either in Palo Alto or Redwood City. In September 2008, Palo Alto, in a parallel study to the High Speed Rail Authority process, investigated undergrounding the existing tracks in hopes of selling “air rights” above the existing right of way to offset the increased cost of tunneling (Dong, Reference Dong2008). Our analysis of this conceptual design process illustrates shortcomings in current practice.
Palo Alto narrowed the solution space one decision at a time, considering different and nonexplicit sets of project objectives at different points in the process. Faced with two decisions (the choice of above or below ground trains in conjunction with either high or low-density development along the right of way), the city had essentially four alternatives to consider. Instead of evaluating each with respect to an agreed upon set of project objectives, the city designers chose the underground option for reasons of noise and aesthetics, and subsequently, based on that imposed constraint, chose high-density development for reasons of cost (extra retail space would help pay for the tunnel). In reality, both decisions had consequences for both of these sets of objectives. For example, it is likely that the amount of development needed to offset the cost of tunneling would need to be of greater density and building height than existing Palo Alto zoning ordinances created for aesthetic and noise reasons similar to those that prompted the initial decision to underground the tracks in the first place. Without a systematic method for exploring this solution space, Palo Alto overconstrained the trade space with a decision lacking explicit rationale and potentially resulting in rework (in the form of many community and city council meetings) later in the design process.
The second case study was launched in November 2003, when the Department of Civil and Environmental Engineering at Stanford University endeavored to build an “evolving,” “influential,” “flexible,” and “desirable” environmentally sustainable facility for student housing and for faculty research (Stanford Green Dorm, 2006). The group's admirable initial description of project objectives should be noted, especially as they will relate to subsequent observations about the actual design process. As part of feasibility study (EHDD Architects, 2006) from August 2005 to March 2006, Green Dorm designers needed to select a combination of options for the project and then demonstrate that it could be built to meet project requirements. It should be noted that the feasibility study team was not explicitly tasked with finding a “best” alternative. However, this is not the explicit task conceptual design, nor will it be the goal of our proposed framework, which is meant to encourage the explicit exploration of a large number of options and objectives. Thus, it is relevant that without an explicit conceptual design framework, the Green Dorm Team neglected to consider many potential combinations of options and their effect on many objectives.
The project team generated two potential alternatives, called “baseline green” and “living lab.” Although these alternatives were innovative given industry norms, the exploration of fortuitous combinations was not. Given the documented information and the names of the two alternatives, it seems as though there were only three factors driving the creation of the trade space (novelty of technologies, environmental responsibility, and cost) when the design team had explicitly noted several more objectives in their initial meeting, as discussed above. The baseline green alternative minimized cost at the expense of novelty and maintaining a minimum of environmental responsibility, whereas the living lab alternative maximized novelty and environmental responsibility at the expense of costs. Furthermore, by taking an “all or none” approach on this axis, designers neglected to consider possible combinations that could satisfy a broader range of project value (expressed on other, implicit axes).
The analysis performed by students in a sustainable design class at Stanford formally calculated the value of some possible different alternatives. Using the same method that was used to evaluate the “living lab” against the “baseline green” alternative by Haymaker and Chachere (Reference Haymaker, Chachere and Smith2006) and by also considering the interactions between options, the students found a “solar electric” alternative with potentially higher overall project value (Corcoran et al., Reference Corcoran, Walton, Ehrich and Stoutenburg2008). By eliminating certain technologies with high costs and overlapping energy production functions, this alternative maximized trade-offs between research potential, cost, and environmental benefit, thereby achieving greater value. Although this work lacks the necessary precision and rigor to draw complete conclusions, it seems a more systematic methodology for assembling options may provide a path to finding more innovative and integrated alternatives.
3. THEORETICAL FRAMEWORK: REQUIREMENTS AND METRICS FOR CONCEPTUAL DESIGN
This section defines a theoretical framework for solving the observed problem. We aim to create a method to help design teams explicitly and flexibly document and explore the interactions among the largest number of options with respect to the large number of objectives. Improving these design processes, however, requires understanding the types of information such a process will need to manage and clearly defining metrics for measuring improvement.
3.1. Framework for information processing in conceptual design
Ballard and Koskela (Reference Ballard and Koskela1998) propose that engineering requires managing three types of views: conversion (or sometimes called transformation), flow, and value. The conversion view focuses solely on completing tasks, often by dividing a project into discrete elements and responsibilities. Breakdown structures are one example of managing conversion views. Although conversion views usually ensure the completion of a project to required specifications, considerations of time and overall project value are absent.
The flow view focuses on reducing waste and rework. Managing the flow view means ordering tasks appropriately and facilitating team communication. If we say that project tasks are broken down and represented in the conversion view, then the flow view makes sure that information from one task is conveyed to another one for purposes of avoiding confusion and promoting teamwork. For example, the design structure matrix (DSM) method helps designers visually convey required information flow from one task to another.
The value view focuses on maximizing benefit to stakeholders, ideally according to a set of complete and well-defined project objectives. As examples, Green (Reference Green1994) presents one method for transparently and exhaustively defining project objectives, and Haymaker and Chachere (Reference Haymaker, Chachere and Smith2006) further proposes a method for systematically measuring value of potential solutions with respect to these objectives. In the value view, breakdown of information and information flow (conversion and flow views) are abstracted away in favor of isolated evaluations of solutions. Of course, the very creation of these solutions relies on these other views, reinforcing their mutually dependent nature.
Ballard and Koskela (Reference Ballard and Koskela1998) theorize that the AEC community should strive to create design management tools that integrate and balance these three views. In particular, for conceptual design, options are usually defined and broken down in the conversion view, the objectives managed in the value view, and teamwork that can communicate interactions between options and objectives measured in the flow view. Creation of a process that manages all three views is likely to meet our aims.
These requirements for information processing must be placed in a well-defined conceptual design context. Weber and Condoor (Reference Weber and Condoor1998) characterize effective conceptual design as occurring through two key steps: first, the division of design into smaller decisions, and second, the exploration of several conceptual designs through the explicit combination of proposed solutions to these topics. Pahl et al. (Reference Pahl, Beitz, Feldhusen, Grote, Wallace and Blessing2007) elaborate further, proposing five steps: identifying essential problems (i.e., establishing objectives), establishing topics, proposing options for topics, finding suitable combinations of options, and then selecting the best combinations thereof. Both of these characterizations can be described according to the three engineering views.
It is important to specify the type of creativity and conceptual design ability we hope to facilitate with our method. We choose to investigate a prescriptive, computer-based process (Finger & Dixon, Reference Finger and Dixon1989). Shah et al. (Reference Shah, Vargas-Hernandez and Smith2003) propose two different types of “ideation methods”: intuitive and logical. In order to fit better with conversion views of engineering and Weber and Condoor's (1998) description of conceptual design, we aim for a logical method, which focuses on “systematic decomposition and analysis” of a design problem. Within the category of logical ideation methods, two subcategories exist: history based and analytical. Our process should be mostly analytical, focusing on “systematically analyzing basic relations, causal chains, and desirable/undesirable attributes” (Shah et al., Reference Shah, Vargas-Hernandez and Smith2003). Of course, any design is inherently history based, because it draws upon existing knowledge. However, our methodology should facilitate multidisciplinary communication for creative means, not the use of catalogued design data.
Integration of the three engineering views at a very precise level during conceptual design may be inadvisable when information uncertainties are great. Even within one view, acknowledgments of uncertainty and limits on rationality require simplification and arbitrary classification of data (Simon, Reference Simon1977). Such simplification during conceptual design is in accord with Jansson's (Reference Jansson and Oakley1990) claim that the most creative ideas are generated from relatively simple concepts. Classifying our desired method as logical–analytical further clarifies the type of structured exploration and creativity that we hope to facilitate. Even with the advance of computers that allow exploration of large numbers of solutions (Woodbury & Burrow, Reference Woodbury and Burrow2006), limitations of software integration and aforementioned complexity make computer-driven parametric multidisciplinary analysis difficult at conceptual stages of design (Gallaher et al., Reference Gallaher, O'Connor, Dettabarn and Gilday2004; Holzer et al., Reference Holzer, Hough and Burry2007). Furthermore, when exact options and specifications are unknown, such methods as multidisciplinary optimization (Bailing & Rawlings, 2000) and parametric analysis may be inappropriate (Pahl et al., Reference Pahl, Beitz, Feldhusen, Grote, Wallace and Blessing2007). We seek to find a more flexible and creative method that can capture a greater variety of conceptual design alternatives that are potentially more difficult to achieve with methods that require such precision. Chachere and Haymaker (Reference Chachere and Haymaker2011) illustrate how such methods for documenting decision rationale can support reasoning, develop consensus, and explain decisions for later use during a given project or for future projects.
Describing design processes requires formal language. Kam's (Reference Kam2005) AEC ontology describes a basic element of a decision, an option, as a “decision choice in its most detailed form.” Design is the process of choosing from among different options. Options include a certain type of window, the use of solar panels to produce energy, or a particular architectural layout. Deriving from breakdown structures and as part of the conversion view, we group options into topics. Topics are “decision categories” that represent subdecisions that must be made as part of a larger project scenario. The option of solar panels might fall under the topic, “energy production system.” Multiple options selected from different topics and aggregated to form a product are called alternatives. An example of an alternative might be a certain choice of window in conjunction with the choice of solar panels.
Chachere and Haymaker (in press) define objectives as the public, explicit, and all encompassing set of stakeholder-defined goals, preferences, and constraints that apply to a project. In this paper, we define an interaction as a combination of two options yielding effects not represented when options are analyzed individually (i.e., the total is greater or less than the sum of its parts). Using this lexicon, we can more specifically state our overall aim, namely, our method wishes to facilitate the exploration of a broad range of options and interactions within and between discrete topics in search of valuable alternatives as defined by evaluation with respect to project objectives. To maintain consistency and clarity moving forward, we will exclusively use this language throughout the paper.
We have determined that a successful process will integrate three engineering views and facilitate breaking down a decision into topics and then building creative and valuable alternatives from options within those topics by considering interactions during conceptual design. Thus, we define the following requirements of each engineering view that help to accomplish this aim. These requirements for each view enable the explicit and flexible representation of the following:
Conversion view
• design decisions topics
• hierarchical decomposition of topics into options
• aggregation of options into alternatives
Flow view
• communication and coordination between tasks and teams
• interactions between options.
Value view
• Stakeholder objectives
• Performance of options with respect to objectives
• Value of alternatives from impact of options and interactions on objectives
3.2. Metrics for evaluation of design space exploration
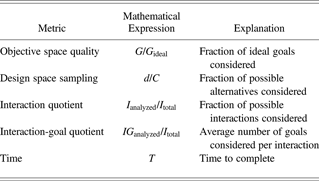
Building on a theoretical review of design space metrics described in Clevenger and Haymaker (Reference Clevenger and Haymaker2010), we use five metrics described below and summarized in Table 1 to help understand the extent to which a particular design process achieves these aims.
List of metric
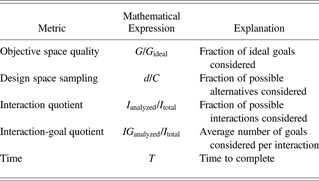
Note: G is the number of goals considered, G ideal is the number of goals in the “ideal” set, d is the alternatives considered, C is the number of alternatives possible, I analyzed is the interactions explicitly analyzed, I total is the number of interactions possible, IG analyzed is the number of goals affected in I analyzed, and T is the time.
Objective space quality (OSQ) measures how well a design process explored a broad and well-defined set of project objectives. This concept encompasses two measures: the number of objectives involved and the rationality of those objectives, as covered in Edvardsson and Hansson (Reference Edvardsson and Hansson2005). Because our specific work does not focus on the generation, and in turn the quality or rationality, of project objectives, we will focus only on the number of objectives considered. OSQ is calculated as a percentage of objectives considered compared to an ideal set of objectives; this method gives more information than simply counting the number of objectives included in analysis, although both convey generally the same idea. To specify this “ideal” set, we defer to previously discussed methods of Green (Reference Green1994) and Haymaker and Chachere (Reference Haymaker, Chachere and Smith2006), as these methods do the most to engage a defined set of stakeholders in search of a broadest possible conception of project objectives.
Design space sampling (DSS) is the fraction of alternatives considered divided by the total number of alternatives possible. Although exploring a greater percentage of the design space does not explicitly guarantee finding better alternatives, past research shows that this is true in many cases (Weber & Condoor, Reference Weber and Condoor1998; Akin, Reference Akin, Eastman, Newstetter and McCracken2001; Sutton, Reference Sutton2002; Ïpek et al., Reference Ïpek, McKee, Caruana, de Supinski and Schulz2006).
Interaction quotient (IQ) is the percentage of interactions noted by designers compared to the total number of interactions possible, both for options in different topics and for those in the same topic (total therefore defined as the product of the number of options in each topic added to the sum of number of 2-combinations for the options in both topics). Even though we seek a methodology that gives design teams the ability to note every interaction, they are certainly not required to do so, and thus IQ provides some measure of how thorough a process is in documenting Interactions.
Interaction-goal quotient (IGQ) measures how many different objectives are deemed by designers to be of consequence for each interaction noted. We seek the ability to note different consequences for every potential objective in search of greater value. IGQ is calculated as the average number of objectives analyzed as part of interactions.
Time measures how long a method requires, given the number of options, objectives, and interactions. Any conceptual design process must weigh the benefits in increased design knowledge with the time and resources that must be devoted to the method. Given the scope of our research, however, the most important application of this metric will be to understand whether it is the mechanics of the methodology or in the time needed to complete the methodology that underlie values obtained for the previous four metrics.
Related to transformation, flow, and value, the first metric helps quantify how well we have managed the transformation view, the second how well we have managed the value view, and last three how well we have managed the flow view.
For each of these three engineering views, there are examples of tools that successfully manage them. Through analysis of these tools with respect to the view characteristics, we can pinpoint their existing strengths and shortcomings and, in the context of our theoretical framework, describe how a process might be “better.”
4. POINTS OF DEPARTURE: DESIGN MANAGEMENT SYSTEMS
After defining exactly what aims we wish to address, at which point in the design process we wish to do so, and with which language we will discuss them, we can now formulate our research question:
What is a multidisciplinary conceptual design method to explicitly search, manage, and evaluate integrated solution spaces of options with respect to objectives in search of valuable tradespaces of alternatives?
“Multidisciplinary” conveys the importance of communication between disciplines, as supported by flexible methods. “Conceptual design” encompasses the significance of increased design knowledge and freedom at the beginning stages of design, as well as grounded notions of conceptual design expressed in mechanical engineering and cognitive psychology literature. “Search, manage, and evaluate” mirror the conversion, flow, and value views of engineering, because we mean to search sets of options defined in the conversion view, manage interactions in the flow view, and evaluate integrated alternatives in the value view. Finally, the distinction between solution spaces and trade spaces defines the starting and ending points of our method in terms of the stages of a design process.
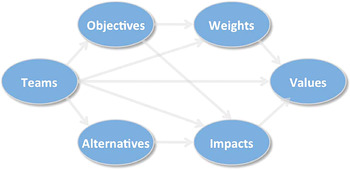
Multiattribute, collaborative design, analysis, and decision integration (MACDADI; Haymaker & Chachere, Reference Haymaker, Chachere and Smith2006; Haymaker et al., in press), as mapped in Figure 2, specifies the building of six design models to explicitly define organizations, objectives, weights, options, impacts, and value. MACDADI manages the value view by engaging with stakeholders to define objectives and then defines normalizing metrics for designers to evaluate potential alternatives. MACDADI helps to break down decisions and responsibilities into alternatives and topics, but does not specifically facilitate the recombination and evaluation of different combinations of options, thus only partially managing the conversion view. MACDADI does provide explicit frameworks for teamwork and communication, but it lacks a method to note interactions between hierarchically defined tasks and elements, thus not fully satisfying the flow view. Nonetheless, MACDADI's explicit value management capabilities will serve as the organizing framework of our new method. Essentially, we seek to insert into MACDADI's value management capabilities a systematic way of thinking about the potential value of interactions between options.
A schematic of the multiattribute, collaborative design, analysis, and decision integration process (http://www.MACDADI.com; Haymaker et al., in press). [A color version of this figure can be viewed online at journals.cambridge.org/aie]

Pugh's (Reference Pugh1981) controlled convergence method uses a matrix to rate potential “concepts” (alternatives) against a predetermined set of project criteria, thus satisfying the value view. After evaluation, the method encourages multiple iterations where designers combine concepts that may have complementary strengths and weaknesses in search of a concept that best satisfies all project objectives. Although the method encourages the recombination of options to form alternatives, like MACDADI, it does not provide an explicit or systematic method for doing so. Furthermore, it does not systematically note rationale (e.g., interactions) for combinations of options that compose these alternatives. Thus, it cannot completely satisfy the conversion view or the flow view. By inserting the concept of value into the notion of interactions, we are making explicit the reasons for considering different alternatives. MAID can help make transparent the consideration of different combinations of options throughout the process.
Strategy generation tables (Howard, Reference Howard1988) satisfy the conversion view by hierarchically breaking down and representing decisions as made up of topics, their constituent options, and aggregated alternatives. For example, in Figure 3 below, choosing one option from each of the topics labeled in the top row composes an alternative focused on the idea of “service business,” as written at left. By expressing this “strategy theme,” strategy generation tables acknowledge that different alternatives present different value propositions. However, they do not use an explicit framework to rationally justify such labels with respect to project objectives. Thus, we argue that the method only partially manages the value view. We also note that strategy generation tables do not represent interactions (or more generally, information flow) between options, therefore failing to manage the flow view. In essence, we hope to create a framework that fills in the absence of explicit objectives and explicit interactions currently implicit in the lines and boxes within a strategy table.
An example of a strategy-generation table based on Howard (Reference Howard1988).

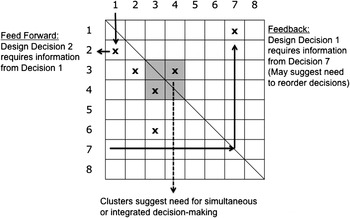
The DSM methodology uses matrices to visually represent ideal information flow within a project (e.g., Yassine & Braha, Reference Yassine and Braha2003). It visually represents what tasks or decisions contain information that should be used in other tasks or decisions. For example, in Figure 4, an “x” in any given box represents that information from the element denoted by the column heading is needed by the element denoted by the column heading. As shown, the “x” in column B and row C denotes that C needs information from B, or more simply, that elements B and C interact in at least one important way and require some level of integrated decision making. DSM explicitly acknowledges interactions between decomposed project elements, and in doing so, helps to make sense of a hierarchical breakdown structure. Thus, it provides a concise way of satisfying both conversion and flow views of a process. However, DSM does not manage the value view. We seek to create a method that conveys specific information regarding the nature of noted interactions with respect to any project objectives.
An example of a design structure matrix based on Whitney et al. (Reference Whitney, Anderson, Cadet, Fine, Gossard, Thornton, Groover, Nagel, Ozsoy, Stenger, Anderson, Chang, Cunningham, Gutwald, Hardy, Laukaitis, Lee, Mantripragada, Pomponi, Soman, Baykan, Greif, Johnston, Kim, Marquette, Meixell and Roth1995).

Morphological matrices, first formalized by Zwicky (Reference Zwicky1948), have long been used to improve conceptual generation phases in design. Similar to strategy tables, they specify functions (topics, in our language) and solutions (options) in columns and rows, and designers then compose alternatives by picking one solution from each function (one option for each topic; Pahl et al., Reference Pahl, Beitz, Feldhusen, Grote, Wallace and Blessing2007). Morphological matrices still do not explicitly note interactions between options, thus only achieving partial management of the flow view. Like strategy tables, morphological matrices do not manage the value view, because little to no information is conveyed, other than potential feasibility, about the performance of interactions and alternatives with respect to objectives.
Weas’ and Campbell's (Reference Weas and Campbell2004) analysis of interconnected decision areas (AIDA) provides another fundamental point of departure by visually and explicitly supporting breakdown structures through circles (representing topics) and dots within them (representing constituent options). Furthermore, these options are presented in a matrix similar to DSM, in which pair wise combinations are checked for interactions affecting feasibility. However, AIDA lacks notions of stakeholder objectives and value, both in its treatment of individual options and their interactions. AIDA thus exemplifies management of the conversion and flow views but lacks management of the value view. This is similarly true of the DeMAID process developed by Rogers (Reference Rogers1989). DeMAID's improves the DSM method by ordering these tasks, determining their interactions, grouping iterative processes, and displaying the entire process in a DSM matrix. However, DeMAID also lacks acknowledgement of the value view.
Kam's (Reference Kam2005) decision dashboard (DD) utilizes colored boxes and lines to represent breakdown of options into topics and aggregation into alternatives, as well as the evaluation of those elements to project objectives. In doing so, DD satisfies the conversion view. However, similar to controlled convergence and AIDA, DD does not explicitly represent the impact of interactions, nor does it provide for an overall calculation of project value from individual evaluations of options. DD also lacks explicit lines of communication that help facilitate the creation of its visual maps; thus, it fails to satisfy the flow view and only partially satisfies the value view. We hope to add rationale clarity to treatment of the interactions between options.
Quality function deployment (QFD; Akao, Reference Akao and Mazur2004) explicitly derives technical requirements from customer desires, using multiple matrices in a successively more detailed “house of quality” to systematically break down products and processes for design solutions, thus partially satisfying the conversion and value views. Because QFD focuses only on such a breakdown and not on aggregation of options into multiple alternatives, nor a comparison of those alternatives through explicit value calculations, it can only partially satisfy these views. QFD explicitly denotes interactions between organizational functions and technical assemblies in a matrix similar to DSM, thus both demonstrating their importance and partially satisfying the flow view.
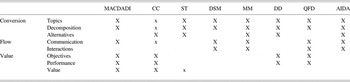
We summarize our review of current literature and methods in the points of departure matrix (Table 2). A capital “X” signifies that a method fully satisfies a requirement; a lowercase “x” signifies that a method partially or incompletely satisfies a requirement, and a blank entry means that a method does not fulfill that requirement. We desire to create a column with a method that has an “X” in every row.
Points of departure matrix

Note: MACDADI, multiattribute, collaborative design, analysis, and decision integration; CC, controlled convergence; ST, strategy tables; DSM, design structure matrix; MM, morphological matrix; DD, decision dashboard; QFD, quality function deployment; AIDA, analysis of interconnected decision areas.
5. MAID
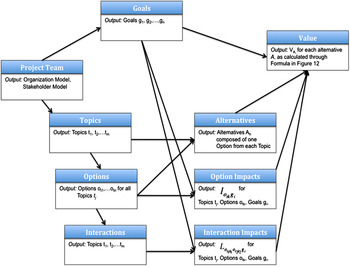
MAID builds on characterizations of conceptual design discussed earlier (Weber & Condoor, Reference Weber and Condoor1998; Pahl et al., Reference Pahl, Beitz, Feldhusen, Grote, Wallace and Blessing2007; Chachere & Haymaker, in press). To satisfy our proposed requirements within this context, we draw upon and combine the strengths of existing methodologies discussed earlier. A process and data flow view of MAID is presented in Figure 5. In subsequent figures, schema descriptions of each step are provided, as well as screen shots of a prototype tool, also called MAID, illustrating its use on the Stanford Green Dorm Project.
A process map of multiattribute interaction design. [A color version of this figure can be viewed online at journals.cambridge.org/aie]

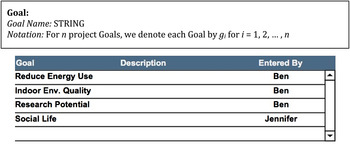
For the “Project Team” and “Goals” steps, we defer to Haymaker and Chachere (Reference Haymaker, Chachere and Smith2006) and Green (Reference Green1994) to detail the development of stakeholder and objective models. For the purposes of MAID, data outputs from these steps include only the enumeration of project objectives, as illustrated by the four chosen in the charette (Fig. 6).
A schema description and example of the goals for multiattribute interaction design.

We note that stakeholder definition generally precedes objective identification, and we follow this convention here in ordering these first steps. Further refinement of the project team beyond stakeholders, especially including the selection of appropriate AEC professionals, will almost certainly occur in an iterative manner as objectives become clearer; this discussion is beyond the scope of this paper.
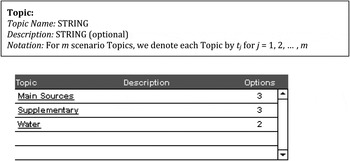
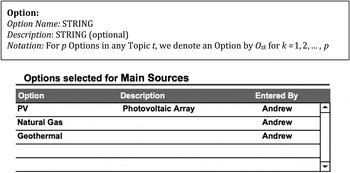
It is in the bottom section of the process map that MAID proposes a new and improved methodology. First, in the “topics” and “options” steps designers explicitly and hierarchically organize options within topics to manage the conversion view. Pahl et al. (Reference Pahl, Beitz, Feldhusen, Grote, Wallace and Blessing2007), Weber and Condoor (Reference Weber and Condoor1998), and Kunz and Fischer (Reference Kunz and Fischer2007) define specific methods for creating topics through functions, subfunctions, and breakdown structures. In the example charette, designers have chosen three topics: main sources of energy, supplementary sources, and water management (Fig. 7), within each of which can be defined a series of constituent options (Fig. 8).
A schema description and example of the topics for multiattribute interaction design.

A schema description and example of the options for multiattribute interaction design.

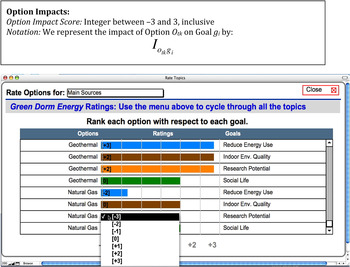
Second, as in MACDADI, design teams analyze options individually with respect to project objectives in the “option impacts” step. Option impacts are chosen as integers on a scale from −3 to 3, according to metrics that can be developed to varying levels of specificity (Fig. 9). Although such a ranking system may be arbitrary to some degree, Pahl et al. (2006) points out that quantifying all parameters during conceptual design is impossible, and thus qualitative judgments should be made on the basis of metrics and design intuition. Pahl adds, “Though the attribution of points raises problems, it is not advisable to evaluate too timidly during the design phase.” Rating options assigned to separate topics with respect to project objectives integrates conversion and value views. Notably, for some options, their “goodness” is determined in large part by other decisions made about other topics; this is the motivation behind the subsequent steps in the MAID methodology that analyze interactions between options.
A schema description and example of the option impacts for multiattribute interaction design. [A color version of this figure can be viewed online at journals.cambridge.org/aie]

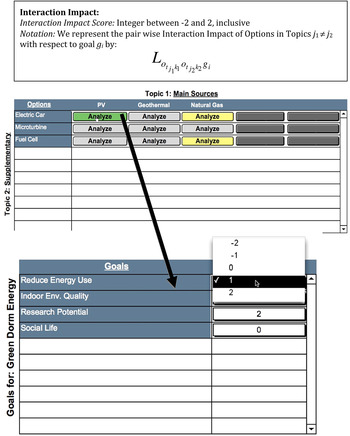
In the “interactions” step, design teams identify and analyze potential Interactions between options. By using a matrix similar to DSM and AIDA, designers visually pick out combinations of options for which the consideration of integrated design is important (Fig. 10). Positive and negative interactions exist; both should be noted as a means of facilitating creative and value-based design. By explicitly noting interactions between options within topics, this step manages both conversion and flow views (Fig. 10, top).
A schema description and example of the interaction impacts for multiattribute interaction design. [A color version of this figure can be viewed online at journals.cambridge.org/aie]

To impart value management, MAID asks designers explicitly think about the specific objective(s) for which the relevant interaction has effects (“interaction impacts” step). Interactions are rated on a scale of −2 to 2, where 2 specifies a very positive interaction and −2 a very negative one. Such constructed scales are justified both in a conceptual design framework (Pahl et al., Reference Pahl, Beitz, Feldhusen, Grote, Wallace and Blessing2007) when much information is still unknown (as with interactions) and in the context of normalizing across variety of project objectives measured in very different units (Keeney & von Winterfeldt, Reference Keeney, von Winterfeldt, Edwards, Miles and von Winterfeldt2007). In this case, when designers recorded an interaction between photovoltaic cells and electric vehicles as elements of an energy system, they were prompted with the screen shown on the right in the bottom of Figure 10. Here, they noted that their research potential was more than simply the sum of their individual ratings, because research on the use of electric vehicles to store excess electricity produced by solar cells at hours of peak sun exposure was proposed by Stanford faculty in the Green Dorm Feasibility Study (EHDD Architects, 2006). This interaction affected the objective of reducing energy use as well, because if electric vehicles could serve an energy-storing purpose, then more of the energy production from photovoltaic cells could be used to help reduce energy consumption from other resources (presumably powered by fossil fuels). In short, evaluating interactions based on their impacts on specific project objectives provides more information on the potential impacts of those decisions in order to help find combinations of options that satisfy multiple requirements.
The cells in the matrix change color to reflect whether the total effect of that specific Interaction on all project objectives was positive or negative (Fig. 10, top). In effect, this provides an entirely new method of generating and explaining a DSM matrix, using information in the value view to generate Xs in the flow view. By executing these steps for matrices corresponding to different pairs of options, design teams can visualize which topics will require the most collaboration between designers during further stages of design. Explicit and documented rationale will be available to the team throughout the project, potentially helping to motivate and inspire creative configurations of options.
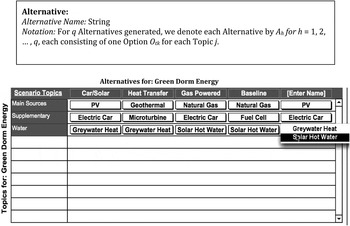
Using data entered up until this point, MAID uses strategy tables and morphological matrices to motivate the selection alternatives in the “alternatives” step. Design teams can choose combinations of options, as shown in Figure 11. Alternatives shown in columns are composed of options selected from each topic (one topic per row). As in strategy tables, design teams can title alternatives so as to remind themselves of the reasoning or “themes” behind their choices.
A schema description and example of the alternatives for multiattribute interaction design.

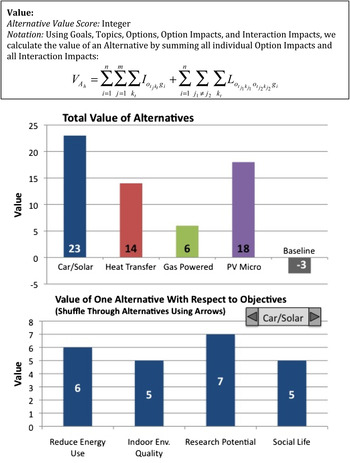
MAID explicitly calculates the value for each alternative using data already input in prior steps. As specified in Figure 12, value is calculated additively by summing individual option impacts and interaction impacts across all objectives, topics, and options. Note that stakeholder weighting of objectives was not included in this version of MAID software, but it could easily be integrated into the value calculation by multiplying each impact term by the weight of its respective objective, as is done in MACDADI. Although methods of calculating value will vary depending on the specific value model used, we have assumed that project objectives developed in MACDADI meet properties of fundamental objectives proposed by Keeney (Reference Keeney, Edwards, Miles and von Winterfeldt2007) and rationality (Edvardsson & Hansson, Reference Edvardsson and Hansson2005) that justify the use of additive value models (Keeney & von Wintefeldt, 2007). It is certainly possible to develop other, more complicated methods of aggregating metrics and differentiating between first- and second-order impacts, as well as to develop cardinal rating systems that allow relative ratings of options and alternatives against predefined benchmarks. However, doing so would require proof that the new method significantly improves upon simpler ones, and given previous justification and examples (e.g., Thurston & Carnahan, Reference Thurston and Carnahan1992) of ordinal methods in conceptual design, we leave extensions as an issue for further research.
A Schema description and example of the “value” step of multiattribute interaction design. [A color version of this figure can be viewed online at journals.cambridge.org/aie]

Thus, just like the generation of a flow view from a value view, MAID expresses the value of alternatives generated from the conversion view of Figure 11 through the charts shown in Figure 12. In doing so, MAID meets our aim of making explicit and more specific the implicit value proposition present in the “strategy themes,” lines, and boxes of strategy tables.
In these summary graphs, the left chart shows the total value of each alternative, as calculated by summing the individual and interactive effects of the constituent options on each of the project objectives (Fig. 12, the five bars represent the total value of each of the five alternatives). The chart on the right provides more detailed information on the performance of individual alternatives with respect to specific objectives. For instance, for the “car solar” option shown in Figure 12, the alternative was composed of both photovoltaic arrays and electric cars, and predictably, the data shows a high score for research potential, partly as a result of the interaction the design team denoted in previous steps. This view of project value helps designers to summarize the many levels of prior analysis. Because design, and especially conceptual design, is an iterative process, the explicit documentation of each step can help designers return to their original analyses and refine their initial intuitions as new information arises.
In sum, combining strengths of different design tools, MAID provides one framework for designers to explicitly and flexibly engage in integrated conceptual design by specifically noting interactions between options and their effect on project value.
6. VALIDATION
To this point, we have identified a problem in AEC practice through industry case studies, developed a theoretical framework of metrics and requirements capable of addressing the problem, and described a model that addresses these requirements. In order to begin to test MAID's power and generality, we created simple database software and user interface that allows repeatable use and storage of data. This software allowed us to test our validation strategy through charettes with university students. The results of these tests, in combination with our requirements framework, suggest that MAID may be adept at addressing our observed problem. As initial tests, these charettes are not meant to prove conclusive data about the consequences of MAID on final designs but are instead meant to provide evidence of the power and generality of the method to improve upon our proposed metrics as they relate to the three engineering views. However, rigorous comparison against baseline methods required to make stronger claims is left as an issue for further research.
The two motivating case studies described in Section 2 served as the basis for student charettes. Six groups of undergraduate and graduate students (one to three students) were provided with design scenarios based on these case studies. Because MAID focuses on managing information rather than creating it, students were provided objectives, topics, and options in advance, although they needed to input them into MAID software themselves as part of the charette. As students were not required to generate these on their own, we point to discussions of parallel concepts in other design literature for further insight into those processes. Objectives are easily related to ideas of customer and engineering requirements (Krishnan & Ulrich, Reference Krishnan and Ulrich2001) or to goals in the context of Thurston (Reference Thurston, Lewis, Chen and Schmidt2007), who also discusses options. Griffin and Hauser (2003) explore methods and consequences for generation of customer requirements in a variety of fields, as the previous reference to Green (Reference Green1994) does for the AEC industry. Topics derive from traditions of hierarchical decision making as discussed as part of organizational behavior and mathematical modeling literature by Chachere and Haymaker (in press). Prior references to Kunz and Fischer (Reference Kunz and Fischer2007) and Pahl et al. (Reference Pahl, Beitz, Feldhusen, Grote, Wallace and Blessing2007) are helpful for demonstrations of method, as is Hauser and Clausing's (Reference Hauser and Clausing1988) “house of quality” for building out engineering characteristics and specific option choices in product design and business contexts.
All students had at least moderate backgrounds in performance-based design and design theory, as well as familiarity with the case studies, although they had no prior knowledge of MAID itself. No time limit was explicitly given for the completion of the charette, although as will be described below, time needed averaged 75 min. For the purposes of the charette, students played all parts of the design team: stakeholders, experts, decision makers, and so forth.
6.1. Testing and results
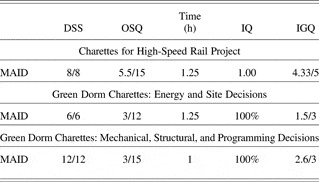
For the high-speed rail project (Table 3), we presented users with a design scenario consisting of three topics, each with two options: location (Palo Alto or Redwood City), separation of grade (above-ground or below-ground train), and density of development (high or low density). In this design problem, eight potential alternatives exist, and we take as an ideal set of objectives the 15 already gathered as part of student projects at Stanford (Roedel et al., Reference Roedel, Talbot and Bian2009).
Results of Charettes and Green Dorm Charettes

Note: DSS, design space sampling; OSQ, objective space quality; IQ, interaction quotient; IGQ, interaction-goal quotient; MAID, multiattribute interaction design.
The data show evidence for three main points. First, MAID facilitates exploration of a large number of project alternatives, as shown by its DSS value. Second, although the OSQ value of the MAID process is relatively low, this is a direct result of constraints of time, not constraints or limitations of the process. By devoting more than 1 h to the charette, designers could have easily achieved greater exploration of the objective space in line with improvements in DSS.
Third, and perhaps most notably, values for IQ and IGQ suggest designers’ ability to note interactions proved very important. Designers noted not only the interactions for all possible combinations of options but also that each interaction impacted a very high number of project objectives. In all charettes, designers chose to note interaction effects for 100% of potential interactions, and for each of these interactions, they recorded consequences for an average of more than four out of five project objectives. These numbers give further credence to the idea that interactions between options are important in the minds of designers and that they can be explicitly expressed in the deign process. Furthermore, these interactions deserve attention in the flow and value view, exactly as provided in the MAID methodology.
In the case of the Stanford Green Dorm, we organized two charettes that tackled different topics and options (Table 3). The first dealt with energy production and site considerations, and the second considered mechanical systems, structural systems, and the inclusion of a living laboratory within the building.
In this data, we see very similar results to the high-speed rail charettes. Use of MAID shows high DSS levels, demonstrating appreciable exploration of alternatives. Furthermore, we continue to see high levels of IQ and IGQ, showing further evidence that this added ability to explore Interactions’ impact on a variety of project objectives proves important to designers.
In conclusion, charettes show increases on two different projects of five metrics that relate to the three engineering views. The data show that the MAID methodology facilitates a wider exploration of the solution space, both in terms of options and objectives. Although the professional design teams were not available for rigorous comparison, our discussion of motivating case studies suggests that MAID could improve these conceptual design processes. Most notably, MAID's ability to note interactions and to integrate their effect on project objectives into an explicit value calculation proves useful, at least in terms of the attention given to that step by designers. We now turn to its contribution to theory.
7. CLAIMED CONTRIBUTION
We claim as a contribution to AEC design theory the development and creation of a flexible and explicit conceptual design methodology that satisfies all the requirements in Table 1 by synthesizing existing methods that do not fully manage such views. MAID's contribution to design theory is relevant given Ballard's and Koskela's (1998) call for more conclusive testing of hypotheses surrounding the effect that management of three engineering views can have on design. Such testing requires methodologies that demonstrate such management. Thus, by providing one example and preliminary testing of such a synthetic methodology, MAID makes an important contribution to design theory.
8. PRACTICAL IMPACT
Integrated design is a complicated process. No methodology, and certainly not one performed in a few hours, will completely and accurately analyze building systems. Nonetheless, design theory holds that using practical value models for conceptual design, in conjunction with management of conversion and flow views, can increase design knowledge and eventually lead to better buildings. Further research is needed to prove this conclusively in our case, although current research suggests possibilities for potential impact.
First, use of MAID can potentially increase the number of alternatives explicitly considered by designers, aligning with current thinking that quality is in large part a function of quantity of potential designs considered, especially in light of increasing design complexity.
Second, use of MAID can potentially increase the number of objectives to be explicitly considered during conceptual design, and research by Green (Reference Green1994) suggests that such value management techniques result in large increases in project value. Furthermore, Green (Reference Green1994) holds that early project team coalescence around explicit objectives helps create a culture of cooperation and “buy in” that proves very useful in all stages of design. For purposes of overcoming obstacles presented by local task responsibility (Ballard & Koskela, Reference Ballard and Koskela1998) and weak cooperation (Clausing, Reference Clausing1994) that emerge from traditional conversion views of engineering, this provides immense value in its own right.
Third, MAID potentially increases the number and specificity of interactions explicitly identified by designers during conceptual design. These interactions where value may lie occur between options and topics for which responsibility falls to disparate design disciplines that may struggle to collaborate (Rechtin, Reference Rechtin1991).
9. CONCLUSION
Integrated conceptual design presents more of a challenge than simply calculating numbers in different ways. Even as we note these preliminary successes in systematically tunneling through existing barriers in AEC design, we acknowledge that such methods may be more important for the discussion that they help to motivate, than for the numbers they generate. Specifically for the AEC industry, where projects tend to evolve slowly as possibilities are weighed sequentially from a variety of perspectives, engaging in systematic design from the beginning can provide a base of more systematic and democratic decision making that can help transform traditional design team dynamics, and lead to faster and higher project value. Structures that facilitate rationale clarity and communication can help take advantage of these important opportunities. Through our careful creation of one of these frameworks, we hope to have contributed to this important effort. Implementing and testing the impact of MAID on project value is future work.
Andrew Ehrich is currently a Marshall Scholar pursuing a degree in regional and urban planning studies at the London School of Economics and Political Science. He earned a BS degree in mathematics from Stanford University, where he pursued research interests and a senior thesis in formal multidisciplinary design methods for sustainable built environments. Andrew also served as the President of Hillel at Stanford and as a teacher for the Breakthrough Collaborative in Manchester, NH. As a Tom Ford Fellow in Philanthropy in 2009–2010, Andrew worked at the Surdna Foundation in New York. As a Marshall Scholar, Andrew will explore ways to improve transportation systems through programs focused on urban design and governance. He cowrote this paper as an interdisciplinary honors thesis through the Center for Integrated Facility Engineering and the Goldman Program in Environmental Science, Technology, and Policy at Stanford University.
John Haymaker is the Founder of Design Process Innovation (http://www.designprocessinnovation.com/DPI/Home.html). He earned BA and MA degrees in architecture from the Universities of Michigan and Illinois, an MA in design computation from MIT, and a PhD in civil engineering from Stanford University. Before founding DPI, John was a Professor at Stanford University, where he taught and led a multidisciplinary team of architectural, structural, mechanical, construction, and management and computer science researchers. He is also a California-licensed architect with 20 years of experience as a designer, builder, and researcher. John and the DPI team have worked on many types of projects, including residential, commercial, government, institutional, high-rise, healthcare, high-speed rail, urban development, and civil infrastructure. Dr. Haymaker cowrote this paper when serving as an Assistant Professor of civil and environmental engineering at Stanford University. He is a member of the American Institute of Architects.