Implications
Lameness is one of the biggest health and welfare issues in modern dairy farming. Automatic monitoring systems for animal health, production, activity, gait and posture management are commercially available. For farmers it is important to know if disease detection significantly improves for multi-sensor systems compared with single sensor systems. The multi-sensor approach obtains the best classification results. The improvement in comparison with the best single sensor system is however small. A video-based system for back posture measurements is outperforming activity and milking monitoring for lameness detection.
Introduction
Lameness is one of the biggest health and welfare issues in modern intensive dairy farming (Bruijnis et al., Reference Bruijnis, Beerda, Hogeveen and Stassen2012). The prevalence of lameness is often underestimated (Bruijnis et al., Reference Bruijnis, Beerda, Hogeveen and Stassen2012; Fabian et al., Reference Fabian, Laven and Whay2014), and is affected by many different factors (Becker et al., Reference Becker, Steiner, Kohler, Koller-Bahler, Wuthrich and Reist2014). The most common method to obtain a herd lameness prevalence rate is visual locomotion scoring (Flower and Weary, Reference Flower and Weary2009). This procedure combines several gait and posture characteristics such as back arch, gait asymmetry and weight bearing into one overall locomotion score (LS) (Sprecher et al., Reference Sprecher, Hostetler and Kaneene1997; Flower and Weary, Reference Flower and Weary2009; Schlageter-Tello et al., Reference Schlageter-Tello, Bokkers, Koerkamp, Van Hertem, Viazzi, Romanini, Halachmi, Bahr, Berckmans and Lokhorst2014b). The procedure is however subjective (Schlageter-Tello et al., Reference Schlageter-Tello, Bokkers, Koerkamp, Van Hertem, Viazzi, Romanini, Halachmi, Bahr, Berckmans and Lokhorst2014a), time-consuming (Main et al., Reference Main, Barker, Leach, Bell, Whay and Browne2010) and costly. Due to increased farm size and limited time per animal, visual observation of cow health and welfare is evolving to automated monitoring systems. Modern dairy farms nowadays are equipped with (maybe even multiple) sensors that continuously measure and record key indicators for animal health and welfare (Rutten et al., Reference Rutten, Velthuis, Steeneveld and Hogeveen2013). Automatic milk yield measurements are very common in European dairy farming, and the use of other sensors such as activity sensors, milk conductivity sensors, etc. is spreading (Rutten et al., Reference Rutten, Velthuis, Steeneveld and Hogeveen2013). Sensors make continuous monitoring of the individual in the herd possible. Oestrus detection based on animal behaviour is well described in literature and used in practice (Brehme et al., Reference Brehme, Stollberg, Holz and Schleusener2008). There are also studies on automatic mastitis detection (Kramer et al., Reference Kramer, Cavero, Stamer and Krieter2009; Miekley et al., Reference Miekley, Stamer, Traulsen and Krieter2013) and lameness detection (Kamphuis et al., Reference Kamphuis, Frank, Burke, Verkerk and Jago2013; Miekley et al., Reference Miekley, Stamer, Traulsen and Krieter2013; Van Hertem et al., Reference Van Hertem, Maltz, Antler, Romanini, Viazzi, Bahr, Schlageter-Tello, Lokhorst, Berckmans and Halachmi2013).
Computer vision is a promising technique for animal monitoring because it is relatively low cost and simple to install. Studies using computer vision focus on gait analysis such as step overlap (Pluk et al., Reference Pluk, Bahr, Leroy, Poursaberi, Song, Vranken, Maertens, Van Nuffel and Berckmans2010) and hoof release angles (Pluk et al., Reference Pluk, Bahr, Poursaberi, Maertens, van Nuffel and Berckmans2012), and posture analysis such as back curvature (Poursaberi et al., Reference Poursaberi, Bahr, Pluk, Van Nuffel and Berckmans2010; Van Hertem et al., Reference Van Hertem, Viazzi, Steensels, Maltz, Antler, Alchanatis, Schlageter-Tello, Lokhorst, Romanini, Bahr, Berckmans and Halachmi2014; Viazzi et al., Reference Viazzi, Bahr, Van Hertem, Schlageter-Tello, Romanini, Halachmi, Lokhorst and Berckmans2014). Back curvature can be extracted from images by different feature variables, such as an inverse radius (Poursaberi et al., Reference Poursaberi, Bahr, Pluk, Van Nuffel and Berckmans2010; Viazzi et al., Reference Viazzi, Bahr, Van Hertem, Schlageter-Tello, Romanini, Halachmi, Lokhorst and Berckmans2014), different curvature angles (Viazzi et al., Reference Viazzi, Bahr, Van Hertem, Schlageter-Tello, Romanini, Halachmi, Lokhorst and Berckmans2014) and a back posture measurement (BPM) (Van Hertem et al., Reference Van Hertem, Viazzi, Steensels, Maltz, Antler, Alchanatis, Schlageter-Tello, Lokhorst, Romanini, Bahr, Berckmans and Halachmi2014). The strong relation between back arch and gait abnormality is proven (Sprecher et al., Reference Sprecher, Hostetler and Kaneene1997; Blackie et al., Reference Blackie, Bleach, Amory and Scaife2013; Hoffman et al., Reference Hoffman, Moore, Vanegas and Wenz2014).
The use of a single predictor variable was very often not strong enough as a classifier for lameness, partly due to high within- and between-cow variability (Kramer et al., Reference Kramer, Cavero, Stamer and Krieter2009). In addition, the large pool of sensor data is not extensively used. In order to develop a good and proper lameness detection, there is an on farm need to combine data from different sources in a multivariate approach (Ito et al., Reference Ito, von Keyserlingk, LeBlanc and Weary2010; de Mol et al., Reference de Mol, Andre, Bleumer, van der Werf, de Haas and van Reenen2013). Sensors are capable of replacing the eyes (and nose) of the farmer, and therefore can assist in monitoring the lameness level in their herd. Automated lameness detection makes early detection of the underlying problem possible. The term early can be interpreted in two ways: (i) early as in an early stage of the lesion or infection; or (ii) early as is sooner as the farmer would have done by visual observation. An early treatment of the lesion that is causing the lameness improved the cure rate of the animal (Thomas et al., Reference Thomas, Pacheco, Bell, Mason, Whay, Maxwell, Archer, Remnant, Bollard, Sleeman and Huxley2013). An early treatment of lameness will also reduce the economic impact of lameness on total farm economics (Bruijnis et al., Reference Bruijnis, Beerda, Hogeveen and Stassen2012). Other studies have, however, point to the fact that an early detection alone is not enough, but that an adequate action of the farmer is as important. The study of Alawneh et al. (Reference Alawneh, Laven and Stevenson2012) revealed that for >65% of the lame cows, the time between detection and treatment exceeded 3 weeks. In order to reduce cattle lameness, it is important to understand the motivations of the farmers (Leach et al., Reference Leach, Whay, Maggs, Barker, Paul, Bell and Main2010).
To our knowledge, no attempt was done to extend a video-based lameness detection system with behaviour and performance variables. The hypothesis was that a multi-sensor approach obtained better classification results for lameness than the single sensor and single predictor approaches. Therefore, the objective of this study was to evaluate the classification performances of single predictor variable lameness detection, single sensor lameness detection and multi-sensor lameness detection.
Material and methods
Farm and management
Data were gathered in a commercial dairy farm in Belgium in the period between 1 September 2013 and 19 August 2014. The cows were housed all-year-round indoors in a cubicle barn with slatted floors. The concrete stalls were covered with mattresses and bedded with wood shavings. Cows were fed daily a partial mixed ration based on corn and grass silage. The cows had in the barn free access to feed bunks with electronic cow identification, and additional concentrates were allocated according to the production level. The cows had ad libitum access to water troughs in the barn. The average cow in the herd was of parity 2.2±1.5, and her lactation stage was 206±134 days in milk (DIM). The 208 to 242 Holstein-Friesian cows in the milking herd were divided in two production groups according to production level. The proportional group distribution was on average (high) 3 : 2 (low). The cows were milked two times per day ((0600 to 0830 h) and (1800 to 2015 h)) in a 40-stall DeLaval rotary milking parlour, and the average 305-day milk production was 7205±1842 kg. Before milking, both production groups were brought to the waiting area. An automated mechanic fence divided the groups, and guided the cows towards the rotary. After milking, the cows stepped away from the rotary milking platform, and entered a 20-m long single-lane alley that led them back to the cow shed. At the end of the alley, a spray box disinfected the udder and teats after milking, and a selection gate automatically divided the milking herd in the two production groups and separated cows for treatment from the herd.
Video data acquisition
Video recordings of the cows were made with a 3D image camera (KinectTM; Microsoft Corp., Redmond, WA, USA). The camera was installed in top-down perspective at a height of 345 cm above ground level. Each cow that entered the corridor passed a RFID-antenna (DeLaval AB, Tumba, Sweden). Cow identification triggered the recording of the video. Video recordings were made at 30 frames/s. The recording automatically stopped when a new cow was identified or if the photocell laser-beam of the RFID-unit was cut.
All videos contained a depth recording, that is, for each pixel the distance from the object to the camera in millimetres, and were saved as .oni-files. The recorded videos were named according the timestamp at saving. The OpenNI 1.5 Software Development Kit framework was used to make the recordings with the Kinect camera. After each milking session, a backup of the management data (ALPROTM; DeLaval AB) was copied to the operating computer of the Kinect system to avoid database corruption in the farm computer. For cow ID merging with a video, a query was used to automatically extract the last timestamp of each cow passing the RFID-antenna in the alley from the backup database. A time sequence matching algorithm was used to identify the individual cow in the recorded video (=merging).
Automatic video pre-processing filtered out the videos that contained (a) multiple cows in the video; (b) not enough frames for analysis and (c) an irregular cow gait (stop or run). Detailed video filtering procedures were described by Romanini et al. (Reference Romanini, Bahr, Viazzi, Van Hertem, Schlageter Tello, Halachmi, Lokhorst and Berckmans2013). The algorithm, as described by Viazzi et al. (Reference Viazzi, Bahr, Van Hertem, Schlageter-Tello, Romanini, Halachmi, Lokhorst and Berckmans2014), was used to extract animal-based measures relevant for lameness detection: it automatically segments the cow body in the images, extracts the back spine contour line and calculates the walking speed and back curvature of the cow. The walking speed is quantified as the displacement along the walking direction of the cows of the bounding box surrounding the cow body. The back curvature of the cow is quantified by six feature variables: Θ1 (pronounced as Theta1), Θ2, Θ3, L1-distance, BPM and inverse radius. The entire recording and classification process ((a) trigger the video recording, (b) cow identification, (c) video pre-processing and (d) video analysis) was done automatically.
Existing behaviour and performance sensors on the farm
The milking parlour was equipped with an electronic milk yield meter (MM27BCTM; DeLaval AB) at every milking stand. During each milking, the individual milk yield was measured and expressed in kilograms. The daily milk yield per cow was obtained as the sum of the milk yields of the two milking sessions in the day (morning, evening). In addition, milk conductivity and milk flow rate, measured with IR technology, were also measured in each milking by the same electronic milk yield meter. Daily conductivity and flow rate values were obtained by averaging the values from the two milking sessions. Milking order, expressed as percentiles (zero means first cow; one implies the last cow of the group), was calculated from the milking timestamp that was registered in the management software. Daily milking order was the averaged value in the two daily milk sessions. All cows in the farm were equipped with a neck collar tag (DeLaval Activity Tag; DeLaval AB) used primarily for automated heat detection. Activity related to head movements was a filtered signal expressed by an index ranging from 0 to 255 bits/1-h interval. The activity index was proportional to the number, amplitude and direction of the head movements. The activity data was split in two time frames: daytime activity (0801 to 2000 h) and nighttime activity (2001 to 08.00 h). Basic cow parameters such as lactation stage, expressed as DIM and cow parity were also stored in the management software. All data were transferred automatically during each milking to the herd management software, and reports were extracted from the software in a spreadsheet format (Microsoft Excel; Microsoft Corp., Redmond, WA, USA).
Reference: LS
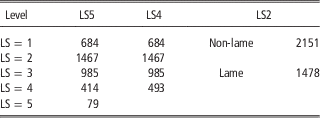
The LS was used as a reference for the lameness detection models. All cows in the milking herd were locomotion scored by two alternating trained and experienced observers. In total 41 locomotion scoring sessions were done spread over time in weekly intervals. The observer was positioned at the end of the corridor behind the spray box, and watched and scored all cows pass in flank view perspective. The LS was based on the discrete five-point numerical score of Sprecher et al. (Reference Sprecher, Hostetler and Kaneene1997) (1=healthy; 5=severely lame). The distribution of the locomotion scores is presented in Table 1. Due to the limited number of severely lame cows (LS=5), the data of the cows scored as LS⩾4 were grouped together as one category for generalized linear mixed model (GLMM) development and evaluation. For logistic regression model development and evaluation, a binary reference is necessary. Therefore, a cut-off threshold was used to divide the dataset in two different groups based on locomotion score: non-lame (LS=(1, 2)) and lame (LS=(3, 4, 5)).
Distribution of five-point numerical LS levels of the 3629 cow-observations

LS=locomotion score; LS5=five-point numerical score: (1)(2)(3)(4)(5); LS4=four-point numerical score: (1)(2)(3)(45); LS2=binary lameness classification: (12)(345).
For the analyses in this study, three different references were used: five-point numerical score (LS5), four-point numerical score (LS4) and binary lameness classification (LS2).
Statistical procedures
For the analysis, 3629 cow-observations were found that had all data available. Cow parity was categorized in three ordinal classes for model development: heifers (first parity cows), young cows (second parity cows) and old cows (third parity and higher). Due to the non-normality of the L1-distance variable, was the logarithm of these data used in the analysis.
Receiver operating characteristics (ROC) curve
The ROC curve is a technique to visualize, organize and select classifiers based on their performance (Fawcett, Reference Fawcett2006). The sensitivity is a measure for the ability of the model in detecting true positive cases (in this case lameness). Specificity is a measure for the ability of the model in detecting true negative cases (in this case non-lame cows). A common method to compare classifiers is to calculate the area under the ROC curve (AUC), which is a portion of the area of the unit square, and hence its value will always be between 0 and 1.0. An area of 1 represents a perfect test. A diagnostic test can be classified as excellent (AUC=(0.9 to 1.0)), good (AUC=(0.8 to 0.9)), fair (AUC=(0.7 to 0.8)), poor (AUC=(0.6 to 0.7)) and fail (AUC=(0.5 to 0.6)), although the interpretation of ROC curves are context specific (Bradley, Reference Bradley1997).
Binary logistic regression
Binary logistic regression is used to predict the outcome of a binary response, in this case lameness (lame v. non-lame), based on one or more predictor variables or features (Hosmer and Lemeshow, Reference Hosmer and Lemeshow2000). The probabilities describing the possible outcome of a single trial are modelled as a function of the explanatory predictor variables, using a logistic function, which always takes values between zero and one (Equation 1).
 $$F(z)={}{{e^{z} } \over {e^{z} {\plus}1}}{=}{1 \over {1{\plus}e^{{{\minus}z}} }}$$
The logistic regression uses a linear combination of the n predictor variables to fit the response variable z (Equation 2).
 $$z\,{=}\,\beta _{0} {\plus}\beta _{1} {\times}x_{1} {\plus}\beta _{2} {\times}x_{2} {\plus}...{\plus}\beta _{n} {\times}x_{n} $$
The logistic regression predicts the probability F(z) of the instance being positive, in this case, being lame (Equation 1). The cut-off threshold to separate the lame from the non-lame cows was set to 0.5. In order to improve model robustness, a stratified 10-fold cross-validation procedure was done. Each fold contained an equal proportion of and distribution of cows according to their five-point level locomotion score. All procedures were performed with the Statistics Toolbox in MATLAB software (MATLAB R2011a; The MathWorks Inc., Natick, MA, USA).
GLMM
As the same herd was locomotion scored 41 times over a period of 10 months, repeated measures in time of the same cow were possible, and they are expected to be positively correlated. This implies the appropriateness of a mixed model with some random effects (cow, parity and group) (McCulloch and Neuhaus, Reference McCulloch and Neuhaus2005). The target of the GLMM (locomotion score) has a non-normal distribution and consists of four levels, so a GLMM with a multinomial logistic distribution and probit link is appropriate. The multinomial logistic regression model interpreted the locomotion scoring as an ordinal outcome variable according to lameness severity. The model allows multiple discrete outcomes (Hosmer and Lemeshow, Reference Hosmer and Lemeshow2000). For this analysis, the 3629 cow-observations were based on 280 individual cows. Therefore, multiple recordings per cow existed, and were considered as repeated measures in the model. The initial model included all main effects of the predictor input variables. Interactions were not considered in the GLMM model. The final fixed factors in the model were determined based on stepwise backward procedure. The exclusion criterion was set to a significance level of α=0.05, indicating that at each step the least significant factor was excluded and only significant factors remained in the model. The GLMM model was developed using IBM SPSS Statistics 21.0 (International Business Machines Corp., Armonk, NY, USA).
Confusion matrix
A confusion matrix was used to evaluate the classification of the GLMM output against the LS reference. In the four-level confusion matrix, both the reference and the model output are tabulated in four levels. On the four-level scale, true positive rates and false positive rates are calculated for each level. The overall accuracy of the model is equal to the trace of the matrix divided by the total sum of all matrix elements.
The binary confusion matrix tabulates the model output and reference in lame and non-lame levels. Cows that were scored as LS=1 and LS=2 were considered as non-lame, and cows that were scored as LS⩾3 were considered as lame. On the binary level, sensitivity, specificity and accuracy are calculated.
Results
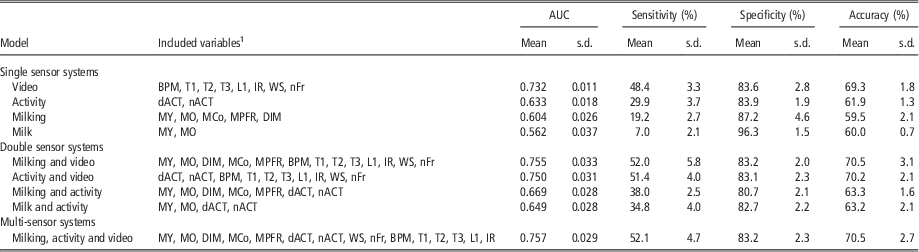
The availability of multiple variables and sensors made multivariate and multi-sensor applications possible. Based on the AUC-values after 10-fold cross validation, the video-based system (AUC=0.732±0.011; mean±standard deviation) performed better in lameness detection than the activity sensing (AUC=0.633±0.018), the milking variable sensors (AUC=0.604±0.026) and the basic milk sensors (0.562±0.037) (Table 2). The multi-sensor classification models that combine different sensor systems are also described in Table 2. When activity data is added to the basic milk detection model (AUC=0.649±0.028) or the extended milking variables model (AUC=0.669±0.028), it outperforms the single sensor detection models of activity (AUC=0.633±0.018) or milk yield and milk constituents (AUC=0.604±0.026). The combination of the video detection system with the milk sensing (AUC=0.755±0.033), the activity sensing (AUC=0.750±0.031) or both activity and milk (AUC=0.757±0.029) were not significantly different from each other.
Classification performance, expressed as sensitivity, specificity, accuracy and AUC, of different binary logistic regression models with different sensor data as input variables

AUC=area under the receiver operating characteristics curve.
Classification performance results were based on 10-fold cross-validation mean and standard deviation (std) values. The analysis included 3629 cow-observations.
1 The included variables in the models are milk yield (MY), milking order (MO), lactation stage (DIM), milk conductivity (MCo), milk peak flow rate (MPFR), daytime activity (dACT), nighttime activity (nACT), number of frames (nFr), walking speed (WS), back posture measure (BPM), Θ1 (T1), Θ2 (T2), Θ3 (T3), L-distance (L1) and inverse radius (IR).
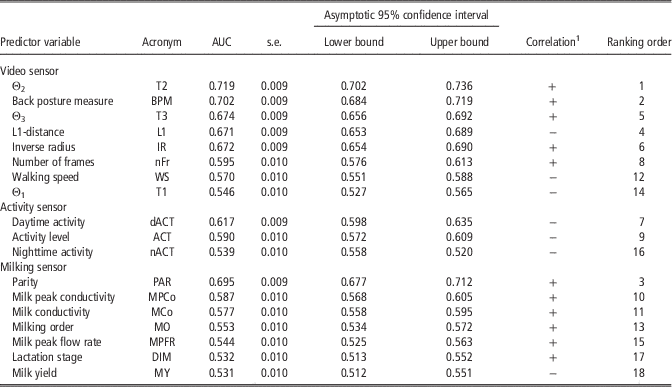
The three sensor systems measure 18 different variables. Table 3 shows the classification performance of these variables as single lameness predictors. All 18 variables showed a significant difference from the null hypothesis that the true area under curve is equal to 0.5. Classification performance is ranging from 0.531 to 0.719. The highest AUC-values were obtained by the variable Θ2 (AUC=0.719), followed by back posture measure (AUC=0.702) and parity (AUC=0.695). The lowest classification performance was obtained by the variable milk yield (AUC=0.531), followed by lactation stage (AUC=0.532) and nighttime activity (AUC=0.461). In general, the variables obtained by the video-based sensor scored better than the activity-related and milk-related variables.
Single predictor lameness classification, expressed as AUC, of 18 input variables for binary lameness detection

AUC=area under the receiver operating characteristics curve.
The asymptotic 95% confidence interval tested the null hypothesis that the true area is equal to 0.5. The ranking order ranks all variables according to their deviation from the null hypothesis (Area=0.5).
1 Positive (+) or negative (−) correlation with target variable lameness.
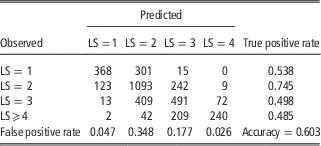
Table 4 shows the confusion matrix of the multivariate GLMM that makes the most significant combination of variables from the three sensor systems (milk, activity and video). The final GLMM model contains seven fixed factors: walking speed, BPM, daytime activity, milk yield, lactation stage, milk peak flow rate and milk peak conductivity. Not included variables turned out to be not significant factors in the model. The variables cow, parity and group were included in the model as random effects. The confusion matrix shows an accuracy of 60.3% on four levels. True positive rates varied between 48.5% and 74.5%, whereas false positive rates varied between 2.6% and 34.8%.
Confusion matrix and classification performance of the GLMM with multinomial logistic regression on four levels

GLMM=general linear mixed model; LS=locomotion score; BPM=back posture measure.
The included fixed factors in the model were walking speed, BPM, daytime activity, milk yield, lactation stage, milk peak flow rate and milk peak conductivity. The random factors in the model were cow, parity and group. The analysis was performed on 3629 cow-observations.
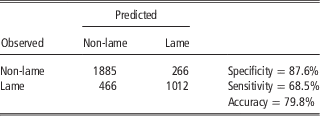
When the results of this table are transformed to a binary level (LS⩽2: non-lame; LS⩾3: lame), the accuracy improves to 79.8% (Table 5). The obtained sensitivity value is 68.5%, whereas the specificity value is 87.6%.
Classification performance of multinomial GLMM with the included fixed factors walking speed, BPM, daytime activity, milk yield, lactation stage, milk peak flow rate and milk peak conductivity, and the random factors cow, parity and group in the model, when transformed to a binary scale with cut-off at LS⩾3 for lameness

GLMM=general linear mixed model; BPM=back posture measure; LS=locomotion score.
The analysis was performed on 3629 cow-observations.
Discussion
In the study of Van Hertem et al. (Reference Van Hertem, Maltz, Antler, Romanini, Viazzi, Bahr, Schlageter-Tello, Lokhorst, Berckmans and Halachmi2013), a lameness detection model based on behaviour and performance variables was developed and obtained a 89% sensitivity and 85% specificity when, as a reference, only lame cows treated by the veterinarian were used. In this study we compare the performance of a model composed of similar behaviour and performance variables against locomotion scoring, rather than against lame treated cows, to a video-based detection system and to a combined performance–behaviour-video model.
As expected, the sensitivity of a combination of milk yield and milk composition sensing with activity measurements was much lower (38.0%±2.5%) than that obtained in the previous study (Van Hertem et al., Reference Van Hertem, Maltz, Antler, Romanini, Viazzi, Bahr, Schlageter-Tello, Lokhorst, Berckmans and Halachmi2013) due to the different reference taken (lame treated cows v. locomotion scored cows), nevertheless, when incorporated into a model including a video-based detection system, it elevated the sensitivity to 52.1%±4.7%, twice as high (25% to 33%) as by farmer observations (Fabian et al., Reference Fabian, Laven and Whay2014), which improves the chances for early lameness detection. Sensitivity of the video-based detection system alone reached 48.4%±3.3%. Similar results were obtained by Van Hertem et al. (Reference Van Hertem, Viazzi, Steensels, Maltz, Antler, Alchanatis, Schlageter-Tello, Lokhorst, Romanini, Bahr, Berckmans and Halachmi2014). Lameness detection based on only milk variables and activity measurements (neck movements) were much lower (19.2%±2.7% and 29.9%±3.7%, respectively).
This study was limited to the behaviour and performance sensors that were already available in our specific farm. Other studies have shown that lameness is also linked with other behaviour and performance sensors, such as ruminating time (Van Hertem et al., Reference Van Hertem, Maltz, Antler, Romanini, Viazzi, Bahr, Schlageter-Tello, Lokhorst, Berckmans and Halachmi2013), lying behaviour (Ito et al., Reference Ito, von Keyserlingk, LeBlanc and Weary2010), and BW (distribution) (Chapinal et al., Reference Chapinal, de Passille, Rushen and Wagner2010; Kamphuis et al., Reference Kamphuis, Frank, Burke, Verkerk and Jago2013). Therefore, classification performance is dependent on the type of behaviour and performance sensors in the multi-sensor approach.
The multi-sensor approach in this study obtained a lameness classification performance of AUC=0.757±0.029. This result is comparable with the study of Kamphuis et al. (Reference Kamphuis, Frank, Burke, Verkerk and Jago2013) who developed a lameness detection model based on sensors monitoring behavioural (activity, milking order) and physiological (live weight) characteristics (AUC=0.74). The multivariate model in the study by Chapinal et al. (Reference Chapinal, de Passille, Rushen and Wagner2010) obtained, however, a better lameness classification performance (AUC=0.83). The best single predictor for lameness, that is, the highest AUC-value, was Θ2 (AUC=0.719) in this study. This result is comparable with the single predictor classification performance of the standard deviation of the weight applied to the rear legs (AUC=0.71) in the study by Chapinal et al. (Reference Chapinal, de Passille, Rushen and Wagner2010). The study by Kamphuis et al. (Reference Kamphuis, Frank, Burke, Verkerk and Jago2013) obtained the highest AUC value for live weight (AUC=0.66), followed by milking order (AUC=0.65) and activity (AUC=0.60). In our study, milking order was less significant (AUC=0.553), whereas the classification performance for activity was similar (AUC=0.410±0.010). The study of Kamphuis et al. (Reference Kamphuis, Frank, Burke, Verkerk and Jago2013) was performed in pasture-based dairy farms, and in those farms the walking distance to and from the milking parlour is usually bigger than for cows kept indoors in cubicle housing.
This study suggests that the back posture (Θ2 and BPM) can give good input for a single prediction and a multivariate-based classification method for lameness in dairy cows. This suggestion is in line with earlier studies, which showed that back curvature was one of the main indicators for locomotion scoring (Sprecher et al., Reference Sprecher, Hostetler and Kaneene1997; Van Nuffel et al., Reference Van Nuffel, Sprenger, Tuyttens and Maertens2009). Back curvature is also considered to be a reliable measure for lameness classification (Blackie et al., Reference Blackie, Bleach, Amory and Scaife2013; Hoffman et al., Reference Hoffman, Moore, Vanegas and Wenz2014).
A GLMM takes into account repeated measures in time of the same individual for classification. In this case, historical data of the individual cow was used to make a final lameness classification. In that case, sensitivity of the GLMM was 68.5% and specificity was 87.6%, whereas the multi-sensor detection model in Table 2 obtained a sensitivity of 52.1%±4.7% and a specificity of 83.2%±2.3%. This shows that a detection model that takes into account individual changes in the variables outperforms the analysis based on group level thresholds. Viazzi et al. (Reference Viazzi, Bahr, Schlageter-Tello, Van Hertem, Romanini, Pluk, Halachmi, Lokhorst and Berckmans2013) showed that an individual analysis improved the detection rate by at least 10% compared to a group analysis.
The transformation of locomotion scores to a binary lame–not lame classification is supposed to have more agronomical value for the farmers, because they want to know when the cow changes from a non-lame to a lame state. Serving as a reference for model development, Schlageter-Tello et al. (Reference Schlageter-Tello, Bokkers, Koerkamp, Van Hertem, Viazzi, Romanini, Halachmi, Bahr, Berckmans and Lokhorst2014a) reported that the binary merging level influences the reliability of the locomotion score. The lowest true positive rates were in this study obtained for the lame cows (LS⩾3). Locomotion score class two had the highest true positive rate, as well as the highest false positive rate. This shows the difficulty in differentiating between mildly lame cows and non-lame cows, which agrees with the findings in previous studies (Van Nuffel et al., Reference Van Nuffel, Vangeyte, Mertens, Pluym, De Campeneere, Saeys, Opsomer and Van Weyenberg2013; Van Hertem et al., Reference Van Hertem, Viazzi, Steensels, Maltz, Antler, Alchanatis, Schlageter-Tello, Lokhorst, Romanini, Bahr, Berckmans and Halachmi2014).
Conclusion
The video-based system for gait and posture measurements is outperforming the behaviour and performance sensing techniques applied in this farm for lameness detection, indicating that it is worthwhile to consider a video-based lameness detection system, regardless if there are other sensors available in the farm. Seven variables (Θ2, BPM, cow parity, L1-distance, Θ3, inverse radius and daytime activity) can be considered as fair single predictors for lameness. A GLMM showed that from the combination of both image, activity and performance sensors, seven variables (walking speed, BPM, daytime activity, milk yield, lactation stage, milk peak flow rate and milk peak conductivity) are sufficient for lameness classification. The accuracy for four-level lameness classification was 60.3%. For binary lameness classification, the GLMM classification performance obtained a sensitivity of 68.5% and a specificity of 87.6%, which is better than the 52.1%±4.7% sensitivity and 83.2%±2.3% specificity of the multi-sensor approach. This shows that the repeated measures analysis in the GLMM, taking into account the individual history of the animal, outperforms the classification based on herd (=statistical population) level thresholds.
Acknowledgements
The authors would like to thank the support and patience of the farmer and other farm personnel when performing the experiments. The authors also thank Ludo Happaerts of M3-BIORES for his technical support when installing the prototype in the farm. This study was part of the EU Marie Curie Initial Training Network BioBusiness (FP7-PEOPLE-ITN-2008) and funded by the Industrial Research Fund (IOFHB/13/0136) of the Flemish Government, which the authors thank for their financial support.