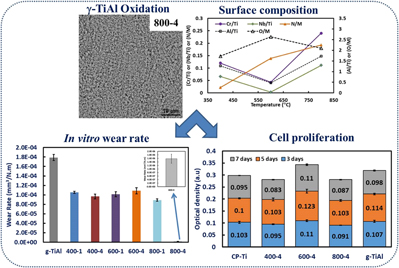
I. INTRODUCTION
Although originally developed for aerospace and other high temperature applications, gamma titanium aluminides (γ-TiAl) are recently being considered as potential load-bearing implant materials due to their low density (3.8 g/cm3) and good corrosion resistance in body fluids.Reference Escudero, Muñoz-Morris, García-Alonso and Fernández-Escalante1–Reference Delgado-Alvarado and Sundaram5 Escudero et al.Reference Escudero, Muñoz-Morris, García-Alonso and Fernández-Escalante1 were the first to consider γ-TiAl for biomedical applications. A comparison of corrosion, in Ringer’s solution, between Ti–6Al–4V alloys and Ti–45Al–2W–0.6Si–0.7B (at.%) TiAl alloys showed that the later alloy exhibits corrosion resistance better than the former alloy.Reference Escudero, Muñoz-Morris, García-Alonso and Fernández-Escalante1 Other alloys such as Ti–15Al and Ti–13.4Al–29Nb (wt.%) have also been evaluated for their electrochemical behavior in simulated body solution (Hank’s solution) at 37.8 °C.Reference Choubey, Basu and Balasubramaniam2 It was observed that both alloys exhibit stable passivity while the Al and Nb addition decreased and increased the passivity, respectively. Rivera-Denizard et al.Reference Rivera-Denizard, Diffoot-Carlo, Navas and Sundaram4 assessed human fetal osteoblast cell functions cultured on γ-TiAl (Ti–48Al–2Cr–2Nb, at.%) and compared their behavior on Ti–6Al–4V alloys. The cell attachment and growth on these two alloys were found to be similar and the synthesis of collagen type I and osteonectin clearly suggests that the biological activity of cells on these alloys is similar. In vivo bone–tissue reactions of this γ-TiAl alloy have been evaluated by Castaneda-Munoz et al.Reference Castaneda-Munoz, Sundaram and Ramirez3 Sprague–Dawley rats implanted with γ-TiAl (Ti–48Al–2Cr–2Nb, at.%) cylinders, up to 180 days, showed normal cortical bone growth over the implants at 45 days, which indicates normal tissue response. At the end of 90 days, the implant was completely enveloped by the bone marrow, which demonstrates in vivo biocompatibility of this γ-TiAl alloy.Reference Castaneda-Munoz, Sundaram and Ramirez3
Further improvements in the cell–materials interactions and corrosion resistance of these γ-TiAl alloys have been attempted by surface modification using plasma electrolytic oxidation, thermal oxidation, and microarc oxidation. For example, the influence of oxidation of Ti–45Al–2W–0.6Si–0.7B (at.%) alloys at 700 °C for 24 h and 1000 °C for 1 h, in air, on corrosion has been examined.Reference Escudero, Muñoz-Morris, García-Alonso and Fernández-Escalante1 The oxidized alloy found to have a thin Al2O3 layer on the surface, which prevented the release of metal ions (Ti and Al) during corrosion in Ringer’s solution. The corrosion current density of the oxidized alloy was two orders of magnitude lower than those recorded on the Ti–6Al–4V alloy.Reference Escudero, Muñoz-Morris, García-Alonso and Fernández-Escalante1 In another study on Ti–48Al–2Cr–2Nb (at.%) alloys revealed that oxidation of the alloy at 500 °C for 1 h in air can significantly increase its corrosion resistance in Ringer’s solution.Reference Delgado-Alvarado and Sundaram5 Thermal oxidation of the same alloy assessed for human osteoblast cell (hFOB 1.19) interactions, using hexosaminidase assay and confocal laser scanning microscopy, showed no toxic effects.Reference Bello, de Jesús-Maldonado, Rosim-Fachini, Sundaram and Diffoot-Carlo6 Recently other surface treatments such as microarc oxidationReference Santiago-Medina, Sundaram and Diffoot-Carlo7 and plasma electrolytic oxidationReference Lara Rodriguez, Sundaram, Rosim-Fachini, Padovani and Diffoot-Carlo8 have been applied to Ti–48Al–2Cr–2Nb (at.%) alloys. The microarc oxidation of γ-TiAl alloys resulted in porous and bioactive oxide layer containing Ca and P, which after 10 days of incubation showed a significant increase in the hFOB 1.19 differentiation in terms of ALP expression.Reference Santiago-Medina, Sundaram and Diffoot-Carlo7 Similarly, plasma electrolytic oxidation of this alloy, in Ca and P containing electrolyte, showed 2 µm thick porous (250–500 nm) rutile and anatase oxide layerReference Lara Rodriguez, Sundaram, Rosim-Fachini, Padovani and Diffoot-Carlo8 which can potentially improve osseointegration.
Considering the processing limitations of γ-TiAl alloys, in spite of their strong potential for biomedical applications, the realization of load-bearing implants from these alloys appears to be difficult. However, additive manufacturing of γ-TiAl alloys proved to be an ideal approach as demonstrated using electron beam melting (EBM),Reference Biamino, Penna, Ackelid, Sabbadini, Tassa, Fino, Pavese, Gennaro and Badini9–Reference Ge, Guo and Lin13 selective laser melting,Reference Löber, Schimansky, Kühn, Pyczak and Eckert14,Reference Gussone, Hagedorn, Gherekhloo, Kasperovich, Merzouk and Hausmann15 and laser metal deposition.Reference Qu and Wang16,Reference Balla, Das, Mohammad and Al-Ahmari17 Among these, EBM has been widely applied to process γ-TiAl alloys but their biological, corrosion, and wear properties have rarely been reported.Reference Mohammad, Al-Ahmari, Balla, Das, Datta, Yadav and Janaki Ram18 Furthermore, the surface modification of EBM-processed γ-TiAl alloys has never been attempted. Therefore, the primary aim of this investigation is to assess the influence of thermal oxidation, in air, of EBM-processed Ti–48Al–2Cr–2Nb (at.%) alloy samples on their microstructural and, in vitro wear, corrosion, and biocompatibility properties.
II. MATERIALS AND METHODS
A. Thermal oxidation of γ-TiAl alloys
γ-TiAl alloy samples (Z15 × X15 × Y5 mm) were fabricated using Ti–48Al–2Cr–2Nb (at.%) powder (Arcam AB, Mülndal, Sweden) in a Arcam A2 machine (Arcam AB, Mölndal, Sweden). The fabrication parameters include 60 kV, 25 mA, 1200 mm/s, and 0.2 mm of acceleration voltage, beam current, scan speed, and beam offset, respectively. Powder bed preheating to 1100 °C was carried out with 8000 mm/s beam scanning rate and 20 mA beam current. The surfaces of the as-fabricated samples (parallel to the build direction, ZX) were ground using a series of emery papers and finally polished on velvet cloth using 0.05 µm Al2O3 suspension. The polished samples were thoroughly cleaned ultrasonically in an acetone bath. The oxidation of the samples was performed in air using standard electrical resistance furnace at 400, 600, and 800 °C for 1 and 4 h. The heating and cooling rate was maintained at 5°C/min. The oxidized samples were denoted as “temperature–time”, i.e., the samples oxidized at 400 °C for 1 h were labeled as 400-1.
B. Thickness and phase constituents of the oxidized alloy
The cross-sectional images recorded using a scanning electron microscope (SEM; Phenom ProX, Phenom-World B.V., Eindhoven, The Netherlands) were used to measure the oxidized layer thickness and an average of at least 10 measurements taken at different locations along the layer length was reported. The composition of the oxidized surface layers was analyzed using X-ray photoelectron spectroscopy (XPS; PHI 5000 VersaProbe II, Physical Electronics Inc., Chanhassen, Minnesota) with the Al-Kα source. Narrow spectra of O1s, Ti2p, Al2p, Cr2p, Nb3d, and N1s were obtained after general surface scan for quantitative analysis. Standard background subtraction and other signal intensity corrections were applied to determine the atomic concentration of the species present in the oxidized surface layers. The constituent phases of the oxidized surfaces were determined using X'Pert Pro MPD diffractometer (XRD; PANalytical, Almelo, the Netherlands) with Cu Kα radiation (1.5405 Å) at 20 kV. The spectra were collected in the 2θ range of 20° to 90° with a step size and time/step of 0.02° and 0.5 s, respectively. The changes in the surface roughness of the samples due to thermal oxidation was measured using a contact profilometer (PGI Series 1500S, Tylor Hobson Ltd., Leicester, United Kingdom). Vickers microhardness measurements (W4303, ESEWAY, Bowers Group, Camberley, United Kingdom) were performed on the top surface of the γ-TiAl alloy samples, before and after oxidation, using 25 g load with a dwell time of 15 s.
C. In vitro wear, corrosion, and biocompatibility study
The in vitro wear resistance of the γ-TiAl alloy samples, before and after oxidation, was determined using a rotating ball-on-disk–type wear testing machine (Nanovea, Irvine, California). All wear tests were performed in freshly prepared simulated body fluid (SBF) at 37 ± 1 °C using Ø 3 mm Al2O3 ball, 5 N normal load, a sliding velocity of 2400 mm/min, and a sliding distance of 500 m. The dimensions of the wear track in terms of depth and width were measured using a contact surface profilometer. The average wear rate [mm3/(N m)] was calculated using wear track depth and width measurements. The corrosion resistance of the samples, in Hank’s balanced salt solution (HBSS), was determined using a potentiostat/galvanostat (SP300, Bio-Logic Science Instruments, Seyssinet-Pariset, France). A standard three-electrode system fitted with the saturated calomel electrode (SCE) reference electrode and platinum mesh counter electrode was used. The γ-TiAl alloy samples were used as the working electrode. The samples were ultrasonically cleaned in acetone before corrosion testing. An idle time of 1 h was used to obtain stable open-circuit potential (OCP) followed by voltage ramping between −0.25 and +1.6 V versus OCP at a scanning rate of 10 mV/min. Tafel extrapolation was used to determine the corrosion potential (E corr) and corrosion current (I corr). The surface damage due to corrosion and wear of the samples was also assessed using SEM.
The cytotoxicity of thermally oxidized γ-TiAl alloy samples was assessed using a mouse embryonic fibroblast cell line (MC3T3) with MTT [3-(4,5-dimethylthiazol-2-yl)-2,5-diphenyltetrazolium bromide salt] assay. Commercially pure titanium (Ti) was used as control. All the samples were sterilized at 121 °C for 20 min at 15 psi saturated vapour pressure in an autoclave. Triplicate samples were placed in a 24-well plate and seeded with 5 × 10⁴ cells/well. Following the standard protocol,Reference Mohammad, Al-Ahmari, Balla, Das, Datta, Yadav and Janaki Ram18 MTT assay was performed after 3, 5, and 7 days of culture. MTT assay data were analyzed statistically using Student’s t-test and P < 0.05 was considered statistically significant.
III. RESULTS AND DISCUSSION
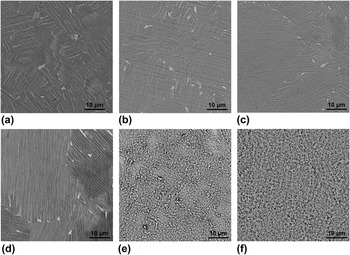
The changes in the surface morphology of thermally oxidized γ-TiAl were observed using SEM and are shown in Fig. 1. No visible change in the surface topography was observed on the same samples oxidized at 400 and 600 °C for 1 and 4 h, as shown in Figs. 1(a)–1(d). Since the severity and kinetics of oxidation would be low during 1–4 h of soaking at these low temperatures, we could not see distinguishable changes in the surface microstructural features of the samples. However, increasing the oxidation temperature and time appears to increase the grain size of these samples. For example, a significant increase in the grain size can be seen from Fig. 1(a) at 400 °C for 1 h and Fig. 1(c) at 600 °C for 1 h. Although small, similar grain coarsening was also observed with an increase in the oxidation duration, as shown in Figs. 1(a) and 1(b). The increase in the scale of microstructural features with temperature and time is intuitive. Significant differences in the surface microstructures were observed on the γ-TiAl alloy samples oxidized at 800 °C, as shown in Figs. 1(e) and 1(f). The surface became rough and porous with isolated regions of less porosity on the samples oxidized at 800 °C for 1 h [Fig. 1(e)]. When the soaking duration was increased to 4 h at 800 °C, the amount of porosity and scale of microstructural features appear to increase, as shown in Fig. 1(f). The changes in the surface microstructural features at 800 °C are attributable to the increased reaction kinetics and formation of multiple oxides and/or nitrides of Ti, Al, Cr, and Nb present in the γ-TiAl alloy samples.
Top surface microstructures of the oxidized γ-TiAl alloy samples: (a) 400-1, (b) 400-4, (c) 600-1, (d) 600-4, (e) 800-1, and (f) 800-4.

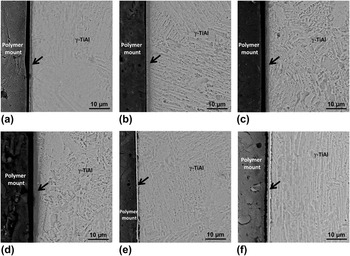
The influence of oxidation temperature and time on the oxidized layer/region of the γ-TiAl alloy is shown in Fig. 2. All the samples showed clear and distinguishable interface between the substrate and oxidized regions. However, the oxidized regions in the samples treated at 800 °C were relatively bright with some topographical relief, shown in Figs. 2(e) and 2(f), indicating that these might be of different composition and hardness. The cross-sectional microstructures of the samples oxidized at 400 and 600 °C revealed the absence of cracks and other defects, as shown in Figs. 2(a)–2(d). However, some interfacial porosity was observed when the oxidation temperature was increased to 800 °C, as shown in Figs. 2(e) and 2(f). The formation of interfacial defects at high oxidation temperature could be due to (i) volume changes associated with the formation of multiple oxides/nitrides on the surface, (ii) large difference in the coefficient of thermal expansion of the substrate and the oxide/nitride surface layers, and (ii) sectioning and grinding-generated stresses during preparation of the samples for microstructural observations. Excessive diffusion of oxygen or nitrogen at high temperatures is also thought to be responsible for pore formation due to condensation of vacancies.Reference Pemsler19 High concentration of oxygen during laser-assisted oxidation of Zr was also reported to induce severe pores and cracks in the surface oxide layers.Reference Balla, Xue, Bose and Bandyopadhyay20
Cross-sectional microstructures of thermally oxidized γ-TiAl alloy samples showing variations in oxidized layer thickness (a) 400-1, (b) 400-4, (c) 600-1, (d) 600-4, (e) 800-1, and (f) 800-4. The arrow indicates the oxidized layer/region.

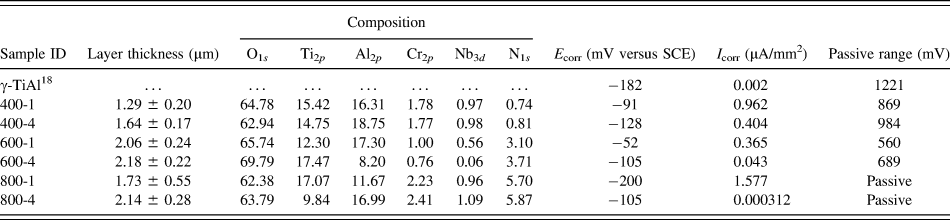
The thickness of the oxidized layer, measured from the cross-sectional SEM images, is summarized in Table I. Under present experimental conditions, the depth of oxidation varied between 1.29 ± 0.2 and 2.18 ± 0.2 μm. In general, the oxidation temperature had strong influence on the layer thickness compared to oxidation time. The thickness of the oxidation increased by 0.24-fold, from 1.73 to 2.14 μm, with an increase in the oxidation duration from 1 to 4 h at 800 °C. However, the thickness increased from 1.29 to 1.73 μm, almost 0.34-fold increase, when the oxidation temperature was increased from 400 to 800 °C. This trend can be explained based on the general effects of temperature and time on oxidation kinetics of metals/alloys in air. One interesting observation is that the oxidized layer did not increase significantly when the temperature was increased from 600 to 800 °C, while ∼0.6-fold increase in the thickness was recorded with the temperature increase from 400 to 600 °C at 1 h soaking. The formation of oxygen-rich or oxide layer during early stages of oxidation decreases further diffusion of oxygen through it to form thicker layers. Therefore, the growth of oxide layer depends on constant supply of oxygen, diffused from the surface towards the oxide–substrate interface, which is controlled by the rate of oxygen diffusion through the initial oxygen-rich/oxide layer formed on the surface of the γ-TiAl samples. The oxidized regions of the samples treated at 800 °C exhibited some topographical relief [Figs. 2(e) and 2(f)], suggesting considerable differences in the composition and hardness.
Thickness, composition (at.%), and corrosion results of the γ-TiAl samples.

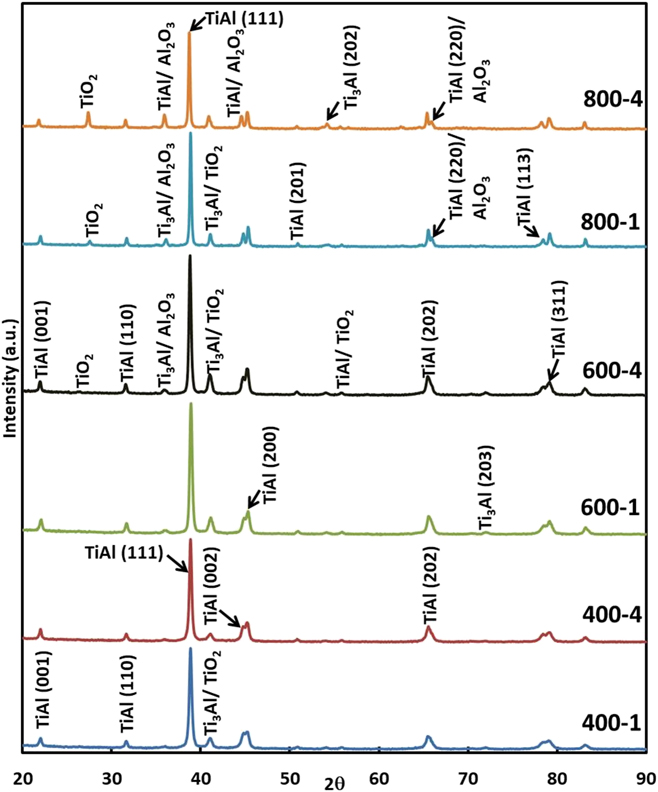
The formation of different phases on the surface of the γ-TiAl alloy samples oxidized at different temperatures and times, analyzed using XRD, is presented in Fig. 3. Clear peaks corresponding to oxides were not observed in 400-1, 400-4, and 600-1 samples. No visible secondary phase/precipitates were observed on the surface of these samples. Therefore, the reaction layers, Figs. 2(a)–2(c), could be termed as diffusion zones comprising solid solution of γ-TiAl with dissolved oxygen/nitrogen. The formation of oxides appears to form in the samples oxidized at 600 °C for 4 h, 800 °C for 1 and 4 h. The major phases identified on these sample surfaces were TiAl, Ti3Al, Al2O3, and TiO2, as shown in Fig. 3. The intensity of oxide peaks increased with increasing oxidation temperature from 600 to 800 °C, indicating an increase in their concentration.
Phase constituents of the oxidized γ-TiAl alloy determined using XRD.

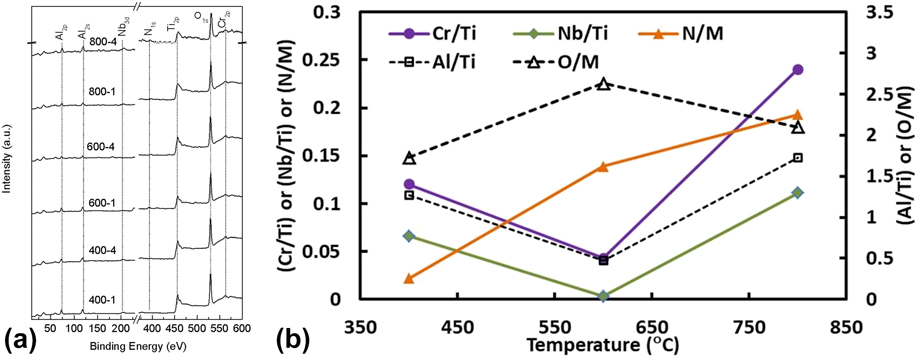
The XPS spectra of oxidized surfaces of γ-TiAl are shown in Fig. 4(a). The O1s spectra centered around 530 eV correspond to the formation of various oxides on the surfaces of the γ-TiAl alloy samples after oxidation. The spectra of Al2p with a binding energy of 74 eV suggest the formation of Al2O3 on these samples. Similarly, the Ti2p spectra with 458.6 eV can be assigned to the formation of TiO2. Formation of Cr2O3 can be seen from the 577.6 eV peak of Cr2p. Some weak peaks corresponding to Nb3d and N1s were also observed on these samples. The peak at ∼206 eV could be attributable to the formation of Nb2O5. The weak spectra of N1s might be due to the formation of nitrides of Ti and/or Cr. The surface atomic composition determined using XPS is presented in Table I. To understand the variations in the formation of various oxides at different temperatures, elemental ratios were calculated and the results are shown in Fig. 4(b). The increase in the ratio of O/M (oxygen to metal) between 400 and 600 °C indicates the formation of various oxides on the surface. However, at 800 °C, the O/M ratio decreased and a gradual increase in the N/M (nitrogen to metal) ratio was observed, which suggest that with an increase in the oxidation temperature, the formation of nitrides increases. In general, the formation of oxides and nitrides of Al, Cr, and Nb increased with oxidation parameters. The highest Al/Ti ratio indicates that the oxidized γ-TiAl alloy consists of Al2O3 as major phase followed by Cr2O3 and Nb2O5.
(a) XPS spectra of O1s, Ti2p, Al2p, Cr2p, Nb3d, and N1s measured from the surface of the oxidized γ-TiAl alloy and (b) influence of oxidation temperature, at 4 h soaking, on the elemental ratio of oxidized γ-TiAl alloy surfaces.

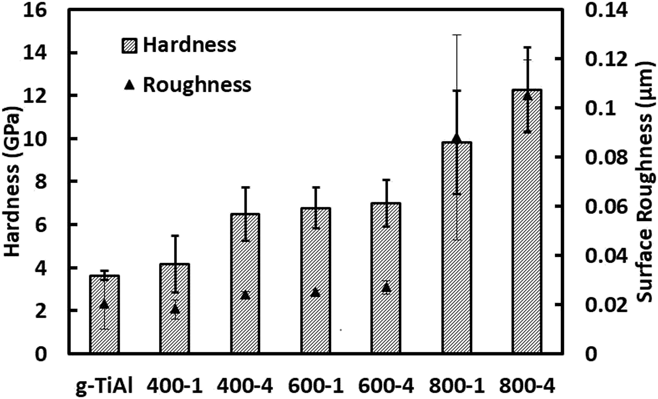
The surface microstructural analysis, shown in Fig. 1, indicates significant changes in the surface morphology at 800 °C. Therefore, the surface roughness of the γ-TiAl alloy samples was measured before and after thermal oxidation, and the results are presented in Fig. 5. Before oxidation, the surface roughness (Ra) of the samples was 0.02 ± 0.01 µm and after oxidation, the roughness varied between 0.018 and 0.105 µm. The standard deviation of the samples after oxidation was low due to the formation of thick and continuous oxide layer on the surface of these samples. However, the roughness variation appears to be high in the samples oxidized at 800 °C due to the formation of porous surface features, as shown in Figs. 1(e) and 1(f). The average surface roughness increased with increasing oxidation temperature. The samples oxidized at 800 °C for 4 h exhibited a highest roughness of 0.105 ± 0.014 µm followed by 800-2 samples with 0.088 ± 0.042 µm. Other samples (400-1, 400-4, 600-1, and 600-4) exhibited very small change in the roughness, which is in line with observed minimal changes in the surface microstructures shown in Fig. 1. The increase in the surface roughness of high-temperature oxidized samples is believed to be due to volume changes associated with the formation of various ceramic phases such as oxides/nitrides of Ti, Al, Cr, and Nb. The volume changes, due to the formation of oxides/nitrides, can result in changes in the surface topography/relief, which are directly reflected in terms of observed increase in the surface roughness. A similar increase in the surface roughness has been reported due to tetragonal-to-monoclinic transformation in zirconia which is associated with 3–5% volume increase.Reference Liang, Kawanabe, Ise, Iida and Nakamura21,Reference Perrichon, Liu, Chevalier, Gremillard, Reynard, Farizon, Liao and Geringer22
Top surface hardness and surface roughness of the γ-TiAl alloy samples before and after oxidation.

The influence of oxidation on top surface hardness of the γ-TiAl alloy samples is shown in Fig. 5. The hardness of the γ-TiAl alloy, before oxidation, was 3.62 ± 0.21 GPa, which increased to a range of 4.16 and 12.26 GPa after oxidation. The formation of different ceramic phases (oxides and nitrides of Al, Ti, Cr, and Nb) on the surface increased the hardness of the γ-TiAl alloy after oxidation in air. The oxidation temperature had stronger influence on the surface hardness than oxidation time. With 1 h soaking, the hardness increased by 0.79, 0.87, and 1.71-fold at oxidation temperature of 400 °C, 600 °C, and 800 °C, respectively. Further improvements were recorded with a longer soaking time of 4 h and a maximum of 2.37-fold increase was exhibited by 800-4 samples. The variation in the top surface hardness of the samples is attributable to the changes in the concentration of different phases in the surface films formed at different temperatures and times.
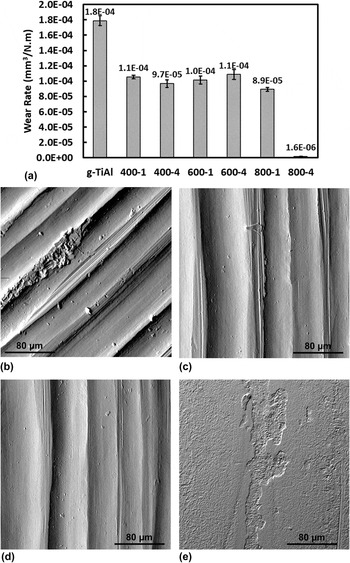
The average wear rate [mm3/(N m)] of the γ-TiAl alloy samples after thermal oxidation was compared with the unoxidized alloy in Fig. 6(a). Overall, the wear rate of the γ-TiAl alloy decreased significantly after oxidation. The wear rate of 800-4 samples was found to be 1.58 ± 0.25 × 10⁻⁶ mm3/(N m), which is two orders of magnitude lower than that of the γ-TiAl alloy before oxidation [1.79 × 10⁻⁴ mm3/(N m)]. The samples oxidized at other temperatures and times showed a wear rate in the range of 1.09 × 10⁻⁴ to 8.9 × 10⁻⁵ mm3/(N m), which is 0.39–0.50-fold lower than the unoxidized γ-TiAl alloy. These results suggest that the oxidation of the γ-TiAl alloy at temperatures ≤600 °C does not increase its wear resistance significantly in SBF. Although small, the increase in the wear resistance of the oxidized γ-TiAl alloy can be attributable to their higher hardness than the unoxidized γ-TiAl alloy. The wear track morphology of present samples was analyzed using SEM to understand the wear mechanism in SBF. As shown in Fig. 6(b), the wear tracks of the unoxidized γ-TiAl alloy revealed wide and deep grooves, which were similar to those observed on 400-4 and 600-4 samples, as shown in Figs. 6(c) and 6(d), respectively. These features suggest that these samples worn via abrasive-type wear. A significantly different wear track morphology was exhibited by 800-4 samples [Fig. 6(e)]. Wear tracks with shallow and distinct grooves were observed on these samples. However, oxide layers on 800-4 samples found to tear and spall as a result of shearing forces during wear. The spalling of the oxide layers could also be due to their porous nature, shown in Figs. 1(e) and 1(f), and the presence of interfacial defects, shown in Figs. 2(e) and 2(f). However, due to their high hardness, these samples exhibited lowest wear rate among all the samples. Overall, present in vitro wear results suggests that thermal oxidation can increase the wear resistance of the γ-TiAl alloy; however, further investigations are required to eliminate the surface porosity and roughness of oxide layers formed after oxidation at 800 °C.
(a) Wear rate of untreated and thermally oxidized γ-TiAl samples in SBF at 37 ± 1 °C. (b–e) Wear track morphologies of (b) unoxidized γ-TiAl (c) 400-4, (d) 600-4, and (e) 800-4.

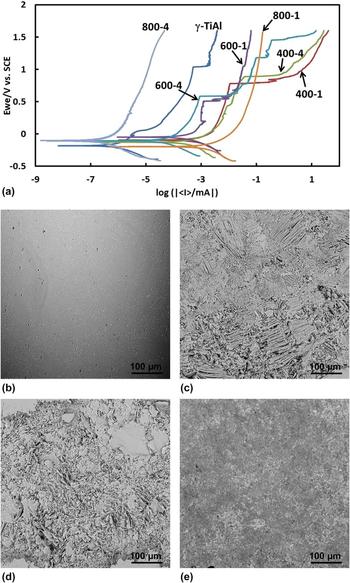
In vitro stability of the oxidized γ-TiAl alloy was assessed in HBSS using potentiodynamic polarization tests, and typical Tafel plots thus generated are shown in Fig. 7(a). It was observed that the passivity of the γ-TiAl alloy, Table I, decreases due to oxidation at 400 and 600 °C. The passive range (difference between breakdown potential and zero current potential)Reference Mohammad, Al-Ahmari, Balla, Das, Datta, Yadav and Janaki Ram18 of the γ-TiAl alloy decreased from 1221 mV to a range between 560 and 984 mV after oxidation at ≤600 °C. The decrease in the passivity of these samples could be due to the absence of the sufficiently thick surface oxide layer. However, the samples oxidized at 800 °C exhibited complete passivity, i.e., no evidence of passivity breakdown up to 1.60 V. The superior passivity of 800-1 and 800-4 samples can be attributable to the formation of thick oxide layer, which act as a barrier between the substrate and the HBSS. Furthermore, the porous nature of these oxide layers would have enhanced the chemisorption of moieties from HBSS on these surfaces, thus forming passive surface layers. The corrosion potential (E corr) and corrosion current (I corr) of the samples, derived from Tafel plots, are summarized in Table I. The E corr of the γ-TiAl alloy before oxidation was −182 mV versus SCE, which increased to a range between −52 and −200 mV versus SCE after oxidation in air. The nobler E corr of the oxidized γ-TiAl alloy indicates that it is relatively difficult to initiate corrosion on these samples compared to unoxidized alloy samples. However, thermal oxidation appears to increase the I corr of all the samples, except 800-4. Therefore, the rate of corrosion of these samples is expected to be higher than that of the bare γ-TiAl alloy. From the present results, the exact influence of oxidation temperature and time could not be identified. However, oxidation at 800 °C for 4 h is found to improve the overall corrosion resistance of the γ-TiAl alloy in HBSS due to its lowest I corr. Typical surface damage after corrosion testing of the γ-TiAl alloy in HBSS is shown in Figs. 7(b)–7(e). Unoxidized γ-TiAl alloy samples showed minimal surface damage with isolated pits among all the samples. Both 400-4 and 600-4 samples showed severe corrosion on the surface, while the 800-4 samples exhibited significantly less surface damage. The damage appears to be nonuniform and some regions of severe corrosion were observed on 400-4 and 600-4 samples. These variations are attributable to the differences in the corrosion behavior of microstructural features of the γ-TiAl alloy consisting of less and more corrosion resistant γ-TiAl and Ti3Al phases, respectively.Reference Mohammad, Al-Ahmari, Balla, Das, Datta, Yadav and Janaki Ram18 The samples oxidized at 800 °C for 4 h with thick oxide layer showed good resistance to corrosion with minimal surface damage as shown in Fig. 7(e).
(a) Typical potentiodynamic polarization curves. (b–e) Typical surface damage of the γ-TiAl alloy samples after corrosion testing in HBSS, (b) unoxidized γ-TiAl (c) 400-4, (d) 600-4, and (e) 800-4.

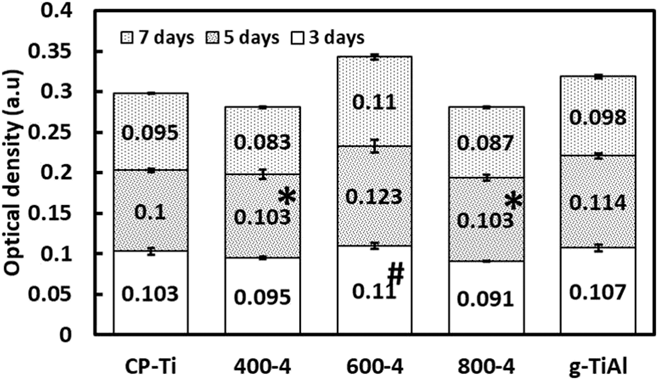
To evaluate the influence of thermal oxidation on cytotoxicity of the γ-TiAl alloy, MTT assay was performed using MC3T3 cells and the cell proliferation on different samples is shown in Fig. 8. All the samples showed gradual increase in the cell proliferation with an increase in the culture duration. The statistical analysis of the results, using Students t-test, revealed significant differences (P < 0.05) in the cell densities between majority of the oxidized γ-TiAl alloy samples and CP-Ti. The cells found to grow rapidly on the oxidized γ-TiAl alloy during early time period of 3 and 5 days. A significant increase in the cell density was exhibited at day 5 on all the oxidized samples. More importantly, the oxidation of the alloy appears to promote rapid cell adhesion and proliferation compared the same alloy before oxidation. The presence of different oxides on the oxidized γ-TiAl alloy, due to their high wettability than metals, is responsible for observed enhancement in the cell proliferation. Present in vitro results clearly demonstrate that the oxidation of the γ-TiAl alloy promotes cell proliferation and the surfaces are nontoxic.
In vitro MC3T3 cell proliferation on different γ-TiAl samples. P < 0.05 for all the samples except *P > 0.05 compared to CP-Ti, # P > 0.05 compared to γ-TiAl.

IV. CONCLUSIONS
Oxidation of an electron beam melted γ-TiAl alloy (Ti–48Al–2Cr–2Nb) in air, at different temperatures (400, 600, and 800 °C) for 1 and 4 h, resulted in 1.29–2.18 µm thick surface oxide layers. Highly porous and rough surfaces were formed when the alloy was oxidized at 800 °C. The XRD analysis showed the presence of Al2O3 and TiO2 in the oxidized surfaces, while the XPS analysis revealed the presence of oxides of Nb and Cr as well, with small amount of TiN, especially on the samples oxidized at 800 °C. The oxidation increased the hardness up to 12.26 GPa and a lowest wear rate of 1.58 ± 0.25 × 10⁻⁶ mm3/(N m) was recorded with the samples oxidized at 800 °C for 4 h. Although the oxidation found to shift the corrosion potentials toward nobler direction, the corrosion current of the oxidized γ-TiAl alloy was higher than that of the unoxidized alloy. In vitro cell culture experiments demonstrated that oxidation of the γ-TiAl alloy does not induce any toxic effect and significantly enhances the cell proliferation. However, further investigations are required to reduce the roughness and porosity of oxidized samples so that they can be used as potential wear resistant implants.
ACKNOWLEDGMENTS
The authors would like to acknowledge the financial support from Council of Scientific and Industrial Research (CSIR), New Delhi, India, through project ESC0103. Ms. Ipsita Som is thankful to the Director, CSIR-CGCRI, Kolkata, for permission to carry out her M. Tech dissertation research at CSIR-CGCRI. We are thankful to Dr. Ashfaq Mohammad, Advanced Manufacturing Institute, King Saud University, Saudi Arabia, for fabricating γ-TiAl alloy samples using EBM.