1. Introduction
Interest in innovative X-ray sources, ultra-intense and ultra-short, is currently a hot topic. Nearly ten years ago the experimental evidence of betatron radiation (Rousse et al. Reference Rousse2004) emitted by electrons accelerated in laser plasma channels opened new perspectives in that direction. Subsequently, both experimental and theoretical efforts were made towards a better understanding of this phenomenon, which has been studied in more than one laser–plasma interaction regime (Esarey et al. Reference Esarey2002; Glinec et al. Reference Glinec2008; Cipiccia et al. Reference Cipiccia2011). In this work we wanted to consider the characteristics of the betatron radiation emitted during electron laser–plasma acceleration at the LNF laser facility. In particular, we are interested in the case where, in the so-called bubble regime, the oscillating electric field of the laser radiation resonantly influences the transversal oscillation of the accelerated electrons. It can occur when the laser tail significantly penetrates the plasma bubble and the electrons experience an electric laser field which is greater (sometimes much greater) than the electrostatic focusing field provided by the positive charge inside the bubble. This condition induces beneficial effects in the emitted betatron radiation, increasing the intensity and moving the centre of the emission spectrum towards higher frequencies. This is due to an increase in the betatron oscillation amplitude together with a blue-shift of the oscillation frequency, which in some cases can be approximately equal to a harmonic of the betatron frequency, determined by the plasma density and the accelerated electron energy. The calculations were carried out following an analytical method modified by reasonable approximations that adapt to situations of interest for experiments in the process of programming at the LNF. These results will certainly help in the design of these experiments and in particular of diagnostics dedicated to the detection of high-energy electromagnetic radiation.
2. Laser-driven betatron oscillations
Cipiccia et al. (Reference Cipiccia2011) consider the existence of three regimes of laser-driven betatron oscillations: non-resonant, weakly resonant and strongly resonant. In that work the three different regimes were explored by varying the plasma electron density. In fact, by relating the plasma bubble radius
 $R\sim 2c\sqrt{a_{0}}/{\it\omega}_{p}$
to the plasma electron density (Lu, Tzoufras & Joshi Reference Lu, Tzoufras and Joshi2007) via the plasma frequency
 ${\it\omega}_{p}=(n_{e}e^{2}/{\it\varepsilon}_{0}m_{e})^{1/2}$
, the extension of the driver laser pulse tail inside the bubble can be set by controlling the dimension of the bubble with respect to the laser pulse length. The normalized vector potential
 $a_{0}\sim 8.5\times 10^{-10}\sqrt{I_{0}\,(\text{W }\,\text{cm}^{-2})\,{\it\lambda}_{0}\,({\rm\mu}\text{m })^{2}}$
is related to the laser intensity
 $I_{0}$
and wavelength
 ${\it\lambda}_{0}$
. Here
 $c$
is the velocity of light in a vacuum,
 $n_{e}$
is the plasma electron density,
 $e$
is the elementary charge,
 ${\it\varepsilon}_{0}$
is the vacuum dielectric constant, and
 $m_{e}$
is the electron mass. The three regimes are differentiated according to the interaction between the laser tail and the accelerated electrons. In the non-resonant regime the electrons do not interact with the laser pulse, so they undergo betatron oscillations due only to the restoring force field provided by the positive charges inside the bubble. In the weakly resonant regime the electrons start to interact with the laser pulse, and the form of their oscillations begins to deviate from the previous case. In the strongly resonant regime the betatron oscillations are completely driven by the laser electromagnetic field. One of the most interesting results of Cipiccia et al. (Reference Cipiccia2011) is that all three regimes can occur around the dephasing point, where the energy of the accelerated electrons can be considered approximately constant, before they start to decelerate. The electron motion around the dephasing point becomes (Esarey et al.
Reference Esarey2002)
 $$\begin{eqnarray}\displaystyle \left.\begin{array}{@{}c@{}}x(t)=\displaystyle r_{{\it\beta}}\sin {\it\omega}_{{\it\beta}}t,\\ z(t)=\displaystyle z_{0}+v_{z0}\left(t-\frac{k_{{\it\beta}}^{2}r_{{\it\beta}}^{2}}{4}t-\frac{k_{{\it\beta}}^{2}r_{{\it\beta}}^{2}}{8{\it\omega}_{{\it\beta}}}\sin 2{\it\omega}_{{\it\beta}}t\right),\!\end{array}\right\} & & \displaystyle\end{eqnarray}$$
where
 $x(t)$
is the transverse coordinate and
 $z$
the longitudinal one, along the laser axis;
 $r_{{\it\beta}}$
is the betatron oscillation amplitude,
 $z_{0}$
is the initial
 $z$
coordinate,
 $v_{z0}$
is the initial longitudinal velocity,
 $k_{{\it\beta}}$
and
 ${\it\omega}_{{\it\beta}}$
are the betatron wave number and frequency respectively, where
 ${\it\omega}_{{\it\beta}}={\it\omega}_{p}/\sqrt{2{\it\gamma}_{max}}$
, and
 ${\it\gamma}_{max}$
is the Lorentz factor of the accelerated electron at the point of maximum energy gain, which corresponds to the dephasing point. The relative motion between the accelerated electrons and the laser pulse is responsible for a red Doppler-shift of the laser frequency, as witnessed by the electrons. We consider the interaction of an electron with an electromagnetic plane wave whose phase is
 ${\it\xi}={\it\omega}_{0}(t-z(t)/v_{{\it\phi}})$
, where
 ${\it\omega}_{0}$
is the wave (laser) pulsation and
 $v_{{\it\phi}}\sim c(1+{\it\omega}_{p}^{2}/2{\it\omega}_{0}^{2})$
its phase velocity in the plasma. By writing
 $z\sim v_{z}t$
, the shifted frequency becomes
 $$\begin{eqnarray}{\it\omega}_{s}={\it\omega}_{0}\left(1-\frac{v_{z}}{v_{{\it\phi}}}\right).\end{eqnarray}$$
By using the fact that
 ${\it\beta}_{z}\sim 1-1/2{\it\gamma}_{max}^{2}$
and
 ${\it\omega}_{p}\ll {\it\omega}_{0}$
, it is straightforward to show that
 $$\begin{eqnarray}{\it\omega}_{s}\sim {\it\omega}_{0}\left(\frac{1}{2{\it\gamma}_{max}^{2}}+\frac{{\it\omega}_{p}^{2}}{2{\it\omega}_{0}^{2}}\right).\end{eqnarray}$$
For the calculation we are going to show, which corresponds to the experimental conditions attainable with the FLAME laser at Frascati National Laboratories (LNF), the condition
 ${\it\omega}_{p}^{2}/2{\it\omega}_{0}^{2}\gg 1/2{\it\gamma}_{max}^{2}$
holds. Therefore the laser red-shift frequency, as witnessed by the accelerated electrons around the dephasing point, becomes
 ${\it\omega}_{s}\sim {\it\omega}_{p}^{2}/2{\it\omega}_{0}$
. By using the fact (Lu et al.
Reference Lu, Tzoufras and Joshi2007) that
 ${\it\gamma}_{max}\sim a_{0}2{\it\omega}_{0}^{2}/3{\it\omega}_{p}^{2}$
, we obtain
 ${\it\omega}_{p}^{2}={\it\omega}_{0}{\it\omega}_{{\it\beta}}\sqrt{4a_{0}/3}$
, i.e.
 $$\begin{eqnarray}{\it\omega}_{s}\sim \sqrt{\frac{a_{0}}{3}}{\it\omega}_{{\it\beta}}.\end{eqnarray}$$
Equation (2.4) shows that when the laser tail provides the electrons with a significant driving force, the transverse oscillations shift in frequency from
 ${\it\omega}_{{\it\beta}}$
to
 ${\it\omega}_{s}$
. In fact, as shown in Nemeth et al. (Reference Nemeth2008), the driving force imposes its frequency on the electron oscillatory motion. In the present work we show, in agreement with the simulation and experiment in Cipiccia et al. (Reference Cipiccia2011), that the frequency of the driven oscillations is related to both the local laser intensity and the betatron frequency, enabling the relativistic Doppler-shift of the laser frequency to be harmonics of the betatron frequency, with a consequent efficient exchange of energy between the electrons and the laser. A model of the transverse trajectory in the interaction regime is described, which could be useful for fast calculation of the emitted radiation without numerical integration of the equations of motion. Furthermore, (2.4) could be useful for setting the experimental conditions for an efficient laser-driven betatron motion. The laser intensity experienced by the electrons varies with time (it grows for
 ${\it\gamma}_{max}>{\it\omega}_{0}^{2}/{\it\omega}_{p}^{2}$
); the resonance between the laser-shifted frequency and the harmonics of the betatron frequency then develops, with the possibility that
 ${\it\omega}_{s}$
resonates with higher harmonics of
 ${\it\omega}_{{\it\beta}}$
. The laser action on the accelerated electrons is dual: when the electrons experience an intense driving electromagnetic field, their oscillation amplitude can be strongly enhanced; furthermore, for
 ${\it\omega}_{s}>{\it\omega}_{{\it\beta}}$
the betatron oscillation frequency increases. Both effects can play a significant role in determining an important shift of the radiation spectra towards higher energies. In fact the so-called critical energy
 $E_{c}\sim 3{\it\gamma}_{max}^{3}\hbar{\it\omega}_{{\it\beta}}^{2}r_{{\it\beta}}/c$
, i.e. the value of the photon energy which separates the radiation spectrum into two parts corresponding to the same amount of radiated energy below and above it, grows as the square of the betatron frequency and is linear in the betatron oscillation amplitude. Let us consider an electron at rest with respect to the laboratory frame: in order to be more important than the betatron motion, the quivering motion should occur in such a way that
 $a_{0}\gg r_{{\it\beta}}k_{0}$
. For typical values of the parameters
 $k_{0}$
and
 $r_{{\it\beta}}$
,
 $a_{0}$
should be an order of magnitude greater, which is not currently achievable for any laser system. Therefore the laser electric field is in fact never greater than the wakefield transverse field. Nevertheless, due to the relative motion between the laser and the electrons, the effective
 $a_{0}$
as witnessed by the electrons is Doppler-shifted to larger values, enabling the enhancement of the driven oscillation amplitude. The Doppler-shifted
 $a_{0}$
is calculated by substituting the laser pulsation
 ${\it\omega}_{0}$
with the Doppler-shifted pulsation
 ${\it\omega}_{s}$
, i.e.
 $a_{0}^{\prime }\sim eE/mc{\it\omega}_{s}$
. Here
 $E=E_{0}\,\exp [-(2R)^{2}/(\sqrt{2}v_{g}{\rm\Delta}{\it\tau})^{2}]$
takes into account the tail of the electric field of a laser Gaussian pulse
 $E=E_{0}\,\exp [-(z(t)-2R-v_{g}t)^{2}/(\sqrt{2}v_{g}{\rm\Delta}{\it\tau})^{2}]$
at the centre of the bubble, where the electrons start to interact with the laser tail;
 $v_{g}$
is the laser group velocity inside the plasma. The new relativistic parameter
 $a_{0}^{\prime }$
can be expressed in terms of
 $a_{0}=eE_{0}/mc{\it\omega}_{0}$
by so using the expression for
 ${\it\omega}_{s}$
:
 $a_{0}^{\prime }\sim \sqrt{6a_{0}{\it\gamma}_{max}}{\it\omega}_{0}/{\it\omega}_{p}\exp [-(2R)^{2}/(\sqrt{2}v_{g}{\rm\Delta}{\it\tau})^{2}]$
. As soon as the electrons pass the bubble centre, their distance from the bubble head (which at the centre of the bubble is
 $R$
), i.e. the centre of the laser, becomes smaller and the Gaussian part of
 $a_{0}^{\prime }$
can grow very rapidly by an order of magnitude. In fact the evolution of
 $a_{0}^{\prime }$
can be evaluated via
 $$\begin{eqnarray}a_{0}^{\prime }(t)\sim \sqrt{6a_{0}{\it\gamma}(t)}{\it\omega}_{0}/{\it\omega}_{p}\exp [-(z(t)-2R-v_{g}t)^{2}/(\sqrt{2}v_{g}{\rm\Delta}{\it\tau})^{2}].\end{eqnarray}$$
The transverse excursion of an electron initially at rest in a laser pulse with
 $a_{0}=10$
is about
 $1~{\rm\mu}\text{m}$
, but (2.5) justifies the fact that electron excursion can reach almost
 $10~{\rm\mu}\text{m}$
when resonantly combining the wakefield and laser field.
3. Transverse oscillations: comparison between numerical and analytical results
Equations (2.1) are shown because in the present work we study the interaction between the accelerated electrons in the bubble regime and the tail of the laser driving pulse. The interaction can occur near the dephasing point for suitable time durations of the laser pulse and electron plasma density (which determines the extension of the bubble). Near the dephasing point the acceleration is approximately zero, which is why the electron motion, without the presence of the laser tail, can be described by (2.1). Due to the fact that we can consider
 ${\it\gamma}(t)\sim {\it\gamma}_{max}$
, we can easily solve the equation of motion in the presence of the laser pulse tail, as we are going to show. The accelerated motion without laser–electron interaction (Glinec et al.
Reference Glinec2008), described by (3.1), reduces to (2.1) near the dephasing point where the accelerating fields are close to zero. The review paper by Corde et al. (Reference Corde, Ta Phuoc, Lambert, Fitour, Malka, Rousse, Beck and Lefebvre2013) recalls the phenomenological model for the electron dynamics in the bubble regime presented in Lu et al. (Reference Lu, Tzoufras and Joshi2007), which consists of the following set of equations:
 $$\begin{eqnarray}\displaystyle \left.\begin{array}{@{}c@{}}\displaystyle \frac{\text{d}{\it\gamma}{\it\beta}_{x}}{\text{d}\,\hat{t}}=\displaystyle -\frac{\hat{x}}{2},\\ \displaystyle \frac{\text{d}{\it\gamma}{\it\beta}_{y}}{\text{d}\,\hat{t}}=\displaystyle -\frac{{\hat{y}}}{2},\\ \displaystyle \frac{\text{d}{\it\gamma}{\it\beta}_{z}}{\text{d}\,\hat{t}}=\displaystyle -\frac{(\hat{t}-\hat{t}_{d})}{4{\it\gamma}_{{\it\phi}}^{2}},\end{array}\right\} & & \displaystyle\end{eqnarray}$$
and the electron transverse motion is shown to be
 $$\begin{eqnarray}\displaystyle x(t)=A\,P_{{\it\nu}}({\it\tau})+B\,Q_{{\it\nu}}({\it\tau}), & & \displaystyle\end{eqnarray}$$
where the variables with a hat are normalized by the choice
 $m=c=e={\it\omega}_{p}=1$
. The parameters
 $A$
and
 $B$
are constants which have to be determined by initial conditions.
 $P_{{\it\nu}}({\it\tau})$
and
 $Q_{{\it\nu}}({\it\tau})$
are the Legendre functions of the first and second kinds respectively, and
 ${\it\nu}$
is determined by the equation
 ${\it\nu}({\it\nu}+1)=4{\it\gamma}_{{\it\phi}}^{2}$
, where
 ${\it\gamma}_{{\it\phi}}$
is the Lorentz factor relative to the normalized laser phase velocity
 ${\it\beta}_{{\it\phi}}=v_{{\it\phi}}/c$
. The parameter
 ${\it\tau}$
is determined by the equation
 ${\it\tau}=(\hat{t}-\hat{t}_{d})\sqrt{\hat{t}_{d}^{2}+8{\it\gamma}_{{\it\phi}}^{2}{\it\gamma}_{i}}$
, where the dephasing time is
 $\hat{t}_{d}=2k_{p}R{\it\omega}_{0}^{2}/3{\it\omega}_{p}^{2}$
and
 ${\it\gamma}_{i}$
is the electron initial Lorentz factor, depending on
 $A$
and
 $B$
. The fields in the bubble are taken into account via the parameter
 ${\it\tau}$
, related to the longitudinal energy gain; in fact
 ${\it\gamma}_{z}\sim {\it\gamma}_{max}(1-{\it\tau}^{2})$
. The result (3.2) reduces to (2.1) for
 $t\sim t_{d}$
(when the acceleration length is comparable to the dephasing length). In order to take into account the presence of the laser tail near the dephasing point, one can solve the equation for a charged particle under the action of a electromagnetic wave packet, specializing to the case of a Gaussian packet with an effective ponderomotive force at the frequency
 ${\it\omega}_{s}$
, following the previous section. The relativistic quivering motion corresponding to the situation in which a particle interacts, starting at rest, with only the laser is
 $x_{q}=a_{0}c/{\it\omega}_{0}\cos {\it\xi}$
(Landau & Lifshitz Reference Landau and Lifshitz1971), from which we define the effective quivering force
 $f_{q}=ma_{0}c{\it\omega}_{0}\cos {\it\xi}$
. For our case, in which the particle approaches the laser with high velocity, we substitute
 ${\it\omega}_{0}$
with
 ${\it\omega}_{s}$
and
 ${\it\xi}={\it\omega}_{s}t$
, following the previous section. Finally we set the following equation, which holds when the laser–electron interaction is much more important than the electron–wakefield interaction, and it also takes into account the temporal profile of the laser:
 $$\begin{eqnarray}\frac{\text{d}^{2}x}{\text{d}t^{2}}=-\frac{{\it\omega}_{p}^{2}}{2{\it\gamma}_{max}}x+\frac{a_{0}-\exp \!\left(\displaystyle \frac{(z(t)-2R-v_{g}t)^{2}}{2v_{g}^{2}{\rm\Delta}{\it\tau}^{2}}\right)c{\it\omega}_{s}}{{\it\gamma}_{max}}\cos ({\it\omega}_{s}t).\end{eqnarray}$$
By considering the temporal profile of the laser slowly varying with respect to the transverse oscillations, the solution of (3.3) becomes
 $$\begin{eqnarray}x(t)=x_{0}\cos {\it\omega}_{{\it\beta}}t+\frac{6eE_{0}}{a_{0}\left|\displaystyle \frac{a_{0}}{3}-1\right|m{\it\omega}_{p}^{2}}-\exp \!\left(\frac{(z(t)-2R-v_{g}t)^{2}}{2v_{g}^{2}{\rm\Delta}{\it\tau}^{2}}\right)\cos \sqrt{\displaystyle \frac{a_{0}}{3}}{\it\omega}_{{\it\beta}}t.\end{eqnarray}$$
This solution holds just near the dephasing point. The solution of motion which takes into account the acceleration before the dephasing point is recovered by substituting the first term
 $x_{0}\cos {\it\omega}_{{\it\beta}}t$
with the solution in terms of the Legendre functions. In fact, during the laser–electron interaction they nearly coincide, which is why this substitution is justified. Finally we obtain
 $$\begin{eqnarray}x(t)\sim A\,P_{{\it\nu}}({\it\tau})+B\,Q_{{\it\nu}}({\it\tau})+\frac{6eE_{0}}{a_{0}\left|\displaystyle \frac{a_{0}}{3}-1\right|m{\it\omega}_{p}^{2}}-\exp \!\left(\frac{(z(t)-2R-v_{g}t)^{2}}{2v_{g}^{2}{\rm\Delta}{\it\tau}^{2}}\right)\cos \sqrt{\displaystyle \frac{a_{0}}{3}}{\it\omega}_{{\it\beta}}t,\end{eqnarray}$$
where
 $E_{0}$
is the amplitude of the laser electric field,
 ${\rm\Delta}{\it\tau}$
is half of the laser pulse duration,
 $v_{g}=c(1-3{\it\omega}_{p}^{2}/2{\it\omega}_{0}^{2})$
is the laser group velocity inside the plasma (Lu et al.
Reference Lu, Tzoufras and Joshi2007),
 $z(t)$
is obtained by integrating
 ${\it\beta}_{z}=\sqrt{1-1/{\it\gamma}_{d}^{2}(1-{\it\tau}^{2})^{2}}$
with
 ${\it\gamma}_{d}={\it\gamma}_{i}+\hat{t}_{d}^{2}/8{\it\gamma}_{{\it\phi}}^{2}$
(Corde et al.
Reference Corde, Ta Phuoc, Lambert, Fitour, Malka, Rousse, Beck and Lefebvre2013). Thus, when
 $\hat{t}\sim \hat{t}_{d}$
, i.e. near the dephasing point,
 ${\it\beta}_{z}$
reduces to the value
 $\sqrt{1-1/{\it\gamma}_{d}^{2}}$
; then to first order in
 $k_{{\it\beta}}r_{{\it\beta}}$
we recover the result of (2.1) for
 $z(t)$
. For (3.4) we have assumed
 ${\rm\Delta}{\it\tau}\gg 1/{\it\omega}_{0}$
and
 $v_{g}{\rm\Delta}{\it\tau}\ll R$
. The argument of the Gaussian term takes into account that the Gaussian laser pulse is driving the bubble standing at its head, and therefore it is centred at
 $2R$
when the origin of the laser/bubble axis is chosen at the entrance of the bubble. When the frequency
 ${\it\omega}_{s}$
assumes the value of a betatron frequency harmonic
 $n$
, the energy exchange between the laser and electrons becomes resonant and the motion described by (3.5) takes the form
 $$\begin{eqnarray}x(t)\sim A\,P_{{\it\nu}}({\it\tau})+B\,Q_{{\it\nu}}({\it\tau})+\frac{6eE_{0}}{a_{0}|n^{2}-1|m{\it\omega}_{p}^{2}}-\exp \!\left(\frac{(z(t)-2R-v_{g}t)^{2}}{2v_{g}^{2}{\rm\Delta}{\it\tau}^{2}}\right)\cos n{\it\omega}_{{\it\beta}}t.\end{eqnarray}$$
For a completely numerical calculation in order to study the interaction regime, one can modify (3.1) in the form
 $$\begin{eqnarray}\displaystyle \frac{\text{d}{\it\gamma}\boldsymbol{r}^{\prime }}{\text{d}t} & = & \displaystyle -\frac{{\it\omega}_{p}^{2}}{2}\boldsymbol{r}-\frac{e}{m}(\boldsymbol{E}+\boldsymbol{r}^{\prime }\times \boldsymbol{B}),\end{eqnarray}$$
(a) Comparison between numerical and analytical results for the transverse dynamics of an electron undergoing laser-driven betatron oscillations near the dephasing point in the bubble regime. Electron plasma density
 $n_{e}=1.8\times 10^{18}~\text{cm}^{-3}$
, laser intensity
 $I_{0}\sim 4.7\times 10^{19}~\text{W}~\text{cm}^{-2}$
. The motion corresponds to the parameters
 $A=0$
,
 $B\sim 0.33R$
. The laser-driven oscillatory motion develops preferentially on the third harmonic of the betatron frequency, i.e. during the major part of the laser–electron interaction time; the driving frequency of the laser
 ${\it\omega}_{s}$
is witnessed by the accelerated electrons as
 ${\sim}3{\it\omega}_{{\it\beta}}$
. (b) Electron energy as a function of time.

where the electric field
 $\boldsymbol{E}$
and magnetic field
 $\boldsymbol{B}$
are related to the normalized vector potential
 $\boldsymbol{A}=\boldsymbol{A}_{0}\,\exp [-(z-2R-v_{g}t)^{2}/(2v_{g}^{2}{\rm\Delta}{\it\tau}^{2})]\,\cos \,{\it\xi}$
via the relations
 $\boldsymbol{E}=-\partial \boldsymbol{A}/\partial t$
and
 $\boldsymbol{B}=\boldsymbol{{\rm\nabla}}\times \boldsymbol{A}$
. We used
 $\boldsymbol{r}=(x,y,z-R-v_{g}t)$
, and
 $\boldsymbol{r}^{\prime }$
denotes the derivative of
 $\boldsymbol{r}$
with respect to time. Figure 1(a) shows the comparison between the numerical result, obtained by numerically solving (3.7), and the analytical result, i.e. (3.6), for the transverse dynamics of an electron undergoing laser-driven betatron oscillations near the dephasing point in the bubble regime. The electron energy gain is also shown, from the beginning of the acceleration process up to the interaction region. We consider the formation and the propagation of a plasma bubble inside a plasma with electron density
 $n_{e}=1.8\times 10^{18}~\text{cm}^{-3}$
; the bubble is generated by a Ti:Sa laser (
 ${\it\lambda}_{0}=800~\text{nm}$
) carrying 6 J
 $\text{pulse}^{-1}$
in
 $2{\rm\Delta}{\it\tau}=40~\text{fs}$
, focused on a
 $10~{\rm\mu}\text{m}$
diameter spot. The result shows that, for the major part of the interaction time between the laser tail and the electrons, the frequency
 ${\it\omega}_{s}$
satisfies
 ${\sim}3{\it\omega}_{{\it\beta}}$
, i.e. the resonance between
 ${\it\omega}_{s}$
and both the betatron frequency and its second harmonic develop as a transient effect at the beginning of the interaction, but the oscillatory motion is mostly driven by the third harmonic of
 ${\it\omega}_{{\it\beta}}$
; in fact the red curve is just (3.6) with
 $n=3$
. Nevertheless the electron trajectory in the bubble is unique and should have no free parameters. We explain the presence of
 $n$
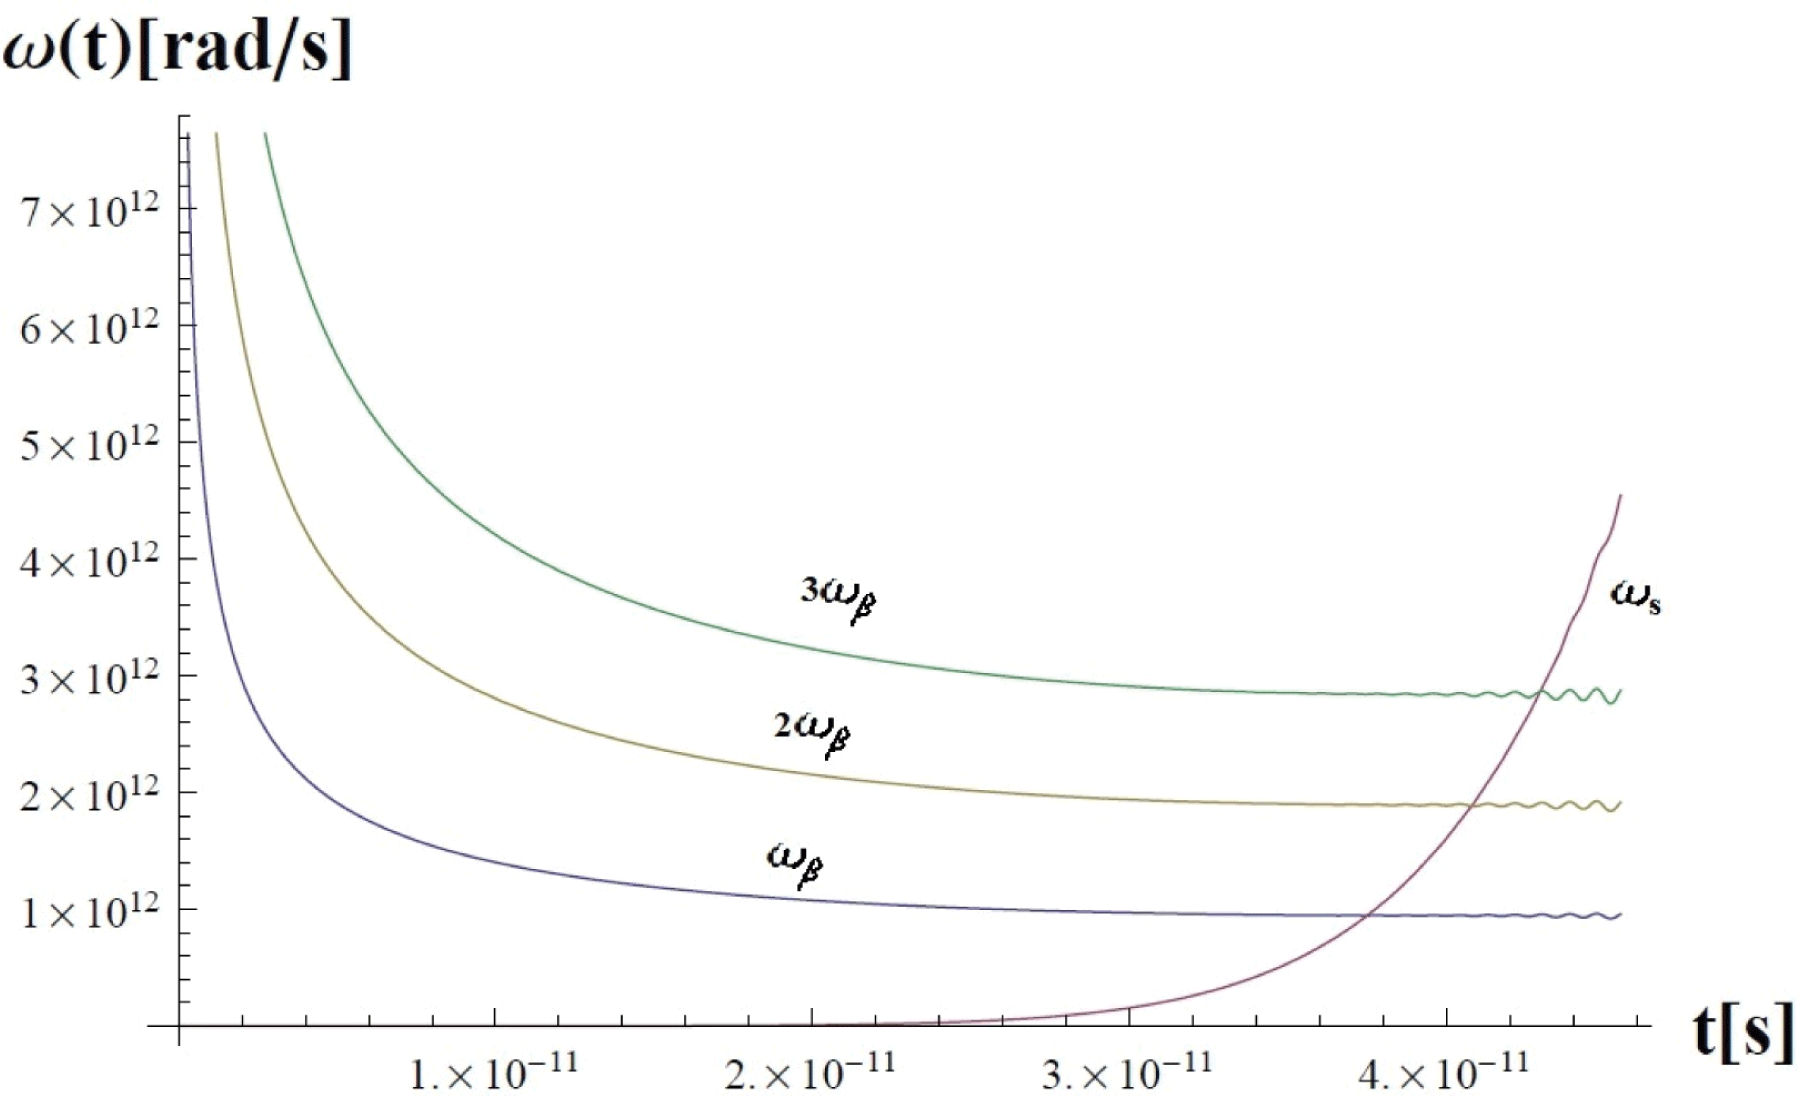
in (3.6) by referring to figure 2, in which we represent the laser frequency as witnessed by the electrons, i.e.
 ${\it\omega}_{s}=\sqrt{a_{0}^{\prime }(t)/3}{\it\omega}_{{\it\beta}}(t)$
with respect to the betatron frequency
 ${\it\omega}_{{\it\beta}}(t)={\it\omega}_{p}/\sqrt{2{\it\gamma}(t)}$
and its first three harmonics, with the same conditions as figure 1. By referring to figure 1 we can see that the most important interaction occurs at the end of the time range explored here, just when the frequency
 ${\it\omega}_{s}$
is suitable to intercept the third betatron harmonic. The laser intensity experienced by the electrons is not strong enough when the shifted laser frequency intercepts the first and second harmonics, which is why, as a first approximation, the laser drives the betatron oscillations at the third betatron harmonic (
 $n=3$
). In this way we reconcile the unique solution of motion of the electrons with the parameter
 $n$
in (3.6). It is certain that the parameter
 $n$
depends on the initial laser and plasma parameters via the equation
 ${\it\omega}_{s}=n{\it\omega}_{{\it\beta}}$
, which takes the form
 $3n^{2}=a_{0}^{\prime }(t_{deph}+{\rm\Delta}t)$
, where
 $t_{deph}=\hat{t}_{d}/{\it\omega}_{p}$
is the dephasing time, and
 ${\rm\Delta}t$
is the time that the electrons spend inside the plasma bubble after the dephasing point, which is determined by the experimental length of acceleration, which can be (or be chosen to be) even greater than the dephasing length. In figure 1,
 ${\rm\Delta}t\sim 3~\text{mm}$
, shorter than the dephasing length
 ${\sim}12~\text{mm}$
. The blowout radius corresponding to figure 1 is
 $17~{\rm\mu}\text{m}$
; the amplitude of the driven betatron oscillations is shorter. In fact, when the amplitude of the driven oscillation exceeds the blowout radius, other effects have to be considered such as collisions with electrons at the bubble boundaries. We do not study this case here, for which the model described might be invalid. As in Nemeth et al. (Reference Nemeth2008), figure 1 even shows that the electrons interacting with the laser pulse tail lose memory of their initial conditions. This occurs because the oscillatory motion driven by the laser pulse becomes more important than that imposed by the bubble radial field as soon as the electrons experience an increasing laser intensity. We can see this effect from the Gaussian term of (3.6); in fact it determines the exponential growth of the laser-driven motion with respect to that related to the focusing field inside the bubble, itself depending on the initial conditions of motion.
Laser frequency as witnessed by the electrons
 ${\it\omega}_{s}$
.

Rest assured that for more precise calculation of the laser–plasma interaction, a PIC code remains the best tool to use, in terms of generation of the bubble, pump depletion (Lu et al. Reference Lu, Tzoufras and Joshi2007), nonlinear effects such as relativistic self-focusing (Sun et al. Reference Sun, Ott, Lee and Guzdar1987), laser front steepening (Decker et al. Reference Decker, Mori, Tzeng and Katsouleas1996; Esarey et al. Reference Esarey, Schroeder, Shadwick, Wurtele and Leemans2000; Vieira et al. Reference Vieira, Fiuza, Silva, Tzoufras and Mori2010) and so on, as well as for calculation of the electron trajectories, along with the emitted radiation. Nevertheless this model could be close to representing to first order the features of the radiation spectra and spatial distributions expected, with the advantage that the calculations are really fast. In the following section the results for the betatron radiation spectra and radiation distribution are shown.
Spectra of the radiated energy dI per energy interval
 $\text{d}E$
. Laser pulse energy 6 J, electron bunch charge
 $Q\sim 100~\text{pC}$
, diameter of the laser focal spot
 ${\sim}10~{\rm\mu}\text{m}$
. (a) Comparison between betatron spectra emitted by accelerated electrons (
 ${\it\gamma}_{max}\sim 4200$
) in a plasma bubble with density
 $1.8\times 10^{18}~\text{cm}^{-3}$
at different laser pulse durations, respectively 40 fs (black curve) and 20 fs (green curve). Acceleration length
 ${\sim}11~\text{mm}$
. (b) Comparison between betatron spectra emitted by accelerated electrons (
 ${\it\gamma}_{max}\sim 3200$
) in a plasma bubble with density
 $1.8\times 10^{19}~\text{cm}^{-3}$
at different laser pulse durations, respectively 40 fs (brown curve) and 20 fs (blue curve). Acceleration length
 ${\sim}570~{\rm\mu}\text{m}$
.

4. Betatron radiation
In this section the calculations related to four different experimental configurations are shown. We have made a study of the betatron radiation in the presence of laser–electron interaction in the bubble regime by varying two parameters: the electron plasma density and the laser pulse duration. The two values of
 $n_{e}$
considered for the calculation were
 $1.8\times 10^{18}$
and
 $1.8\times 10^{19}~\text{cm}^{-3}$
, while the two values of the laser pulse duration were 20 and 40 fs. The laser parameters refer to the nominal parameters of the FLAME laser of the LNF, with Ti:Sa as the active medium, delivering 6 J
 $\text{pulse}^{-1}$
on target. We consider a laser spot diameter at the entrance of the plasma
 ${\sim}10~{\rm\mu}\text{m}$
, obtained by focusing with an off-axis parabola whose focal length is
 $f\sim 1~\text{m}$
an initial laser spot with diameter
 ${\sim}10~\text{cm}$
. The acceleration process is thought to be realized with the help of a capillary waveguide (Leemans et al.
Reference Leemans, Nagler, Gonsalves, Toth, Nakamura., Geddes, Esarey, Schroeder and Hooker2006), in such a way as to maximize the dephasing length (understood to be comparable to the acceleration length) and thus the maximum electron energy
 ${\it\gamma}_{max}m_{e}c^{2}$
. For
 $n_{e}\sim 1.8\times 10^{18}~\text{cm}^{-3}$
one could set an acceleration length of
 ${\sim}11~\text{mm}$
, while for
 $n_{e}\sim 1.8\times 10^{19}~\text{cm}^{-3}$
the acceleration length must be shorter,
 ${\sim}570~{\rm\mu}\text{m}$
. We consider an accelerated electron bunch with total carried charge 100 pC. For the calculation of both the spectra and the spatial distributions of the radiation we solved (3.7) numerically; then we iterated the procedure for several thousand particles by changing the initial condition in such a way as to fix the energy spread to the 1 % value. This method allows us to statistically evaluate the radiation spectrum produced by an electron bunch with total charge
 $Q\sim 100~\text{pC}$
, by using the Liénard–Wiechert retarded potentials (Jackson Reference Jackson1999). In figure 3 the betatron emission spectra are shown for the four different cases. It is worth noting that for longer pulses of 40 fs the photon emission is maximized, in terms of the number of emitted photons and in terms of the critical energy. Recalling (Esarey et al.
Reference Esarey2002) that the number of photons radiated by an electron undergoing betatron oscillations is
 $N_{photons}=2{\rm\pi}/9{\it\alpha}N_{{\it\beta}}k_{{\it\beta}}r_{{\it\beta}}{\it\gamma}$
, where
 $N_{{\it\beta}}$
is the total number of cycles and
 ${\it\alpha}$
is the fine structure constant, many factors in the laser–electron interaction regime contribute to the enhancement of the radiation flux. The first factor is the increase in the oscillation amplitude. Nevertheless, the increase of the oscillation amplitude is strongly dependent on the time spent by the electrons inside the laser pulse; in fact by penetrating the laser tail more and more over time, the electrons experience a progressively higher driving field amplitude. Another factor is the increase in the oscillation frequency from
 ${\it\omega}_{{\it\beta}}$
to
 ${\it\omega}_{s}$
, which is responsible for the increase in the number of cycles made by the electrons when they interact with the laser. Finally the acquisition of quivering energy results in an increase in the total kinetic energy. The critical energy corresponding to the case
 $n_{e}\sim 1.8\times 10^{18}~\text{cm}^{-3}$
, pulse duration 40 fs, is nearly
 ${\sim}600~\text{keV}$
. With the same electron plasma density but with a shorter laser pulse (20 fs), the critical energy becomes much less,
 ${\sim}120~\text{keV}$
. The same study for
 $n_{e}\sim 1.8\times 10^{19}~\text{cm}^{-3}$
shows that the critical energy for
 $2{\rm\Delta}{\it\tau}=40~\text{fs}$
is expected to be 90 keV, while for
 $2{\rm\Delta}{\it\tau}=20~\text{fs}$
the critical energy is
 $E_{c}\sim 30~\text{keV}$
. Pukhov et al. (Reference Pukhov2002) show that the condition
 $v_{g}{\rm\Delta}{\it\tau}\sim R$
is responsible for the onset of a particular acceleration regime which is a mixture of laser wakefield acceleration (LWFA) and direct laser acceleration (DLA). In fact the relativistic quivering due to an intense laser tail inside the bubble causes the electrons to acquire important relativistic mass (energy) through the interaction in the transverse plane, even if their net displacement is along the laser/bubble axis. In a previous paper Pukhov et al. (Reference Pukhov1999) figured out the possibility of a particular mechanism of electron acceleration, called the inverse free electron laser (IFEL) mechanism. The idea is that whereas in a free electron laser the electrons exchange energy with the electromagnetic field by losing part of their own energy (lost in coherent emitted radiation), in an inverse free electron laser the electrons would acquire energy in the transverse plane by interacting with the electric field (the laser electric field in our case) in such a way as to gain significant mass. Two conditions are necessary for the onset of efficient laser direct acceleration (LDA) (Zhang et al.
Reference Zhang2015). The first is the long overlap between the laser and the electrons, which is not our case because the interaction occurs for only a short time after the dephasing point. The second is that the electrons are injected into the bubble with a high transversal momentum, which does not correspond to our case because the model described here takes into account a directional electron bunch with transverse momentum
 $p_{\bot }$
much shorter than the longitudinal one
 $p_{z}$
for all the electrons. Furthermore, the resonant condition for LDA is that
 ${\it\omega}_{s}=\pm n{\it\omega}_{{\it\beta}}$
(Shaw et al.
Reference Shaw2014), while from figure 2 we can see that it occurs only for some particular values of time. Finally, LDA combined with LWFA can work well when the dephasing time is retarded by important transverse driven oscillations, causing the electrons to be accelerated over longer effective distances. In this work we consider interaction between the laser and the electrons just after the dephasing time and not before (for the pulse length and plasma density we have chosen), so the dephasing time is essentially unaffected by the laser–electron interaction. In the present work we do not explore this topic any further, mentioning that the regime under study here is not responsible for the particular collective effect recalled here. Therefore we neglect the possibility of any laser-guided electron bunching during the propagation in the bubble, referring to the condition
 $v_{g}{\rm\Delta}{\it\tau}\ll R$
.
Spatial distribution of the radiation collected at 1 m from the interaction region. Laser pulse energy 6 J, electron bunch charge
 $Q\sim 100~\text{pC}$
, diameter of the laser focal spot
 ${\sim}10~{\rm\mu}\text{m}$
. (a) Red indicates
 ${\sim}7~{\rm\mu}\text{J}~\text{mm}^{-2}$
, laser pulse duration 40 fs, laser polarization along
 $x$
, electron plasma density
 $n_{e}=1.8\times 10^{18}~\text{cm}^{-3}$
. (b) Red indicates
 ${\sim}0.5~{\rm\mu}\text{J}~\text{mm}^{-2}$
, laser pulse duration 20 fs, laser polarization along
 $x$
, electron plasma density
 $n_{e}=1.8\times 10^{18}~\text{cm}^{-3}$
. (c) Red indicates
 ${\sim}160~{\rm\mu}\text{J}~\text{mm}^{-2}$
, laser pulse duration 40 fs, laser polarization along
 $y$
, electron plasma density
 $n_{e}=1.8\times 10^{19}~\text{cm}^{-3}$
. (d) Red indicates
 ${\sim}10~{\rm\mu}\text{J}~\text{mm}^{-2}$
, laser pulse duration 20 fs, laser polarization along
 $y$
, electron plasma density
 $n_{e}=1.8\times 10^{19}~\text{cm}^{-3}$
.

In figure 4 the spatial distributions of the radiation are shown. The position of the detector is 1 m from the interaction point on the axis of the laser/plasma bubble. For the detector to be used we are considering BAS-MS imaging plates, whose spatial sensitivity is
 ${\sim}25~{\rm\mu}\text{m}$
and whose spectral sensitivity extends even beyond 1 MeV. The spatial sensitivity is such that we could certainly resolve a millimetric radiation spot, such as those in figure 4. For the detection of the spectra of figure 3 we can consider using copper foils of different thicknesses, positioned in front of the imaging plate, in order to reconstruct the X-ray spectra from the transmission measurement (Sidky et al.
Reference Sidky2005). The most remarkable aspect of figure 4 is that the divergence of the betatron radiation along the polarization axis, when the laser significantly penetrates the bubble, is strongly enhanced. The difference between figures 4(a) and 4(b) is the laser pulse duration, so one should expect a larger difference in the beam divergence when the transverse amplitude of the betatron motion is increased (
 ${\it\theta}=r_{{\it\beta}}k_{{\it\beta}}$
). Nevertheless, for the particular case studied with electron plasma density
 $n_{e}\sim 1.8\times 10^{18}~\text{cm}^{-3}$
, the bubble radius is very large with respect to the spatial extension of the laser pulse. For this reason, when the laser is 20 fs there is no interaction, but when the laser is 40 fs there is interaction for a very short time. This time is long enough to allow the laser to drive electron oscillations on its polarization axis, but not long enough to increase the oscillation amplitude. The electrons start to oscillate with a blue-shifted frequency, making the radiation flux stronger (see the flux values in the caption); however, remaining on the extreme part of the laser tail, they do not experience a driving amplitude sufficiently high to increase their transverse position significantly. Therefore the beam divergence results are almost the same in both figures 4(a) and 4(b). The only case in figure 4(b) in which the laser does not seem to affect the radiation divergence is that with
 $n_{e}\sim 1.8\times 10^{18}~\text{cm}^{-3}$
and
 $2{\rm\Delta}{\it\tau}=20~\text{fs}$
: in this case
 $v_{g}{\rm\Delta}{\it\tau}\ll R$
, i.e. the interaction between the accelerated electrons and the laser tail is almost totally suppressed, so the distribution of the radiation resembles that of electrons which do not interact with the laser field. The circular spot is due to the fact that the initial distribution of the positions of the electrons in the rear of the bubble at the moment of the injection is approximately disk-like. The polarization of the laser for the two different values of the electron plasma density is chosen to be horizontal in the case
 $n_{e}=1.8\times 10^{18}~\text{cm}^{-3}$
and vertical for
 $n_{e}=1.8\times 10^{19}~\text{cm}^{-3}$
, in order to highlight the fact that the elongation of the betatron radiation distribution is always along the polarization axis. This effect should be not be experienced for circular polarization of the electric laser field. The vertical dimension of the radiation spot in figure 4(c) is about ten times greater than in figure 4(d), due to the fact that the interaction between the electrons and the laser field is very strong when the 40 fs laser penetrates almost the entire bubble.
5. Radiation reaction effects
We have seen that in the resonant interaction regime almost MeV photons can be produced. Therefore we might consider the effects of the radiation reaction (Vranic et al. Reference Vranic, Martins, Vieira, Fonseca and Silva2014). We refer to the formula for the spatial rate at which a single electron loses energy due to betatron radiation, as described in Esarey et al. (Reference Esarey2002):
 $$\begin{eqnarray}\bar{R}=\frac{\hbar{\it\alpha}}{3}{\it\gamma}_{0}^{4}ck_{{\it\beta}}^{4}r_{{\it\beta}}^{2}.\end{eqnarray}$$
In the previous sections we showed that the effect of the laser tail on the electrons is basically to increase the oscillation amplitude and oscillation frequency. By considering
 ${\it\gamma}$
approximately constant during the interaction, the most relevant parameters for
 $\bar{R}$
which change with respect to the case without laser–electron interaction are
 $r_{{\it\beta}}$
and
 $k_{{\it\beta}}={\it\omega}_{{\it\beta}}/c$
. Therefore
 $\bar{R}\propto {\it\omega}_{{\it\beta}}^{4}r_{{\it\beta}}^{2}$
. For example, referring to figure 1 with electron plasma density
 ${\sim}10^{18}~\text{cm}^{-3}$
,
 $\bar{R}$
is of the order of
 $10~\text{GeV}~\text{m}^{-1}$
. The interaction occurs on a millimetric scale, so the average energy loss is of the order of 10 MeV, which is much less than the total energy of the electrons. Due to the fact that we consider the interaction for a very short time of
 ${\sim}10~\text{ps}$
, the energy loss via radiation is small and to first order negligible. For a plasma density of
 ${\sim}10^{19}~\text{cm}^{-3}$
,
 $\bar{R}$
could be even greater, but the interaction would occur over a shorter time scale, so the average energy loss would be approximately of the same order. For first-order considerations we can neglect the radiation reaction effects on the electron dynamics and the emitted radiation.
6. Conclusions
The betatron radiation emitted in the bubble regime by accelerated electrons interacting with the laser pulse tail has been considered and studied for forthcoming experiments at the LNF laser facility. An analytical formula has been proposed for the motion of the electrons under the laser action, useful for fast calculation of radiation spectra and spatial distributions. The features of the radiation have been shown and discussed. From the point of view of the emission of radiation it is found that the most energetic photons are emitted for low plasma densities, i.e. for highly accelerated electrons, and ‘long’ laser pulses, i.e. for pulses with duration even greater than the bubble radius divided by the speed of light. Nevertheless the proposal of this mechanism for a collimated-brilliant X-ray source should cope with the drawback of the enhancement of the divergence of the emitted radiation.
Acknowledgements
The authors willingly acknowledge the fruitful discussions with the SPARC-LAB colleagues concerning viable X–
 ${\it\gamma}$
ray secondary sources related to the laser–plasma acceleration experiments performed with the FLAME laser, developed under the INFN Strategic Project PLASMON-X.