


INTRODUCTION
For decades, pundits, citizens, and even politicians have expressed concern about representational biases in the American interest group system. In particular, charges that organized interests skew toward business and the upper class are common in contemporary politics. If these charges are true, their consequences for American democracy are dire. Indeed, organized interests—individually active business firms, trade and professional associations, social cause citizen advocacy groups, and other organizations engaging in sustained policy advocacy efforts—play an important role mediating between the generalized grievances of the public and the specific, technical outputs of the policy process. In theory, groups enable voters with limited abilities to follow the day-to-day goings-on in Congress to hold their representatives accountable. If such accountability only benefits a particular type of interest or ideological niche, meaningful representation may be more difficult to achieve for some voters, and some interests, than others.
This potential bias in interest representation has long been scrutinized by scholars of American politics. Contending with pluralists’ depiction of an interest group system characterized by a wide range of interests leveraging different organizational strengths to influence government (e.g., Dahl Reference Dahl1961), critics argued that some societal interests organize themselves more efficaciously than others and are therefore likely to be better represented. Famously crystallized in Schattschneider’s (Reference Schattschneider1960) aphorism that “the flaw in the pluralist heaven is that the heavenly chorus sings with a strong upper-class accent” (34–35), skeptical accounts have held that even if there are many groups representing many distinct interests, those groups still represent only a tiny, and wealthy, fraction of society.
To test this fundamental claim about American democracy, scholars have relied on categorizations of interests into particular organization types, such as business, labor, identity groups, or issue advocacy groups. One of the most comprehensive applications of this method to the American interest group system is that of Scholzman, Verba, and Brady (Reference Schlozman, Verba and Brady2012), who reaffirm the numerical and activity predominance of business interest groups, particularly compared with the proportion of the American public those groups represent. Category-based methods thus depict substantial biases toward business interests in issue representation before government, supporting the claims of pluralism’s skeptics. However, interest type categorization by itself does not capture significant and commonplace policy disagreements within interest categories. That is, without a variety of assumptions about preferences within interest types, interest-group categorizations provide more information about who lobbies the government than about what is being advocated.
In this study, we complement previous approaches to analyzing bias in the American interest group system by focusing directly on the content of groups’ advocacy efforts and measuring their revealed policy preferences accordingly. To do so, we develop a set of preference estimates, which we term “IGscores,” using over 160,000 public positions taken by interest groups on legislation before the 109th through 114th Congresses (2005–2016). Because this procedure includes roll-call votes cast by members of Congress, we are able to estimate IGscores for both interest groups and legislators on the same scale. This method produces IGscore estimates for over 2,600 organizations active in legislative position-taking, as well as 950 members of Congress serving during the same period. Moreover, it complements campaign contribution based measures (e.g., Bonica Reference Bonica2013) by permitting preference estimates for the large percentage of politically active organizations that do not give campaign contributions. To validate these estimates, we compare the IGscores of groups with well-established relative ideological positions across several distinct substantive domains, demonstrating the strong correlation between legislators’ IGscores and other roll-call-based measures of preferences, among numerous other exercises. Thus validated, these estimates cover organizations comprising many types of interests that are active in many substantive areas, and thereby permit general descriptive inferences about the distribution of interest groups’ revealed preferences.
Our findings complicate previous accounts of the American interest group system. Rather than exhibiting a biased uniformity (or unbiased diversity), the revealed preferences of interest groups exhibit what we term “polarized pluralism.”Footnote 1 We synthesize this depiction of the American interest group system from several findings. First, we find that preferences within the interest group system are not only heterogeneous but also distinctly bimodal and polarized in a manner similar to members of Congress. However, this similarity does not mean that the interest group distribution fully overlaps with that of Congress; rather, there appear to be differences in the degree of overlap between interest group and legislator preferences by party. Second, we show that preference heterogeneity obtains not only among interest groups as a whole, but also within organizational categories, such as corporations and public interest groups, which are often thought of as homogeneous. This combination of polarization and diversity suggests that even groups representing similar interests do not necessarily exhibit similar preferences.
Of course, while organizations may be distributed across the spectrum of revealed preferences, advocacy activities are not distributed evenly across organizations. We examine the implications of this uneven distribution of activities for the observed distribution of revealed organizational preferences. To do so, we separately weight the overall distribution of interest group preferences by three important types of advocacy activity: position-taking, campaign contributions, and lobbying expenditures. We find that these activities are not distributed proportionately across the distribution of organizational preferences. On one hand, we find that organizations with high levels of position-taking activity are even more polarized than other groups. On the other hand, groups with high levels of campaign contributions through affiliated political action committees (PACs) or with high levels of lobbying expenditures tend to have preferences closer to the median congressional Republican. This suggests that biases in interest representation may persist despite pluralism in the distribution of organizational preferences. Moreover, to the extent that campaign finance and lobbying activity determine what legislators or their staff perceive (Broockman and Skovron Reference Broockman and Skovron2018; Hertel-Fernandez, Mildenberger, and Stokes Reference Hertel-Fernandez, Mildenberger and Stokes2019; Miler Reference Miler2010) about the interests contacting them, disparities in such resources may alter policymaker behavior in response to distorted beliefs about the policies for which organized interests advocate.
Who Sings in the “Heavenly Chorus”?
Organized interest groups are ubiquitous in American national politics. They direct half a billion dollars in PAC contributions per cycle and spend billions of dollars in lobbying expenditures per year to employ thousands of registered lobbyists.Footnote 2 In principle, organized interests might help non-specialist lawmakers translate the grievances of a diverse public into concrete policy changes (Salisbury et al. Reference Salisbury, Heinz, Laumann and Nelson1987). Pluralists, recognizing the federal structure of American policymaking (Truman Reference Truman1951) and multiple modes of influence (Dahl Reference Dahl1961), argue that the American political system allows for such diverse interests to be represented. Critics of this view, famously instigated by Schattschneider (Reference Schattschneider1960), argue that wealthy business interests have several advantages in interest representation: better ability to pay collective action costs (Olson Reference Olson1965; Walker Reference Walker1983), the linkage between economic performance and electoral outcomes (Lindblom Reference Lindblom1982), anticipation of their ability to affect elections (Kingdon Reference Kingdon1989), and large teams of specialized lobbyists (Drutman Reference Drutman2015). These advantages raise questions about whether interest group activity produces an overrepresentation of business interests in democratic policymaking.
Empirical assessments of bias in the interest group system have focused primarily on quantifying which types of interests are represented among lobbying organizations. Assigning organizations to interest categories, such as business, labor unions, identity-based associations, and single-issue advocates, allows for comparison of organizational numbers or advocacy activities across these categories (Salisbury Reference Salisbury1984; Schlozman and Tierney Reference Schlozman and Tierney1983; Reference Schlozman and Tierney1986; Schlozman, Verba, and Brady Reference Schlozman, Verba and Brady2012; Sorauf Reference Sorauf1992). Such analyses confirm the disproportionate presence, in both numbers and activity levels, of business organizations—largely consistent with the upper-class bias predicted by critics of pluralism in American politics. However, as previous studies have underscored (Lowery and Gray Reference Lowery and Gray2004), categorization studies are not without their limitations in terms of what they can reveal about interest representation. Beyond the challenges highlighted in previous studies, we add that such studies tell far more about which kinds of groups exist than they do about the actual content of their advocacy efforts. Put differently, given interest groups’ goal of affecting policy outcomes, their revealed preferences remain a key piece of missing information in understanding interest representation in Washington.
Nevertheless, interest groups regularly express positions on legislation, pending issues, and other policy-relevant matters (such as electoral candidates). In principle, this should permit one to build upon categorization studies—which examine the existence of certain kinds of groups—by examining these groups’ revealed preferences. Estimates of such preferences, in the form of ideal points in a unidimensional “left-right” policy space, have been central to understanding the decisions of members of Congress (Poole and Rosenthal Reference Poole and Rosenthal1991), judges (e.g., Bailey and Maltzman Reference Bailey and Maltzman2011; Martin and Quinn Reference Martin and Quinn2002), presidents (e.g., Bertelli and Grose Reference Bertelli and Grose2011), agencies and bureaucrats (e.g., Chen and Johnson Reference Chen and Johnson2015; Clinton et al. Reference Clinton, Bertelli, Grose, Lewis and Nixon2012), citizens (Hare et al. Reference Hare, Armstrong, Bakker, Carroll and Poole2015), legislative districts (Tausanovitch and Warshaw Reference Tausanovitch and Warshaw2013), and candidates and campaign donors (Bonica Reference Bonica2013; Reference Bonica2014). These and similar scores have made dramatic contributions to the understanding of political institutions, both in the United States and around the world (e.g., Hix, Noury, and Roland Reference Hix, Noury and Roland2006; Schnakenberg and Fariss Reference Schnakenberg and Fariss2014). However, similar analysis of interest-group behavior, representation, and influence has been hampered by the absence of a measure of groups’ preferences that applies broadly to groups operating within and across individual policy domains within American government.
To date, the most comprehensive federal-level effort at examining groups’ revealed preferences comes from Bonica (Reference Bonica2013), who uses PACs’ campaign contributions to estimate their ideal points. In this work, Bonica (Reference Bonica2013, 301, Figure 3) finds ideological consensus among organized interests around a center-right mode. This apparent consensus itself contradicts the pluralist ideal, even if one permits that the interest group system may not be biased towards business as a category. However, as in interest categorization methods, contributions-based preference estimates make several assumptions—non-strategic- and non-access-oriented giving, for example—that should urge caution in using them to produce valid descriptive inferences about organizations’ policy preferences. More dangerous than potential measurement error, we contend, is the assumption that the groups that give campaign contributions are representative of the larger population of organized interests. While campaign contributions are a common tactic among organizations seeking influence, they are not a widespread one; indeed, only approximately 14% of active lobbying organizations have an affiliated PAC (LaPira and Thomas Reference LaPira and Thomas2017). To the extent that organizations giving PAC contributions differ systematically from organizations not giving PAC contributions, inferences about the interest group community as a whole that are drawn from only its contribution-giving members will be biased.
In this study, we both build upon Bonica’s advances and address gaps left by categorization studies by examining interest groups’ public positions on bills before Congress. In doing so, we produce ideal point estimates for over 2,600 organizations that took positions on congressional legislation between the 109th and 114th Congresses as well as 950 members of Congress serving during that period. After describing our measure and demonstrating its utility in the next section, we proceed to use the estimates to test three empirical predictions that should appear in our data, were biases in categorization to extend to biases in revealed preferences. First, we examine whether consensus in expressed preferences exists among organized interests lobbying the American government. Second, we investigate whether organizations of the same type are similar in their policy preferences. Finally, we examine whether groups with high levels of particular lobbying activities, including those engaging in high levels of position-taking, PAC contributions, or lobbying expenditures, exhibit preferences similar to the interest group population as a whole. Particularly among the first two of these analyses, we find little evidence of bias in groups’ revealed preferences. Ultimately, rather than uncovering homogeneity or left-right slant, our findings uncover a sort of polarization in revealed preferences among organized interests that to a large extent obtains within preference categories.
Capturing Interest Group Preferences: Data and Measurement
Given the scope of representational bias claims, we require a new measure of interest group preferences. This measure must cover federally active interest groups in a way comparable across a wide range of organizations and substantive domains. Much of the literature on interest group politics examines groups’ objectives within particular issues (see Baumgartner and Leech Reference Baumgartner and Leech1998; Hojnacki et al. Reference Hojnacki, Kimball, Baumgartner, Berry and Leech2012), but there has been progress toward more broadly comparable measures of interest group policy preferences. These use a wide variety of data sources, including legislator “report cards” (McKay Reference McKay2008; Poole Reference Poole2005), amicus filings at the Supreme Court (Hansford and Depaoli Reference Hansford and Depaolin.d.), campaign contributions (Bonica Reference Bonica2013), and state-level required lobbying disclosures (Thieme Forthcoming). To be able to investigate claims of interest group systemic bias at the federal level, we need a measure capable of assessing the entire interest group system, comparable across disparate issue domains as well as groups with a variety of organizational forms and strategies. Here we describe our data and the estimation strategy we have used to develop such a measure, the “IGscore.” First, we describe our overall strategy, explaining how data on public position-taking by interest groups may be used to estimate preferences. Second, we outline the collection of such data by the nonprofit MapLight and explain how it fulfills the requirements of ideal point estimation. Finally, we present our estimation methodology and report the results of several validation tests for our measure, before using the scores to assess claims of interest group bias.
Public Position-Taking and Preference Estimation
Interest groups routinely take positions—statements of support or opposition—on pending legislation. This position-taking can take many forms, including press releases, op-ed columns, Congressional testimony, social media posts, or “alerts” to organization members. Regardless of form, these positions communicate important information about interest groups’ preferences. Indeed, not only does public position-taking indicate which issue areas are of strongest interest to an organization, but such positions provide a concrete point of reference upon which to evaluate the organization’s views on important issues. When a group takes a position on a bill (instead of a broad issue area or cause), the object of their commentary is unambiguous.
These features make bill position-taking useful for estimating interest groups’ policy preferences. In particular, the bill-level nature of public position-taking presents an opportunity to measure interest group preferences using common statistical tools (e.g., Clinton, Jackman, and Rivers Reference Clinton, Jackman and Rivers2004; Poole and Rosenthal Reference Poole and Rosenthal1991) that estimate legislator ideal points from roll-call-voting matrices. Much like roll-call votes, public position-taking occurs at the bill level and can be categorized as “support” or “opposition.” Moreover, because multiple interest groups take positions on most major bills, scaling techniques may leverage this overlap to estimate latent preference similarities between interest groups. For example, if interest groups support or oppose all of the same legislation, they are more likely to share latent policy preferences than if they disagree on specific bills. Consequently, given a large dataset of overlapping, bill-level positions taken by interest groups, one may generate reliable measures of interest groups’ revealed policy preferences. Moreover, because legislators also take positions on a large number of bills (via roll-call votes), bill-level position-taking offers an opportunity to estimate interest group ideal points on the same scale as members of Congress.
MapLight Records of Interest Groups’ Bill Positions
A major obstacle to using position-taking data to estimate federal-level interest groups’ revealed preferences has been the cost of collecting such data at scale. Indeed, without sufficient overlap in ratings between groups, conventional scaling methods fail. Fortunately, the transparency organization MapLight.org collects just this sort of bill-level position-taking data at the federal level. We make use of these data to estimate our interest group ideal points. MapLight examines public sources including coalition letters, congressional testimony, news articles, social media posts, and organizations’ websites to compile lists of organizations recorded as having taken a position on a given bill. We rely on the final coded position these organizations have taken on bills before Congress. While a large portion of organizations MapLight observes are trade associations, advocacy groups, and the like, MapLight also captures positions from organizations not always recognized as “interest groups” per se, including individual business firms, institutions such as universities and think tanks, and state and local government agencies. MapLight codes organizations’ public statements as supporting (or opposing) a bill if they clearly declare support for (or opposition to) the specific bill in question or to the major policy changes the bill makes. MapLight focuses its research on “newsworthy” bills, those that move through the legislative process, or that are mentioned in the news or social media.Footnote 3 Thus, the bills from which we estimate interest group ideal points have meaningful policy content. Taken together, MapLight’s efforts have generated a rich dataset on the legislative positions of organized interests. As of April 2017, MapLight had collected information on the positions of 16,436 unique organizations on 8,494 bills filed during the 109th to 114th Congresses (2005–2016). A total of 75,673 bills were introduced during this period, implying that MapLight found positions for 11% of all possible bills.
In principle, groups may misrepresent their positions on bills as a bargaining tactic, for example, so they can “compromise” down to their true position as legislation progresses or in order to get “a seat at the table” in bill negotiations. Were misrepresentation a systematic feature of group position-taking, it would introduce measurement error into ideal point estimates using MapLight data. However, groups’ positions, as recorded by MapLight, have several features that render them more likely to be reflections of groups’ true preferences with respect to particular bills. First, and most importantly, we use organizations’ last recorded positions on the last version of a bill. By this point, further bargaining is unlikely to occur, and thus the potential benefits of dissembling are diminished. Second, the public nature of MapLight-recorded positions means they are observable not only to members of Congress but also to groups’ members. Organizations may not always be perfect agents of their membership, but they have incentives to not repeatedly publicly misrepresent their members’ interests. Moreover, a lobbyist’s effectiveness is in some ways contingent on their credibility to policymakers; yet, if an organization routinely misrepresents its interests, policymakers are likely to learn this over time and discount signals from such organizations. Thus, we contend, strategic dissembling is unlikely to be widespread, so using groups’ public positions is appropriate for our purposes.
As our ultimate goal is to be able to make claims about the broader interest group community as a whole, it is reasonable to consider the extent to which the set of organizations taking public positions is a fair reflection of that population. Our data improve on existing preference estimates in several respects. Because of the inclusive definition of “public” position used by MapLight, these data extend far beyond membership organizations engaged in high-profile outside lobbying. Rather, activity as varied as coalition letters, press releases, or corporate blog posts warrant inclusion in this dataset. As a result, we estimate scores for a broad array of organizations. By relying on position-taking activity we are able to estimate scores for 501(c)3 organizations and social welfare organizations that are technically barred from engaging in lobbying or campaign finance activity; in this respect our scores capture a broader range of organizations than prior estimates (e.g., Bonica Reference Bonica2013). More importantly, as we discuss in detail below, the categorical distribution of our organizations across types (e.g., business, public interest, health etc.) closely matches the distribution observed in the full directory of interests used by Schlozman, Verba, and Brady (Reference Schlozman, Verba and Brady2012), the most extensive type-based accounting of interest groups to date.
In order to relate interest group preferences to those expressed by members of Congress, we merge MapLight’s data with Congressional roll-call data from 2005–2016, available from voteview.com. Of the 75,673 bills introduced during this period, only 4,917 received a roll-call vote. While not all bills need receive a vote in order to estimate scores for legislators and groups on the same scale, at least some overlap must exist. Fortunately, of the 8,494 bills found in our MapLight data, 1,035 also received roll-call votes in Congress. These bills act as bridges that allow us to compare latent preferences of legislators and groups.
Estimating IGscores
While political scientists, economists, and statisticians have developed numerous methods for measuring latent constructs, we have opted to use Bayesian Item Response Theory to measure interest group and legislator policy preferences. As Clinton, Jackman, and Rivers (Reference Clinton, Jackman and Rivers2004) detail, item response theory (IRT) was originally developed for use in educational contexts, in order to measure latent student ability and qualities (“difficulty” and “discrimination”) of test questions. In our application, bills replace test questions as the “items,” and legislators and groups replace students as the “respondents.” The “ability” parameter  $$ {\theta}_i $$, then, translates as the ideal point for legislator/group
 $$ i $$.
Using the Bayesian IRT framework, we rely on previous work by both Clinton, Jackman, and Rivers (Reference Clinton, Jackman and Rivers2004) and, indirectly, Martin and Quinn (Reference Martin and Quinn2002) to estimate IGscores. Specifically, we assume that groups and legislators render opinions on bills based on a quadratic loss utility function such that they vote “yay” (Y) or “nay” (N) based on their spatial proximity to the bill, with some error:
 $$ {\displaystyle \begin{array}{c}P\left({y}_{\mathrm{ij}}=1\right)=P\left({U}_i\left({Y}_j\right)\ge {U}_i\left({N}_j\right)\right)\\ {}& =P\left(-{\left({\theta}_i-{Y}_j\right)}^2+{\epsilon}_{\mathrm{ij}}^y\ge -{\left({\theta}_i-{N}_j\right)}^2+{\epsilon}_{\mathrm{ij}}^n\right).& & \end{array}} $$
Clinton, Jackman, and Rivers (Reference Clinton, Jackman and Rivers2004) show that this may then be transformed to
 $$ P\left({y}_{\mathrm{ij}}=1\right)=P\left({\beta}_j{\theta}_i-{\alpha}_j+{\epsilon}_{\mathrm{ij}}\right). $$
Here,  $$ {y}_{\mathrm{ij}} $$ is the support/opposition observed from legislator/group
 $$ i $$ on bill
 $$ j $$,
 $$ {\beta}_j $$ =
 $$ 2\left({Y}_j-{N}_j\right)\divslash {\sigma}_j $$ represents the discrimination parameter for bill
 $$ j $$,
 $$ {\alpha}_j=\left({Y}_j^2-{N}_j^2\right)\divslash {\sigma}_j $$ represents the difficulty (or, “disagreement”) parameter for bill
 $$ j $$, and
 $$ {\epsilon}_{\mathrm{ij}} $$ is random error associated with each voting decision. These errors are distributed normally, with mean 0 and variance 1. We assume the following priors for the difficulty and discrimination parameters (which are identical to those adopted by Clinton, Jackman, and Rivers Reference Clinton, Jackman and Rivers2004):Footnote 4
 $$ {\alpha}_j\sim \mathbf{\mathcal{N}}\left(0,25\right) $$
 $$ {\beta}_j\sim \mathbf{\mathcal{N}}\left(0,25\right). $$
For the ideal point parameters, prior distributions are given by
 $$ {\theta}_i\sim \mathbf{\mathcal{N}}\left(0,1\right). $$
To develop static IGscores, data across all periods is pooled in order to estimate a single ideal point  $$ \theta $$ for each legislator and group.Footnote 5
These estimation procedures require a few necessary data-cleaning steps before generating ideal point estimates. First and foremost, estimating ideal points for actors that have taken too few positions, or using bills that have received little attention, could yield unstable results. In his scaling of campaign finance data, for example, Bonica (Reference Bonica2013; Reference Bonica2014) used only contributors that gave to at least two recipients and candidates that received money from at least two donors. We take a more conservative approach. Prior to estimating the IRT model on the interest group position matrix, we subject this matrix to a k-core filtration process where k = 5 (Dorogovtsev, Goltsev, and Ferreira Mendes Reference Dorogovtsev, Goltsev and Mendes2006). This decomposes a matrix—treated graph theoretically—into a series of subgraphs in which each node is connected to at least k other nodes that are themselves also connected to k nodes. The result is that we are left with a position-taking matrix of interest groups that took at least five positions on bills that themselves had at least five positions taken on them (by groups also taking at least five positions on bills, recursively). This ensures that our interest group ideal point estimates are derived from the core of the position taking network.Footnote 6
We find 2,014 bills between the 109th and 114th Congresses that meet these criteria. Of these bills, 1,035 received roll-call votes. Final legislator votes on these 1,035 bills were added to our interest group position matrix, and we removed all bills with unanimous support or opposition in order to produce the final voting matrix used for Bayesian IRT ideal point estimation of the IGscores. In Supplemental Information A, we present a table showing the distribution of bills introduced, receiving votes, with interest group positions in the MapLight data, and that we used in estimation following five-core filtration—broken down by Policy Agendas Project major topic codes. The estimation matrix includes substantial coverage across all issue areas.
We generate ideal point estimates using the ideal() function from the pscl package in R.Footnote 7 In general, we utilize pscl’s default function arguments, including the use of eigenvalue-eigenvector decomposition to generate starting values. To estimate our scores, we ran three chains of 125,000 iterations each, using a burn-in of 75,000 and thinning to every 100th iteration. Model identification up to reflection for IGscores is obtained via normalization of the estimates, using the normalize argument.
Measurement Validation
Before using IGscores to investigate biases in the interest group system, we conduct several validation exercises. Here we present a validity check comparing groups for whom we have strong a priori expectations regarding relative ideology, and we compare IGscores with existing measures of legislators’ preferences. In addition to these, we report the results of several more validity tests, including convergence diagnostics, in our Supplemental Information.
Two critical characteristics of ideal points lie in their ability to accurately capture ideological features of well-known actors, as well as to discriminate between similar actors. Perhaps unsurprisingly, given that we rely in part on roll-call data, IGscores appear similarly able as first-dimension DW-NOMINATE scores (Lewis et al. Reference Lewis, Poole, Rosenthal, Boche, Rudkin and Sonnet2020; Poole and Rosenthal Reference Poole and Rosenthal2001) to discriminate between members of Congress. Indeed, IGscores for members of Congress are correlated with DW-NOMINATE’s first dimension at  $$ \rho = $$ 0.953, with within-party correlations of 0.822 (Democrats) and 0.824 (Republican).Footnote 8 However, as a more difficult test, we selected and compared a set of interest group pairs (presented in Table 1) for which we had strong prior beliefs over relative ideology in order to demonstrate both face and discriminant validity among our scores. These pairs were selected prior to examining their respective IGscores. In Supplemental Information H, we discuss our prior beliefs about the preference scores for our selected pairs in detail.
Paired Comparisons of Related Groups

These organization pairs present a challenging discrimination task for IGscores. The pairs span multiple sectors, and several require within-issue-area discrimination between moderate and more extreme organizations on the same “side” of the spectrum.
As shown in Figure 1, IGscore estimates correspond to these expectations. Among environmental organizations, Greenpeace lies to the left of Ducks Unlimited, even though both are left of center. Among labor unions, AFSCME lies to the left of the International Brotherhood of Teamsters. The lawyers’ associations similarly conform to expectations, as the American Association for Justice has a lower (more liberal) IGscore than does the American Bar Association, which in turn has a lower IGscore than the American Center for Law and Justice. Also as predicted, the American College of Physicians lies left of the AAPS, the American Jewish Committee lies to the left of AIPAC, and the Independent Women’s Forum lies far to the right of the Feminist Majority Foundation. Among our comparisons, the only non-significant difference is that between the NRA and Gun Owners of America.
IGscore Comparison of Preselected Interest Group Pairs

These results lend credence to both the idea that a great deal of ideological heterogeneity exists among seemingly similar groups and the validity of IGscores as a measure of this heterogeneity. Figure 2 further illustrates the ability of IGscores to capture differences among related organizations. Here, we present the full set of chambers of commerce available in our data. Although bearing the same name, the chambers display an impressive amount of heterogeneity. True to its reputation as a right-leaning presence in Washington, the U.S. Chamber of Commerce lies solidly to the right of the median group and legislator. However, many other chambers do not share this position. In fact, both the U.S. Women’s Chamber of Commerce and the National Gay & Lesbian Chamber of Commerce lie closer to the median Democratic legislator than to the median Republican. The U.S. Hispanic Chamber of Commerce and California Chamber of Commerce, on the other hand, lie moderately to the right of center. Finally, the National Black Chamber of Commerce lies close to the U.S. Chamber (though slightly to the left). This result is perhaps unsurprising, given that NBCC’s Founder, President, and CEO Harry C. Alford serves on the board of directors of the U.S. Chamber of Commerce.Footnote 9 Taken together, these findings demonstrate not only that federal affiliates may not share the preferences of their parent organizations (in the case of the California Chamber) but also that groups with similar purported goals (in this case, the promotion of private enterprise) clearly disagree substantially on public policy matters. IGscores capture this heterogeneity.
IGscore posterior distributions for Chambers of Commerce

Beyond these validity checks, we execute a variety of other checks in Supplemental Information B, C, E, and G. Supplemental Information B explores IGscore distributions for a wide variety of industry breakdowns and demonstrates how IGscores appear to coincide well with a priori expectations about the ideological leanings of specific industries. Supplemental Information C demonstrates that the inclusion of roll-call votes themselves does not unduly influence the measurement of interest group preferences. Supplemental Information E engages in a more extensive comparison between NOMINATE and IGscores for legislators, demonstrating that the inclusion of interest group position-taking does not stymie one’s ability to accurately measure preferences on the basis of roll-call voting. Finally, Supplemental Information G examines the correct classification rates provided by IGscores for both interest groups and legislators. Such rates are quite high overall and exhibit no significant differences between interest groups and legislators or between different types of organizations. In fact, if anything, correct classification rates for interest groups are higher than for legislators on average, indicating that the single dimension underlying the model is no less appropriate for non-legislative actors like interest groups (who might be expected a priori to have more off-dimensional tendencies). In addition to the validation exercises presented here, the analyses presented in Supplemental Information G provide especially useful evidence regarding the validity of IGscores.
Results: Contingent Bias in the Heavenly Chorus
Given that IGscores appear to exhibit the measurement validity necessary to assess claims about interest group preferences, we now use them to investigate the conditions under which interest groups exhibit the bias often attributed to them. In particular, we test several empirical predictions that should appear in our data, were biases in group categorization to extend to biases in revealed preferences. First, we assess whether the interest group community generally skews in a single ideological direction. Second, we test whether interest groups of the same type are homogeneous in their preferences (leading between-category biases to translate directly to biases in revealed preferences) or whether they are as diverse as early pluralists implied. Third, we examine whether preferences captured among subsets of interest groups—in particular, those most engaged with the political process—differ systematically in skew and diversity, relative to all position-taking interests. In doing so, we can assess how adjustments for the intensity of interest group engagements with the political process (including the volume of public position-taking, donations to campaigns, and lobby expenditures) generate skew and homogeneity observed among our sample of interest groups.
In general, we find that the interest community exhibits more preference heterogeneity and less skew (particularly toward the center-right) than previous research might lead us to expect. When weighting for the overall amount of public position-taking in which a group engages, we uncover an interest distribution that is both balanced and highly bimodal—even more so than the unweighted distribution. However, conservative bias and homogeneity return when we weight by other interest activities, such as traditional lobbying and PAC contribution activity. These findings suggest that interest group bias is conditional in nature, depending upon which interest activity is of interest to the researcher—and which activity one ultimately believes to be most effective at influencing policy outcomes in Congress.
Diversity and Skew among Position-Taking Interests
Perhaps the most important and long-standing claim about interest group representation lies in the overall skew the pressure system is believed to possess. As detailed above, prior interest group scholarship has long suggested a privileged position for business interests (Drutman Reference Drutman2015; Lindblom Reference Lindblom1982; Schattschneider Reference Schattschneider1960), a prediction supported in categorization studies (Schlozman, Verba, and Brady Reference Schlozman, Verba and Brady2012). Were these biases to translate to revealed preferences, one should expect to observe a preference distribution with a single mode. Moreover, given the general business preference for deregulatory policies and lower corporate taxes, this mode should arguably lie to the center right (Drutman Reference Drutman2015; Hacker and Pierson Reference Hacker and Pierson2010; Hertel-Fernandez Reference Hertel-Fernandez2019). However, these empirical patterns do not obtain within the revealed preferences of the many position-taking interests we examine. Indeed, not only do the scores uncover considerable heterogeneity among subpopulations like “business,” but they also generate an overall picture of the interest community that is notably balanced and largely less conservative than most members of Congress.
Figure 3 depicts the joint posterior distribution of IGscores, comparing the revealed preferences of members of Congress to those of interest groups.Footnote 10 The distribution of preferences among members of Congress provides a useful reference against which to evaluate preference representation among organized interests. Congress is not only the primary representativeFootnote 11 body in national politics, but it contains a sufficient range of policy preferences that all but the most extreme preferences have some representation among members of Congress.
Joint Posterior Distribution of Igscores for Interest Groups and Members Of Congress

Contrary to conventional wisdom, the distributions depict few obvious left-right biases. While the right-of-center mode for interest groups appears slightly larger than the left-of-center mode, it lies notably leftward from the right-of-center mode for members of Congress. In fact, in expectation, 52.7% of the interest groups distribution in Figure 3 lies closer to the expected value for the median Democratic member of Congress than to the expected value for median Republican. Moreover, the elected elites in our sample appear more polarized and extreme than do the unelected ones: congressional Republicans appear especially more conservative than many of the most right-leaning interest groups. Indeed, the right-of-center mode for interest groups lies at  $$ \sim $$0.57, while the right-of-center mode for members of Congress lies at
 $$ \sim $$0.96.
Taken together, direct measurement of active interest groups’ preferences reveals little evidence consistent with previous assertions about strong ideological bias in the interest group system. Given the important representational ramifications of these claims, however, it is important to investigate why this finding departs from conclusions reached in previous studies. To this end, we compare our results with those of one of the most comprehensive examinations of interest group bias to date, that of Schlozman, Verba, and Brady (Reference Schlozman, Verba and Brady2012). They assess whether Schattschneider’s (Reference Schattschneider1960) claims of upper-class or business bias in the interest group community persist within the modern interest group system. To do so, they develop a taxonomy of interest groups found in the volume Washington Representatives. With this approach, they conclude that business-related interests do indeed predominate today, much as they did during the period of Schattschneider’s initial claim. To be clear, Schlozman and her coauthors do not directly assert an ideological bias, conservative or otherwise, in the pressure group system. Rather, they focus on the predominance of business interests, and suggest that interest group conflict is typified by “a portion of the business industry . . . opposed by interests drawn from outside of business” (Schlozman, Verba, and Brady Reference Schlozman, Verba and Brady2012, 324). Nevertheless, we argue that the coupling of business dominance with habitual conflict between business and nonbusiness interests implies a unidimensional preference distribution that likely is skewed towards one side or the other. Once again, as business interests have long been central to the Republican coalition (Vogel Reference Vogel2003; Waterhouse Reference Waterhouse2013), we would expect business interest dominance to lead to conservative skew in the distribution (Hacker and Pierson Reference Hacker and Pierson2010; Hertel-Fernandez Reference Hertel-Fernandez2019). Our scores, however, do not provide support for this expectation.
Given the scope of their study, one potential explanation for the differences between our findings and those of Schlozman, Verba, and Brady (Reference Schlozman, Verba and Brady2012) lies in possible differences in the sample of groups examined. For their part, Schlozman et al. attempt to examine all organizations with a presence in Washington, regardless of activity level. By contrast, our sample requires not simply that organizations maintain a presence in the capital but that they actively take public positions on bills before Congress. Thus, our sample removes many of the least active organizations in Washington. Importantly, this removal may bias our results away from corporations (among other groups), who may prefer to take public positions through their respective trade associations, rather than individually.
To address this possibility, we classify each organization with an IGscore according to the organizational-type taxonomy created by Schlozman, Verba, and Brady (Reference Schlozman, Verba and Brady2012). We then compare organizational-type proportions between our organizations and those found in their most recent Washington Representatives data (2011). Crucially, this analysis reveals few major differences between broad business and nonbusiness categorizations among our data and that of Schlozman, Verba, and Brady (Reference Schlozman, Verba and Brady2012). More specifically, while they code 48.67% of their groups as corporations or firms, trade associations, or occupational associations, 48.19% of our sample falls within these categories.Footnote 12 To be clear, the distributions within the broad “business” category are not identical between the two datasets. Indeed, while data from Schlozman et al. include approximately 27, 14, and 8% corporations, trade associations, and occupational associations, respectively, our data include 17, 25, and 6% in the same categories. Thus, our data clearly include a larger proportion of trade associations and smaller proportion of firms and corporations. However, as Figure 4 demonstrates, there is little reason to believe that this difference drives our data’s inability to recover a broad right-of-center or other ideological biases; indeed the preference distributions of corporations and trade associations are similar. If anything, the high incidence of trade associations should bias our distribution rightward, as trade associations appear more conservative on average than corporations.
Thus, our failure to uncover major conservative bias does not appear to owe to pro-business peculiarities in our sample of groups. Why, then, do active position-taking interests not exhibit conservative skew despite the fact that business interests remain quite prominent? We argue that the answer lies in the ideological breadth of the business community as well as other common organizational categories. More specifically, we show that business-oriented organizations are not homogeneously conservative and that nonbusiness categories, such as health advocacy, appear to contribute to ideological balance in Washington.
Preference Heterogeneity within Categories of Organized Interests

Figure 4 presents the ideological distributions of each major organizational category in Schlozman, Verba, and Brady (Reference Schlozman, Verba and Brady2012), ordered from most to least conservativeFootnote 13. Interestingly, though perhaps not surprisingly, trade associations rank as the most conservative group type, slightly outflanking businesses and corporations. While the differences are not substantial, one possible explanation is that corporations rely on their respective trade associations when advocating for particularly conservative (and potentially unpopular) policy changes. Still, among trade associations and (especially) corporations, IGscores span the political spectrum. Of the groups placed in these two categories, an expected 16.53% of trade associations and 27.98% of corporations lie closer to the median Democrat than to the median Republican. Perhaps even more notable is the distribution of the final business-related category, occupational associations. Indeed, as Figure 4 depicts, occupational associations exhibit an especially broad distribution. Among occupational associations, an expected 42.33% lie closer to the median Democrat than to the median Republican. Far from exhibiting rightward bias, occupational associations appear somewhat moderate in their distribution.
Given the commitment to “corporate responsibility” exhibited by several particularly recognizable brands, this heterogeneity is perhaps less surprising than it might seem. Indeed, some of the most left-leaning trade associations, corporations, and occupational associations in our data conform strongly to conventional wisdom. These include Twitter, Ben & Jerry’s, and the National Employment Lawyer Association. But apart from individual businesses and associations adopting socially liberal positions, entire industries also differ from one another in notable (if predictable) ways. Figure 5 depicts the distributions of all business interests, faceted by the highest level of Center for Responsive Politics (CRP) industry categorization. The CRP codes organizations into a set of categories adapted from the Office of Management and Budget’s Standard Industry Classification (SIC) codes. The CRP coding scheme is organized hierarchically with 13 “sectors,” broken down into 100 “industries,” and finally over 400 “categories,” or “Catcodes.”Footnote 14 As part of their data collection process, MapLight assigns these codes to the organizations in the bill-position dataset. Rather than assigning one code to each organization as CRP does, however, MapLight coders assign the code to each organization-bill dyad that best matches the organization’s interest with respect to that bill. As a result, organizations are counted within multiple sectors, industries, or categories, as they might be classified as several related types depending on the context. Thus, for the coding of organizations we present here, it is not feasible to address the distribution of these organizations across codes, which would require linking directly back to CRP data.
Density Plots of the Joint Posterior Distributions of IGscores by CRP “Sector”

We can, however, characterize the joint posterior distributions of IGscores for organizations to which MapLight most commonly assigned an individual sector, industry, or category. Figure 5 shows the distribution of the IGscore ideal points for the organizations in each CRP sector, for each organization categorized under the “business” categories that Schlozman et al. designate. At this aggregate level, we do see large moderate or center-right spikes in most sectors. The clearest exception is the Lawyers/Lobbyist sector, for which  $$ \sim $$85% of the joint posterior distribution lies closer to the Democratic median than to the Republican median. Many of these patterns appear to follow commonly held beliefs regarding the preferences of interest groups within these sectors as well as previous empirical findings from corporate PACs (Bonica Reference Bonica2013; Reference Bonica2014).
Nevertheless, not all sectors are equally dominated by conservative interests. In fact, as illustrated in Table 2, the sectors vary considerably in their left-right balance. Perhaps the most conservative industry sector (excluding “Other”) is the Defense sector, for which only 9% of the posterior distribution lies closer to the median Democrat than Republican. Still, by contrast, a paltry 0.3% of Republican members of Congress, in expectation, lie closer to the median Democrat than Republican. The most liberal sector (beyond lawyers and lobbyists) is Communications/Electronics, for which nearly 33% of groups are expected to lie closer to the median Democrat than Republican. These results by no means suggest that business organizations are strongly progressive, but they do suggest that such organizations are not uniformly conservative. Rather, cross-industry differences appear to contribute to our inability to uncover overwhelming conservative bias in our broader examination of position-taking interests.
Left-Right Leanings of Business Organizations by Sector

Similarly, nonbusiness interests are by no means uniformly liberal. In Figure 6, for example, we present density distributions of IGscores for organizations of various categories within the “Ideological & Single-Issue” sector. Although many nonbusiness sectors are dominated by left-leaning interests, such those focusing on women’s issues, health and welfare, human rights, and other traditional progressive causes, other nonbusiness interests exhibit a decidedly conservative bent. Pro-guns and resource development groups skew strongly conservative, for instance, as do anti-abortion and anti-union groups. While these findings are perhaps unsurprising, they serve as an important reminder that, much like business interests, nonbusiness interests exhibit ideological heterogeneity.
Density Plots of the Joint Posterior Distributions of IGscores of Ideological/Single-Issue Organizations

Together the prevalence of both business and nonbusiness interest groups active in public position taking, and the heterogeneity of their preferences, is not consistent with systematic bias within the pressure group system. We find neither conservative nor business dominance in our full sample but instead a balanced but polarized distribution of interests. At least among groups who take positions on bills before Congress, there appears to be little broad-based bias toward conservative interests. Our results suggest that this finding is not due to major selection issues among position-taking groups relative to the population of all groups in Washington. Rather, in addition to the proliferation of public interest groups documented in other studies, our results suggest that the business community itself exhibits a fair amount of ideological heterogeneity. This is not to suggest that biases in the lobbying community toward upper-class perspectives do not exist, of course: that some companies and occupational associations, for example, often advocate in favor of the disadvantaged does not necessarily substitute for organizations made of up the disadvantaged themselves. Still, at the aggregate level, the expressed preferences of organized interests appear to include both liberal and conservative perspectives.
Organizational Activities and Differential Intensity
Our initial examination finds preference heterogeneity among organized interests both across and within interest categories, industries, and causes. In this section, we continue to examine the distribution of revealed preferences among organized interests. However, following Schlozman, Verba, and Brady (Reference Schlozman, Verba and Brady2012), here we examine how representational biases might be a product not only of organization numbers but also of organizational activities. Some organizations engage in more advocacy than others, gaining more opportunities for influence. These differences in interest “intensity” (cf. Dahl Reference Dahl1956) arise because different types of interests face different obstacles to organizing in the first place. In addition to differences in levels of advocacy activity, organized interests employ various advocacy strategies (e.g., grassroots mobilization, direct lobbying, or electioneering). The existence of differentially intense interests creates different political contexts surrounding different issues, as the interests who gain the benefits or pay the costs of a new policy may each be either intense and mobilized or diffuse and unorganized (Arnold Reference Arnold1992; Olson Reference Olson1965; Wilson Reference Wilson1980). This in turn can influence legislators’ perceptions of the stakes of their policy decisions (Baumgartner and Leech Reference Baumgartner and Leech1998; Fiorina Reference Fiorina1974; Hertel-Fernandez, Mildenberger, and Stokes Reference Hertel-Fernandez, Mildenberger and Stokes2019; Miler Reference Miler2010). For this reason, the viability of a variety of strategies, and by extension the usefulness of the varying resources, is central to the pluralist account (Dahl Reference Dahl1961). This allows one organization’s advantage in one set of resources and strategies to be balanced by other organizations’ advantages in other sets. However, to the extent some strategies are more efficient at generating influence, and only a particular subset of organizations can access those strategies, the mere existence of organizations representing different interests may be insufficient for an interest group system to be unbiased.
Here, we consider three common sources of differential interest intensity and activity and assess what biases each might introduce into the representation of organized interests’ policy preferences. The activities we focus on are public position-taking activity, PAC contributions, and direct lobbying expenditures. For this analysis we weight the densities of groups’ revealed preferences by their levels of each of these sources, in order to assess how likely it is that “polarized pluralism” is what policymakers observe in the interest group community—and, if not, what they are more likely to observe instead. We find that polarized pluralism is exacerbated among the groups that engage in higher levels of public position-taking. However, when accounting for the volume of direct lobbying and PAC contributions, the canonical picture of unified, conservative bias begins to reappear. This suggests that, to the extent direct lobbying and PAC contributions are more efficient at producing influence, right-leaning groups are disproportionately advantaged relative to their presence in the interest group system as a whole. Even if lobbying and PAC contributions are not especially efficient avenues of influence, the common conception of interest group skew towards conservative interests may be a function of the unequal distribution of resources devoted to high-profile interest group activity rather than a feature of the interest group population as a whole.
Public Position-Taking
The first form of advocacy intensity we examine here is the tendency of groups to take positions on differing numbers of bills. If the critical consideration for assessing interest group bias is what legislators (or other policymakers) observe, then groups that take positions publicly on more bills should be more frequently observed by the typical legislator. This suggests that the distribution of organizations’ preferences observed by legislators is different from the true distribution of preferences in that it more heavily weights the preferences of groups that more frequently take positions on legislation.
Though this may seem mechanical or even simplistic, it reflects features of both human psychology and advocacy strategy. Both legislators and their staff tend to more readily recall contacts from groups that are more active in the legislative process, and they systematically overestimate the degree to which such groups are representative of their own district constituencies (Hertel-Fernandez, Mildenberger, and Stokes Reference Hertel-Fernandez, Mildenberger and Stokes2019; Miler Reference Miler2010). To the extent they wish to appeal to either, their decisions may reflect the priorities of the groups that happen to be the most active. Furthermore, taking a public position on a bill is a necessary condition for an organization’s grassroots members to begin contacting their legislators at the organization’s behest. This “outside lobbying” (cf. Kollman Reference Kollman1998) of legislators by their own (group-mobilized) constituents signals the salience of a bill to the legislator’s district. This, in turn, can affect legislators’ behavior (Gillion Reference Gillion2012), particularly if the legislator has reason to believe that constituents had to overcome significant resource barriers to organizing in the first place (Gause Reference Gause2016). As a result, even groups without traditional grassroots memberships, such as corporations, engage in grassroots mobilization efforts (Hertel-Fernandez Reference Hertel-Fernandez2018; Walker Reference Walker2009). As a prerequisite for leveraging grassroots members, however, an organization must signal bill positions to those members. Public position-taking can serve this function, committing the organization to supporting or opposing legislation and, by taking a position on some bills and not others, indicating to grassroots members where to direct their costly organizing. Thus, groups that more actively take positions on bills may be better able to register their preferences with both legislators and the grassroots members capable of demonstrating the salience of a particular bill to the legislator’s district.
In Figure 7 we weight the joint posterior distribution of interest groups’ IGscores by the number of MapLight-recorded positions each group has taken. This distribution is more polarized than the unweighted distribution, with modes that are slightly more extreme at -0.87 and 0.60. This suggests that the most active interest groups tend to be either substantially left of center or right of center, and that moderate groups are less active overall. Contrary to the expectation that the interest group community is either unimodal or skewed rightward, using position-taking as a measure of intensity reveals a starkly polarized interest group community which includes a highly active left-of-center population. Much like the unweighted distribution of interests, approximately 50% (50.99) of the position-taking-weighted distribution lies closer to the median Democrat in Congress than the median Republican.Footnote 15 Consequently, insofar as legislators’ perceptions of the interest group community are influenced by the volume of position-taking activity, members of Congress are unlikely to observe a particularly conservative or homogeneous picture of the interest group system.
Position-Taking-Weighted Posterior Distributions

PAC Contributions
Political action committee contributions are a frequent target of critiques about the role of money in politics. Campaign contributions may influence legislative votes (Wright Reference Wright1985); though more likely, PAC contributions (or the prospect thereof) influence how legislators allocate their time and attention (Esterling Reference Esterling2007; Hall and Wayman Reference Hall and Wayman1990). In particular, PAC contributions may facilitate access to lawmakers among non-lobbyists (Kalla and Broockman Reference Kalla and Broockman2016), and levels of giving to particular lawmakers are consistent with the value of access to those lawmakers for particular organizations (Fouirnaies Reference Fouirnaies2018; Fouirnaies and Hall Reference Fouirnaies and Hall2018; Grimmer and Powell Reference Grimmer and Powell2013; Romer and Snyder Reference Romer and Snyder1994). Insofar as gaining access to a legislator helps to influence that legislator, groups giving higher levels of PAC contributions may be more effective at influencing lawmakers.
Given the potential for PAC contributions to alter the access and influence enjoyed by individual groups, we examine how groups contributing to campaigns differ from the full distribution of position-taking interest groups. To do so, we identify organizations in our sample that had active affiliated PACs between 2005 and 2016.Footnote 16 Among these organizations, a picture of center-right dominance emerges. Figure 8 produces the joint posterior distribution of interest groups with both an IGscore and an affiliated PAC, weighted by PAC contribution dollars from 2005 to 2016. This set of 788 organizations represents approximately a 29.8% match rate for organizations in the IGscore dataset, somewhat larger than the percentage of lobbying organizations that have PACs (13.9%).Footnote 17 As is clear visually, weighting the ideological distribution by PAC donations introduces considerably more center-right skew than does weighting by position-taking activity. Indeed, the weighted PAC posterior distribution exhibits right-of-center modes as far rightward as 1.346 (with the other three modes located at 0.306, 0.578, and 0.872). Perhaps more importantly, only  $$ \sim $$ 40.1% of the weighted posterior distribution lies closer to the Democratic than Republican median in Congress. This suggests that the groups most benefiting from the influence-garnering capacity of PAC contributions are likely to be more conservative than the typical organized interest.
PAC-Weighted Posterior Distributions

Furthermore, the significance of center-right dominance and distributional homogeneity among contributing interests depends on one’s assumptions regarding the marginal effectiveness of additional PAC spending. That is, if one assumes that marginal returns to PAC spending are diminishing and therefore weights by logged PAC donations, a notably different distribution emerges. First, while the raw PAC-weighted distribution retains a left-of-center mode (two, actually, located at -1.231 and -0.869), the log-weighted distribution exhibits no such multimodality (exhibiting a single mode, located at  $$ \sim $$0.578). These differences extend to the overall skew of the distributions: whereas 40.1% of the raw-spending-weighted distribution lies closer to the Democratic than Republican congressional median, just 29.2% of the log-weighted distribution does so. This suggests first that liberal PAC contribution activity is likely dominated by a small number of organizations, relative to conservative groups. Second, in spite of the differences between the logged and nonlogged weights, PAC donation activity generates a picture of the interest community that is notably more homogeneous and right-leaning than position-taking activity alone captures. Thus, insofar as PAC contributions are able to bias legislators’ priorities or perceptions—and, eventually, legislative agendas and outcomes—the policymaking process is somewhat more likely to favor right-leaning interests.
This finding of both overall conservative bias and substantial heterogeneity is at odds with measures that use campaign contributions themselves to estimate ideal points for PACs and their parent organizations. Figure 9 presents a comparison of our IGscores and Bonica’s (2013) CFscoresFootnote 18 for the 552 organizations that we identify in both datasets.Footnote 19 In order to facilitate this comparison, we standardize both scores to  $$ \mu =0 $$,
 $$ \sigma =1 $$.Footnote 20 On one level, the two distributions share similarities, and organizations’ scores in each are moderately correlated (Spearman’s rank correlation
 $$ \rho =0.449 $$, p
 $$ < $$ 0.0001). Nevertheless, the IGscore distribution displays both more heterogeneity and more extremism than does the CFscore distribution. First, the standard deviation of the IGscore distribution is significantly larger than that of the CFscore distribution, with a high-density interval of the difference in standard deviations of (0.086, 0.181).Footnote 21 Second, the mode of the IGscore distribution is at
 $$ \sim $$0.65, considerably to the right of the CFscore mode of
 $$ \sim $$0.21. Indeed, a Bayesian two-sample comparison test using the BEST procedure introduced by Kruschke (Reference Kruschke2013) indicates that the mean IGscore is 0.387 higher than the mean CFscore, with the 95% high-density interval of the difference in means between 0.333 and 0.441. These results provide some numerical estimates of the certainty we should place around the conclusion that is easy to draw visually from Figure 9 using position-taking and campaign-giving activity to estimate preference measures yields notably different estimates for some of the same organizations. These differences suggest that organized interests may take different factors into consideration when deciding which positions to take on bills versus deciding to whom to make PAC contributions.
Comparison of IGscore and CFscore Distributions for Matched Organizations

These findings come with an important caveat. While campaign contributions may offer organizations an additional avenue by which to reach legislators, the vast majority of position-taking interests do not engage in PAC contribution activity. As noted above, according to data from the Center for Responsive Politics, less than 14% of active lobbying organizations have an active affiliated PAC. In our sample, 29.8% of groups with an IGscore possess an affiliated PAC. Thus, while the center-right bias depicted above owes to spending differentials between organizations, much of this bias results from the fact that organizations that donate at all tend to be a conservative subsample of all position-taking interests. Indeed, while 71.1% of contributing organizations in expectation lie closer to the median Republican than median Democrat, just 35.7% of non-contributing organizations do. The IGscore distributions of non-contributing and contributing organizations are statistically significantly different.Footnote 22 Thus, though comparisons between the two distributions are useful, it remains possible that populations of position-taking and contributing groups may differ altogether—and perhaps warrant a fuller examination in the future. For the present purposes, while this analysis may indicate that PAC contributions bias lawmaker preferences to the center-right, another explanation for our findings here is that different types of organizations tend to select into PAC contributions versus position-taking.
In sum, our results suggest that contributing interests are somewhat more homogeneous and considerably more conservative than the overall set of position-taking interests captured by IGscores. However, the small overlap between contributing and non-contributing interest group communities suggests that interest group scholarship relying on contributions or contribution-based measures alone is likely to draw different conclusions about interest group preferences overall than would scholarship relying on non-contribution activities. While Appendix F further explores the difference between IGscores and contributions-based measures, we believe these results suggest, first, that scholars of interest groups should remain cognizant of the differences between these samples of organizations, and second, that concern over conservative bias should perhaps be more pronounced for the campaign finance system than for groups who actively take positions on congressional legislation.
Lobbying Expenditures
Our final organizational activity, direct lobbying, is perhaps the archetypal form of influence-seeking behavior in Washington. Lobbying expenditures entail hiring professional advocates to advance an organization’s legislative agenda through direct contact with relevant policymakers. In general, lobbying is at least weakly effective; rarely is an organization made worse off in individual policy conflicts by spending resources on lobbying (Schlozman, Verba, and Brady Reference Schlozman, Verba and Brady2012), and often a sustained lobbying effort can help various issues gain salience and agenda space (Berry Reference Berry2010). Moreover, lobbying is particularly effective when protecting a previously hard-won legislative status quo (Baumgartner et al. Reference Baumgartner, Berry, Hojnacki, Leech and Kimball2009) or when it concentrates on issues of low public salience (Lowry and Potoski Reference Lowry and Potoski2004). As a result, returns to lobbying expenditures appear impressive (De Figueiredo and Silverman Reference De Figueiredo and Silverman2006; Kang Reference Kang2015; Richter, Samphantharak, and Timmons Reference Richter, Samphantharak and Timmons2009). Thus, we might expect that groups with higher lobbying expenditures are better rewarded for their lobbying efforts than other groups.
Consequently, we examine the joint posterior distribution of organizations engaging in lobbying activity,Footnote 23 weighted by their total lobbying expenditures between 2005 and 2016, according to the LD2 forms they filed under the Lobbying Disclosure Act.Footnote 24 Here, we recover the clearest case of homogeneous, conservative dominance among the interest community, depicted in Figure 10. First, the weighted distribution features a single mode, located far to the right ( $$ \sim $$0.573). Second, only 22% of the weighted mass of this posterior distribution is closer to the Democratic than Republican congressional medians. This bias persists even when controlling for how “thinly” a group spreads its lobbying expenditures across issue areas. Indeed, if we weight the distribution by expenditures per issue reported on LD2 forms,Footnote 25 just 24.8% of the weighted distribution lies closer to the Democratic than Republican median—depicted in the bottom panel of Figure 10.
It is worth noting that, similar to PAC expenditures, weighting by logged lobbying expenditures (to account for diminishing marginal returns to additional lobbying expenditures), does alter these results somewhat. However, in this case, the log-weighted results reveal a distribution characterized by less center-right dominance. Here, 41.3% of the weighted posterior lies closer to the Democratic than Republican median. Still, the mode of this log-weighted distribution remains firmly rightward, located at 0.33. Thus, on balance, if legislators respond differently to organizations based on their lobby expenditures, we might expect a strong conservative bias in legislator attention and downstream outcomes.
The approach we have applied here—weighting the posterior distributions of interest group preference scores by different measures of intensity or activity—is both flexible and extensible. We have focused on public position-taking, PAC contributions, and lobbying expenditures as three high-profile activities interest groups engage in as they seek to communicate their preferences to lawmakers. However, this approach is well-suited to analysts interested in how other inequalities in interest group activity may translate to differential influence.
Lobbying-Weighted Posterior Distributions

Conclusions
This article leverages IGscores, a new set of common-space ideal point estimates for interest groups and members of Congress, to assess whether cannonical claims about the nature and extent of interest group bias in American politics hold when examining groups’ revealed legislative preferences. Our analysis complicates these claims. First, contrary to the conventional wisdom of center-right business dominance, we find substantial heterogeneity in the revealed policy preferences of organized interests active in congressional politics, which holds both across and within traditional categories of interests (e.g., trade associations, labor unions, and identity groups). Indeed, the collection of organizations taking public positions before Congress exhibits strongly bimodal policy preferences, similar to the U.S. Congress itself in recent decades. We take this heterogeneous, bimodal distribution of policy preferences as evidence for “polarized pluralism” in the interest group system.
Though we uncover little bias in the distribution of active organizations’ preferences, we do find evidence of biases in interest intensity, which may have implications for how policymakers and others perceive interest group bias. That is, we posit that the most intense interests—those that are most active and have the highest levels of advocacy-related activities and resources—are most likely to gain lawmakers’ attention and remain in their memory (Hertel-Fernandez, Mildenberger, and Stokes Reference Hertel-Fernandez, Mildenberger and Stokes2019; Miler Reference Miler2010) when rendering key decisions. On one hand, we find that polarized pluralism persists (and is even exacerbated) when we measure intensity via the volume of group public position-taking activity. On the other hand, however, the unimodal moderate-conservative distribution feared by critics of pluralism does characterize those organizations with the highest levels of campaign contributions and lobbying expenditures. This, we believe, suggests that the problem of interest group bias is one of how interest groups are perceived by other actors (e.g., policymakers) rather than homogeneity in their actual preferences. We find substantial conservative rightward bias when weighting interest group preferences by PAC contributions and lobbying spending. This is normatively concerning and, we suggest, may be why the standard view has been that the interest group system is conservatively biased.
We believe future work can use IGscores, and the strategy of examining weighted distributions we pursue here, to better understand how various advocacy activities and strategies affect those perceptions. For example, given that interest groups with different ideological leanings might be better suited for, or more inclined toward, different types of arguments (Baumgartner et al. Reference Baumgartner, Berry, Hojnacki, Leech and Kimball2009, chap. 7) and other tactical and strategic decisions (Evans Reference Evans1996; McKay Reference McKay2012; Victor Reference Victor2007), IGscores appear well-suited to improving our current understanding of how individual groups build their advocacy strategies accordingly. These potential contributions extend to the growing study of interest group coalitions, where scholars might incorporate IGscores to examine how coalitions form (Heaney and Lorenz Reference Heaney and Lorenz2013; Phinney Reference Phinney2017) and how they pursue legislative influence (Baumgartner et al. Reference Baumgartner, Berry, Hojnacki, Leech and Kimball2009; Grossmann and Dominguez Reference Grossmann and Dominguez2009; Lorenz Reference Lorenz2020). Finally, IGscores can contribute to understanding the microfoundations of interest group influence itself. Foremost, IGscores could be used to investigate canonical theories of lobbying—exchange (Denzau and Munger Reference Denzau and Munger1986; Tripathi, Ansolabehere, and Snyder Reference Tripathi, Ansolabehere and Snyder2002), informational (Austen-Smith and Wright Reference Austen-Smith and Wright1994), and legislative subsidy (Hall and Deardorff Reference Hall and Deardorff2006)—which differ critically in their hypotheses about the ideological proximity of lobbyists to those they lobby.
IGscores may facilitate additional analyses about the role of interest groups in American politics, as IGscores possess some advantages over previous measures. For instance, IGscores use information from bills that never received a roll vote (but on which interest groups took positions),Footnote 26 and they capture the preferences of the many lobbying organizations that do not give campaign contributions. Moreover, given that the scores do not rely on campaign contributions, they are especially promising for how they may contribute to research connecting interest groups and political parties. Future work, for example, may explore why distributions of Democratic lawmakers and liberal interest groups overlap substantially, while Republican members of Congress appear notably more conservative on average than conservative interest groups (cf. Broockman and Skovron Reference Broockman and Skovron2018; Grossmann and Hopkins Reference Grossmann and Hopkins2016; Hacker and Pierson Reference Hacker and Pierson2005).
Ultimately, our analysis does not intend to suggest that important differences in influence or advocacy effectiveness do not exist between interests of different organizational categories or ideological stripes. Rather, we have sought to characterize the distribution of preferences within the interest group system in a more precise way than previously possible, using evidence applicable to as wide a variety of groups as possible. In doing so, we have found an interest group system simultaneously more heterogeneous, and more polarized, than that depicted in previous analyses—and that bias is contingent on the relative effectiveness of various advocacy activities.
Supplementary Materials
To view supplementary material for this article, please visit http://dx.doi.org/10.1017/S0003055420000350. Replication materials can be found on Dataverse at: https://doi.org/10.7910/DVN/6AAGM9.



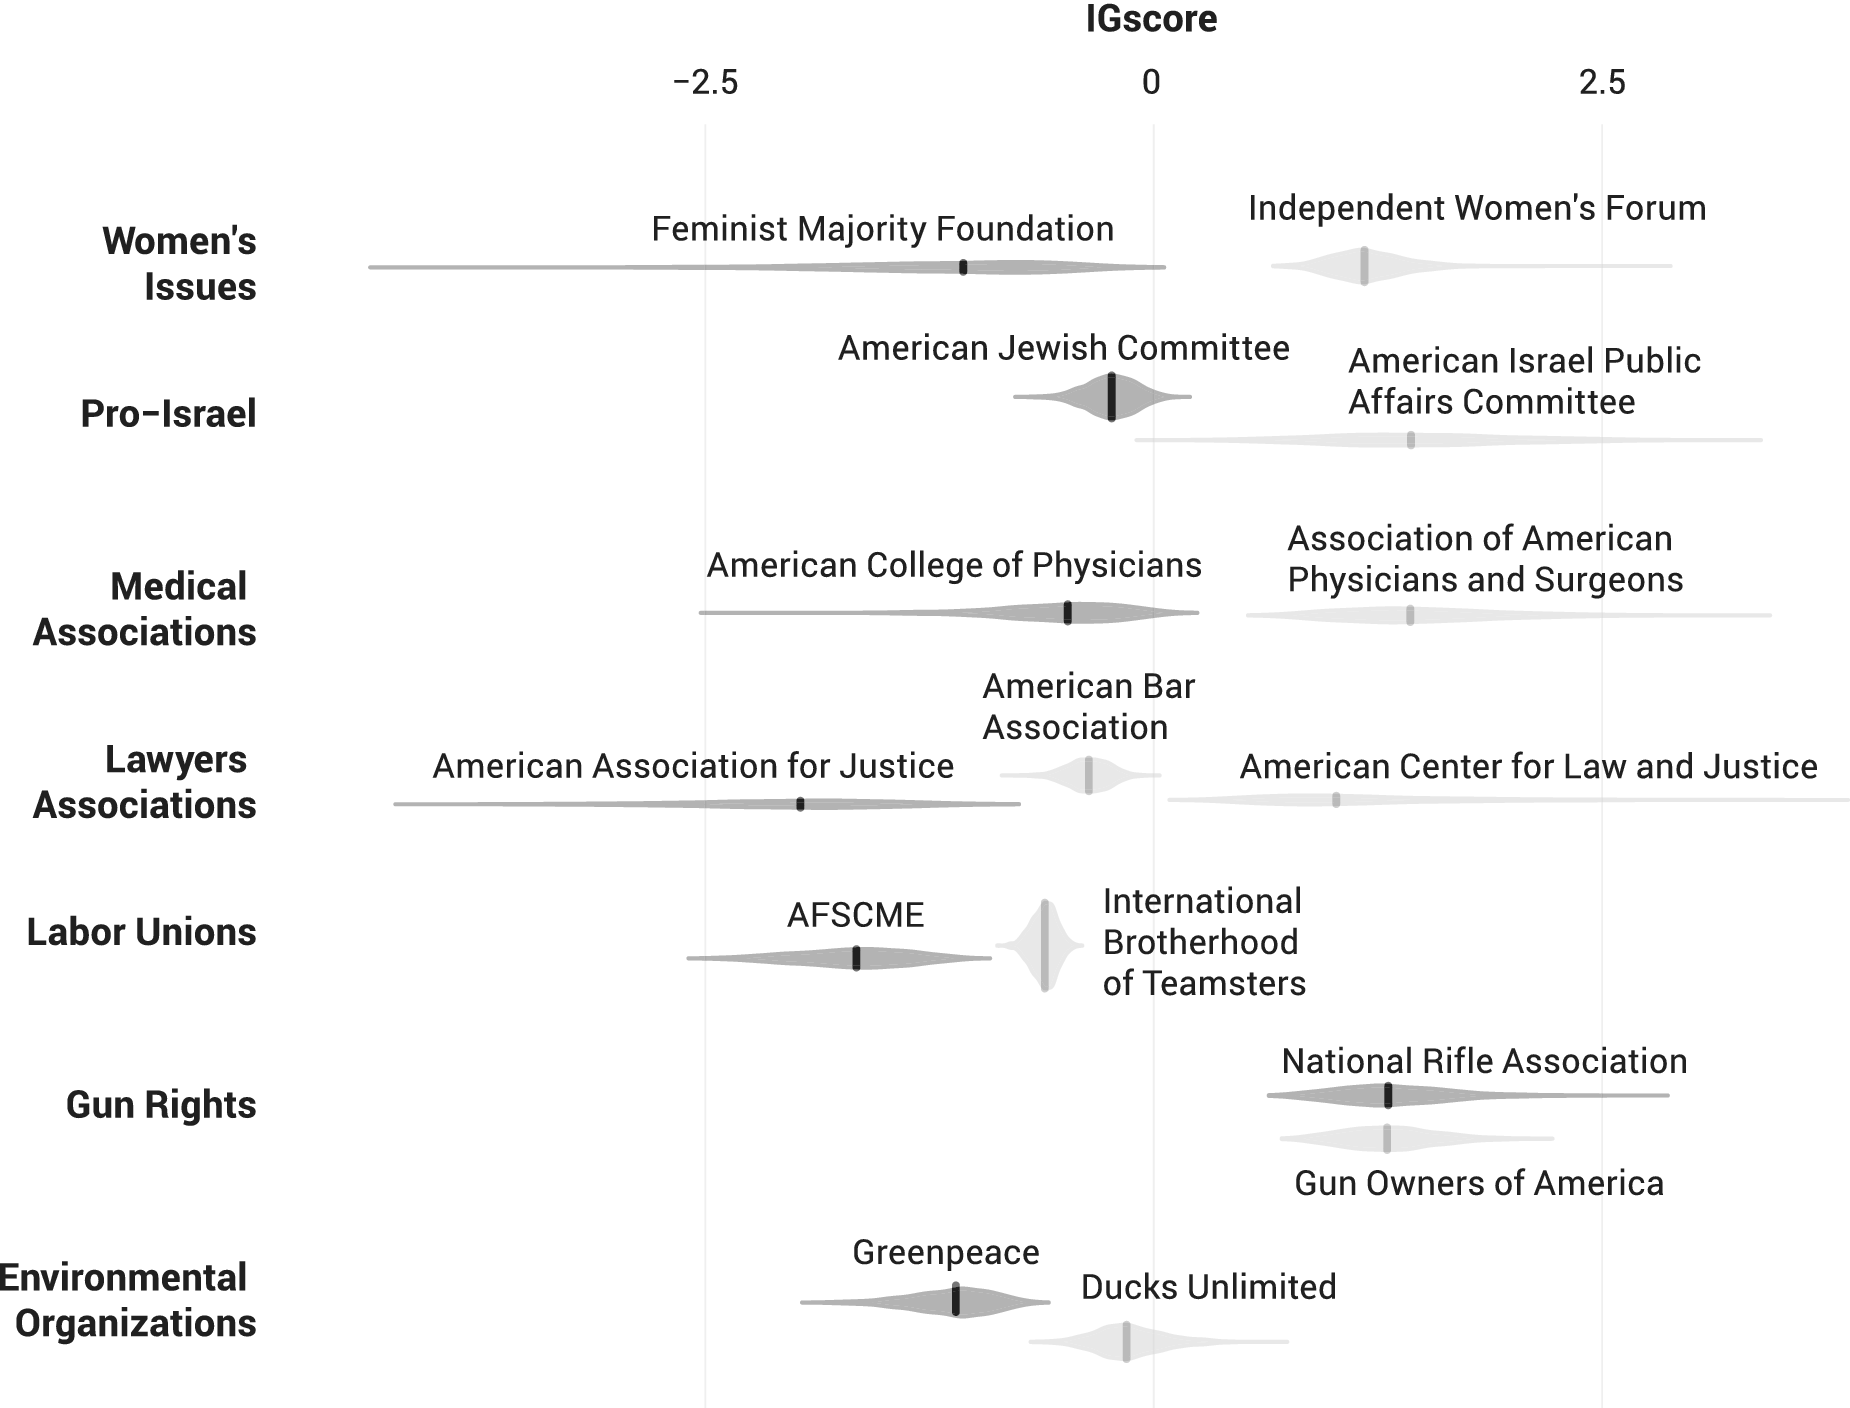
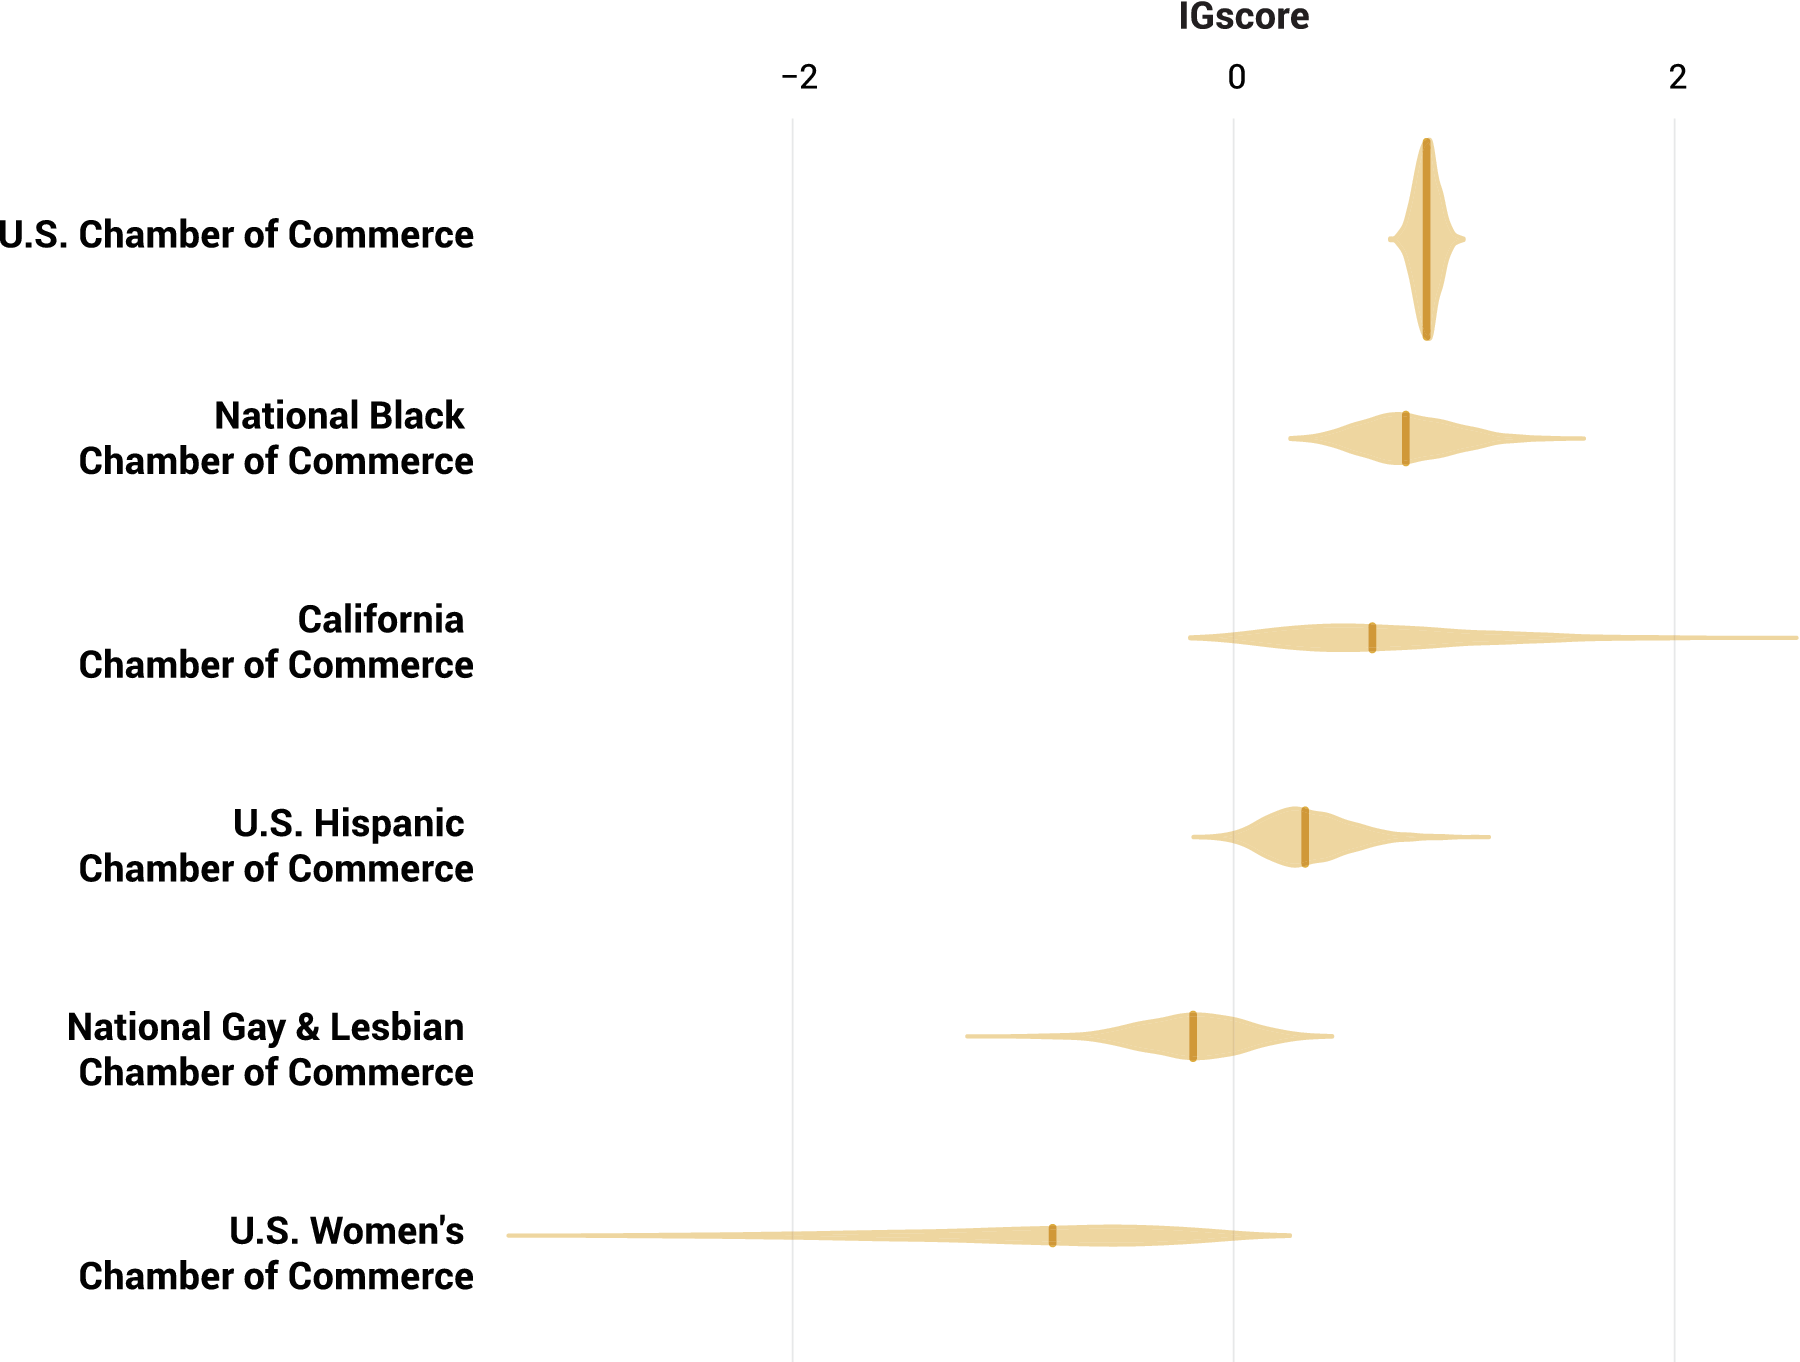
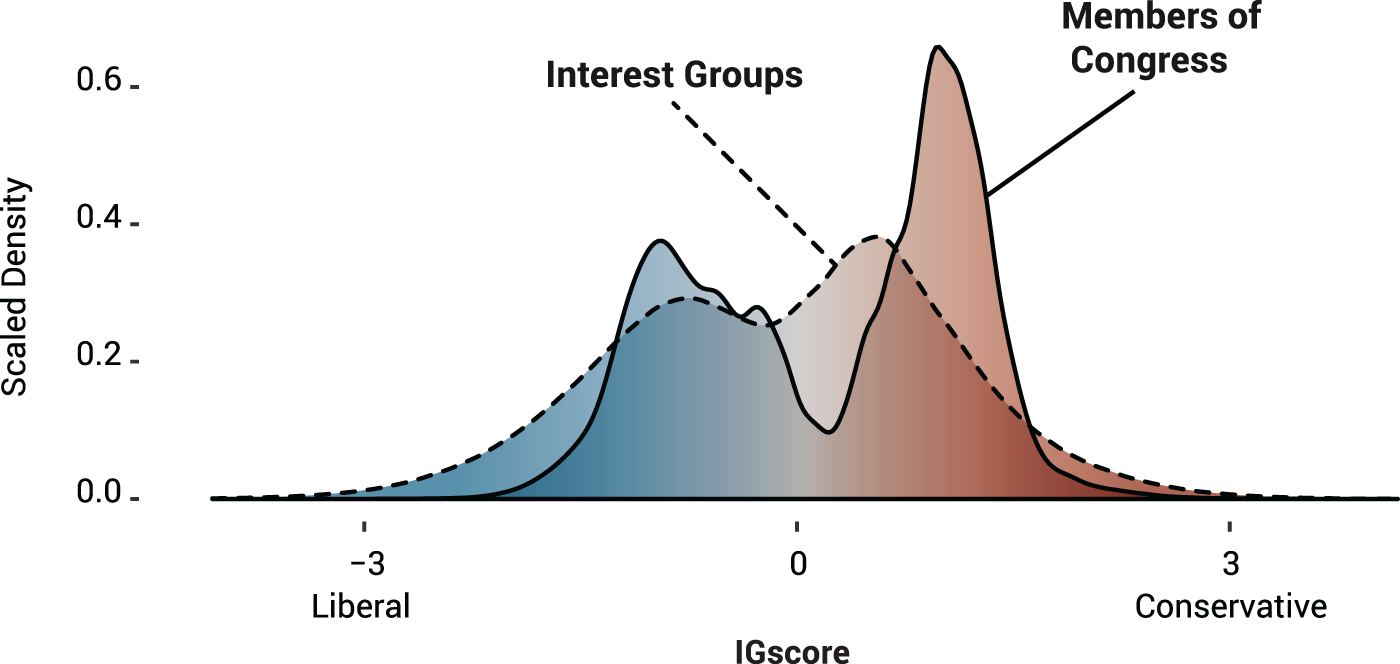
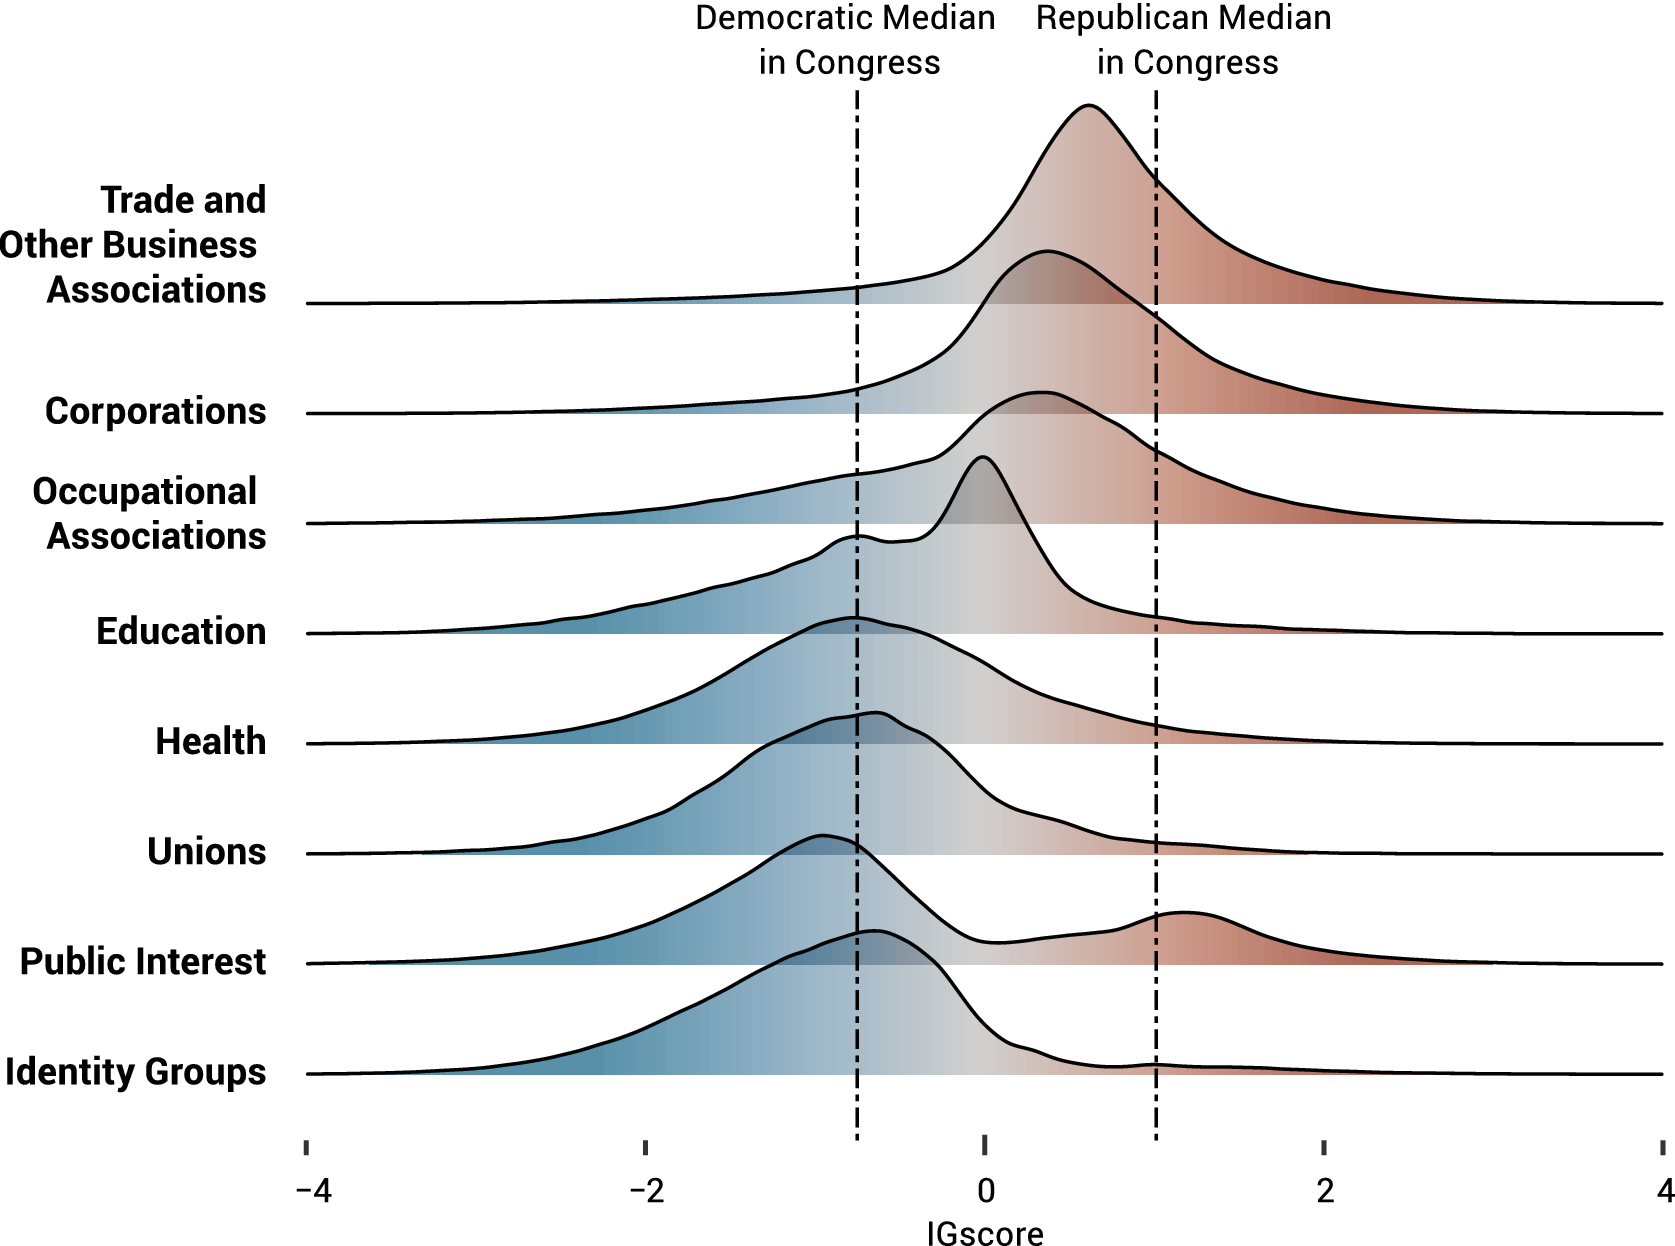
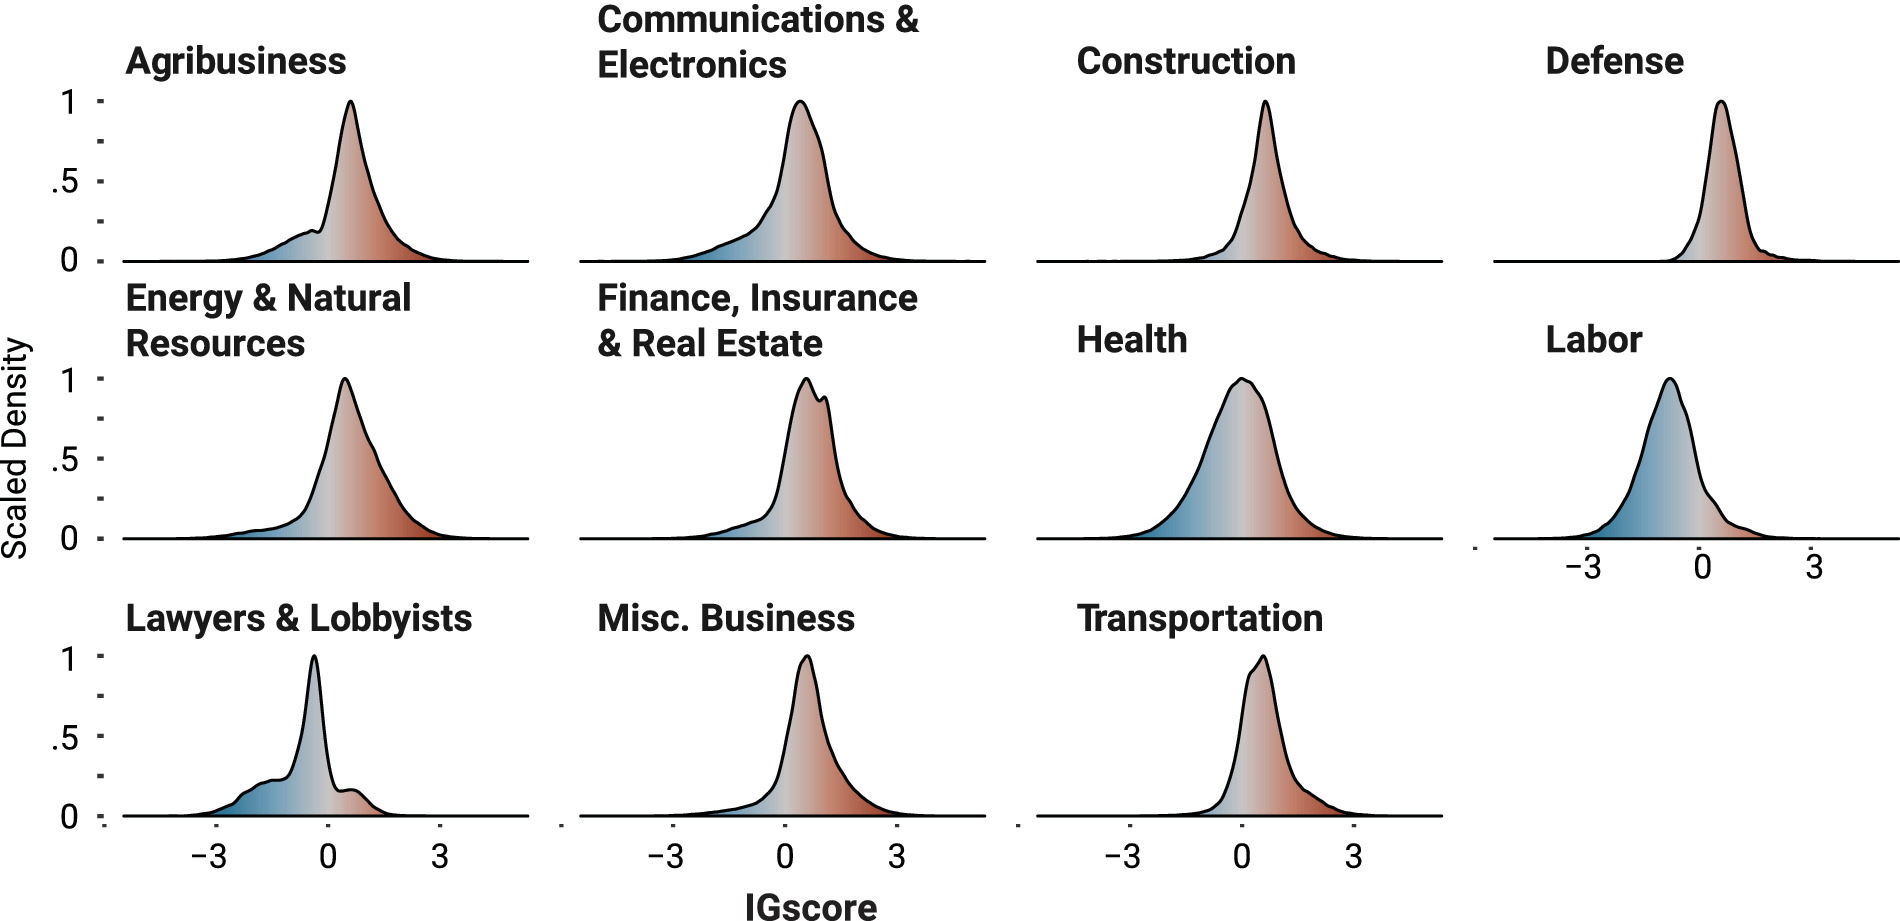
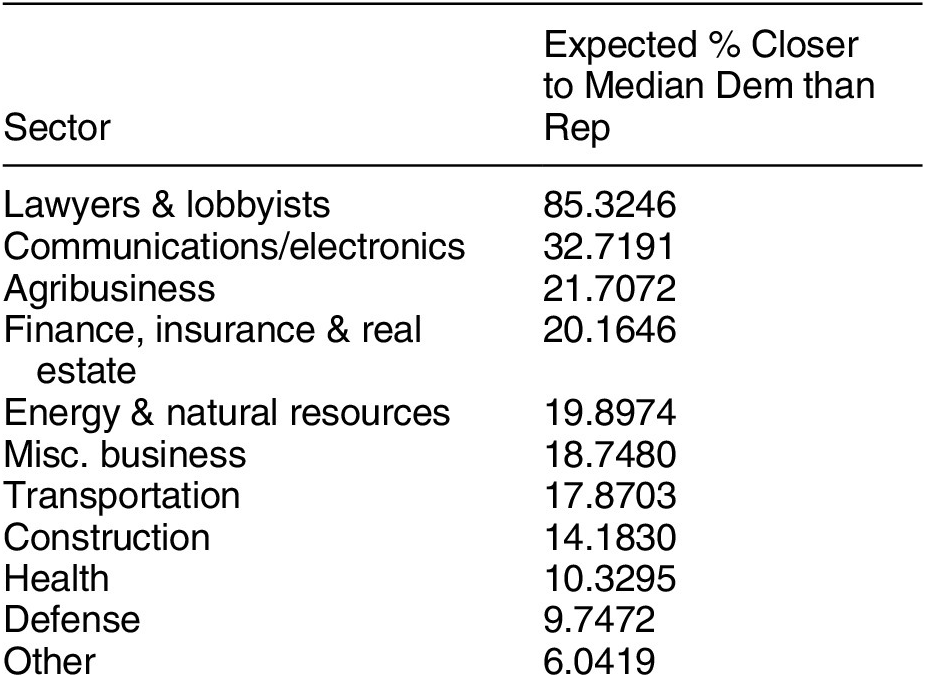
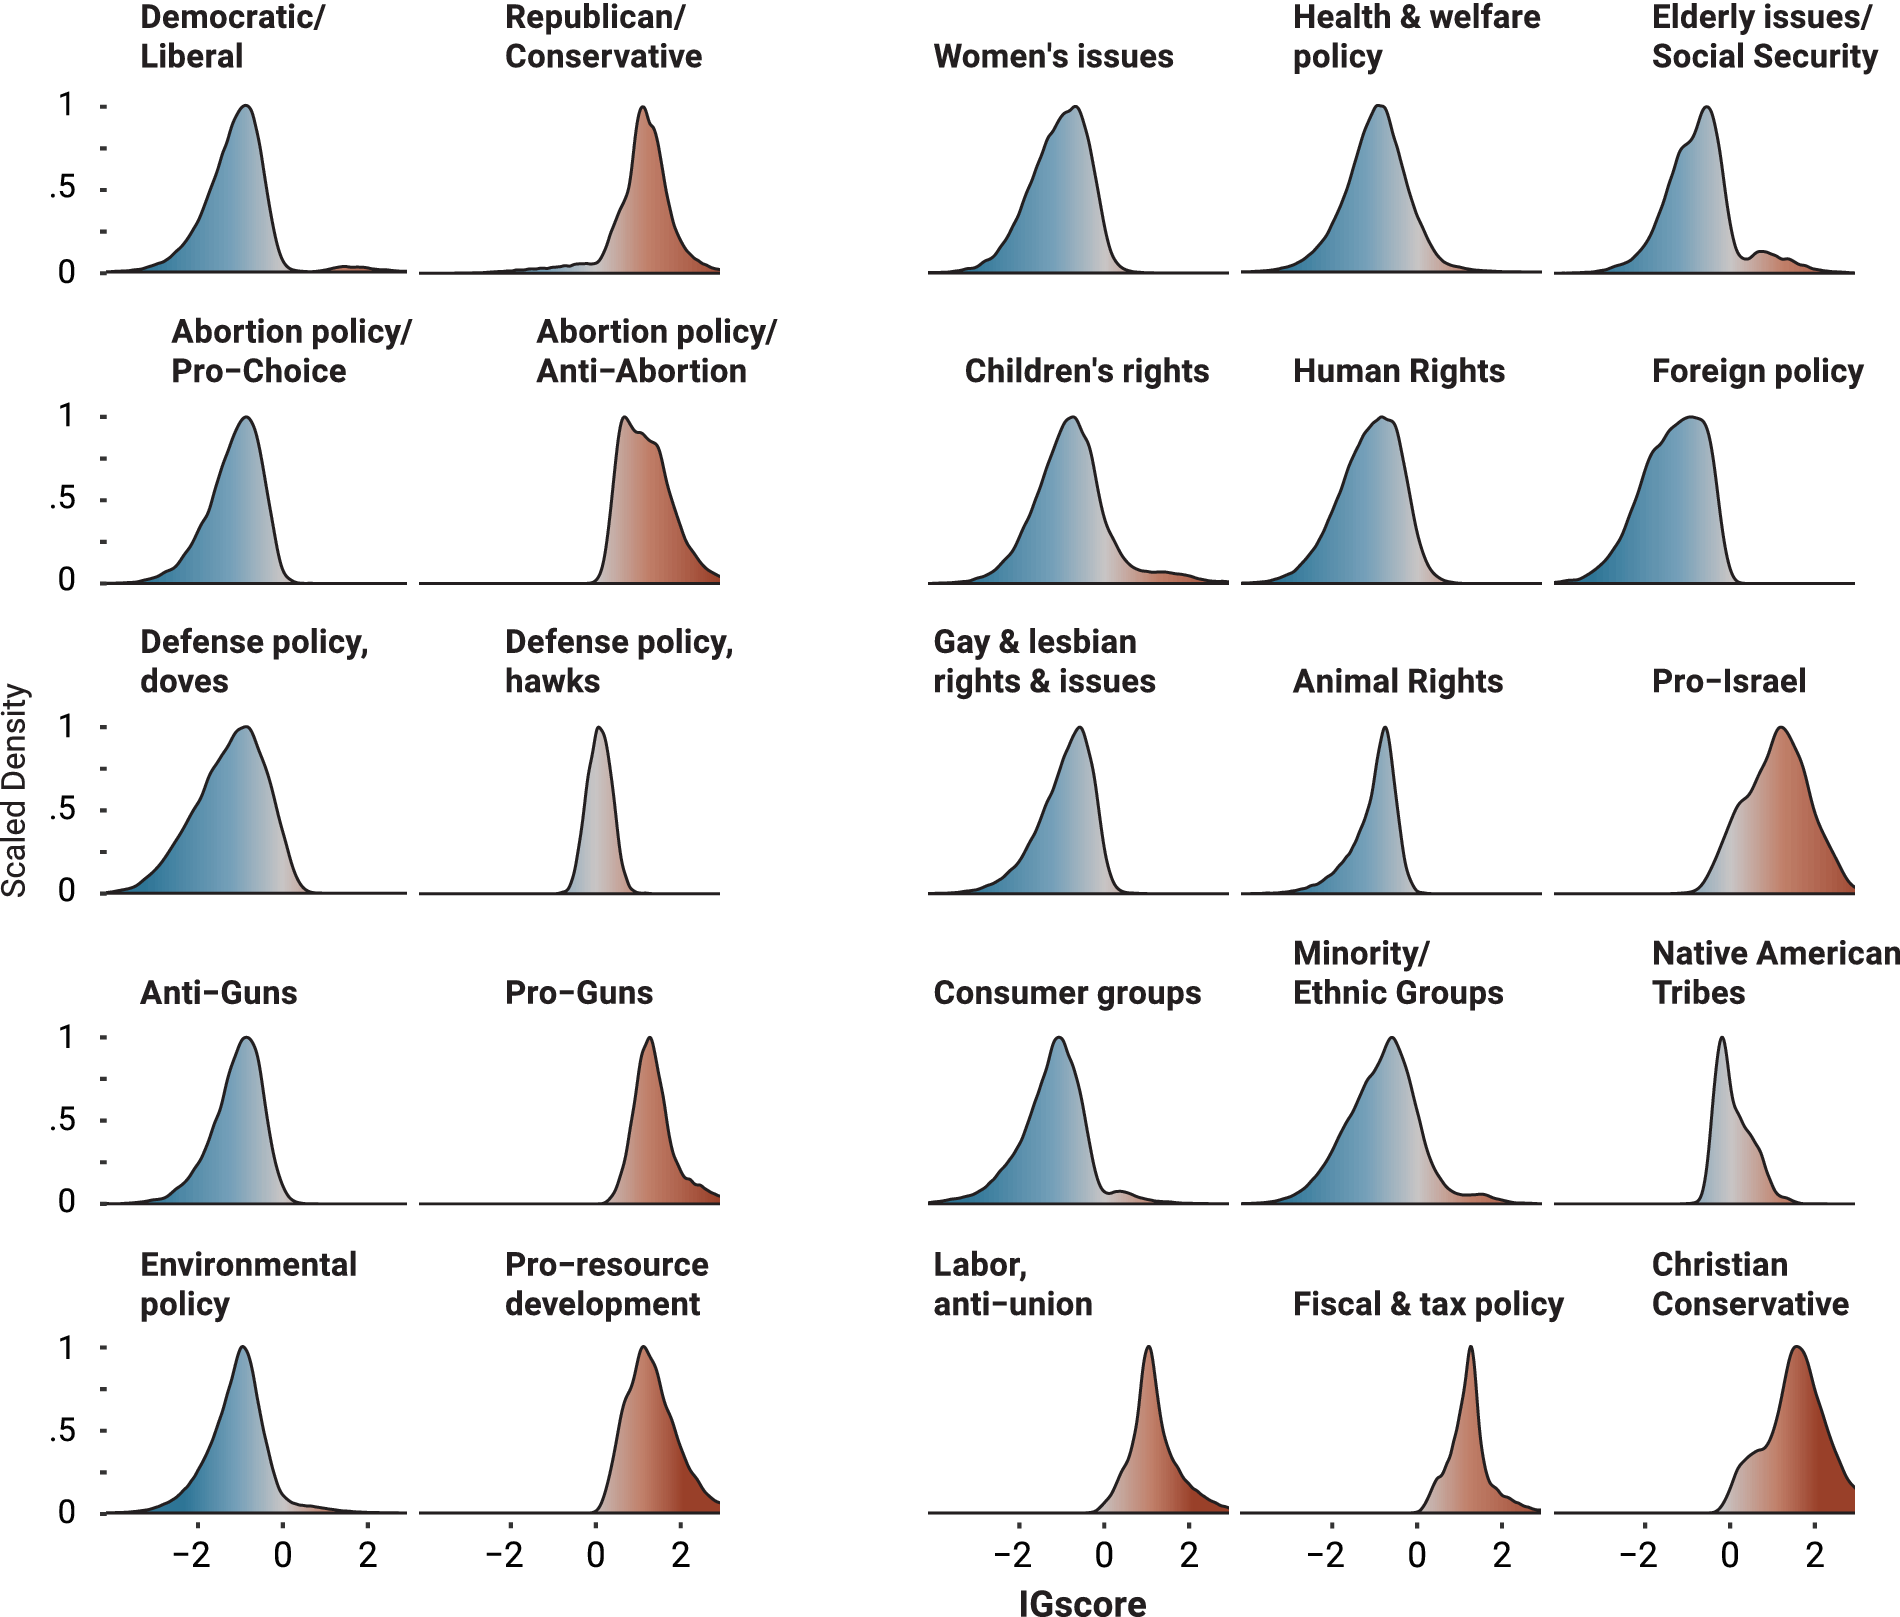
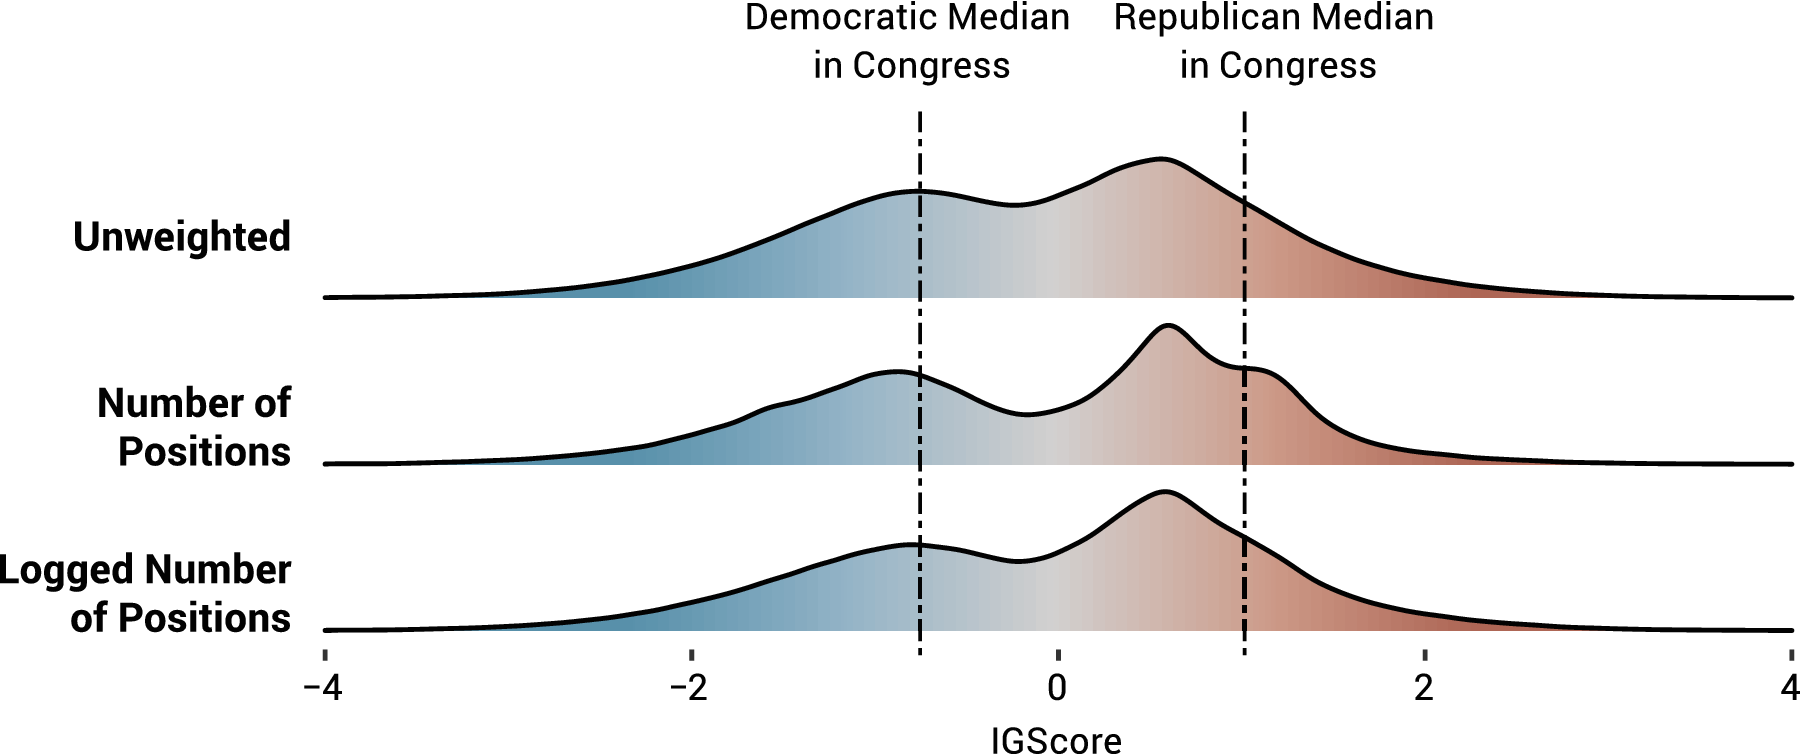

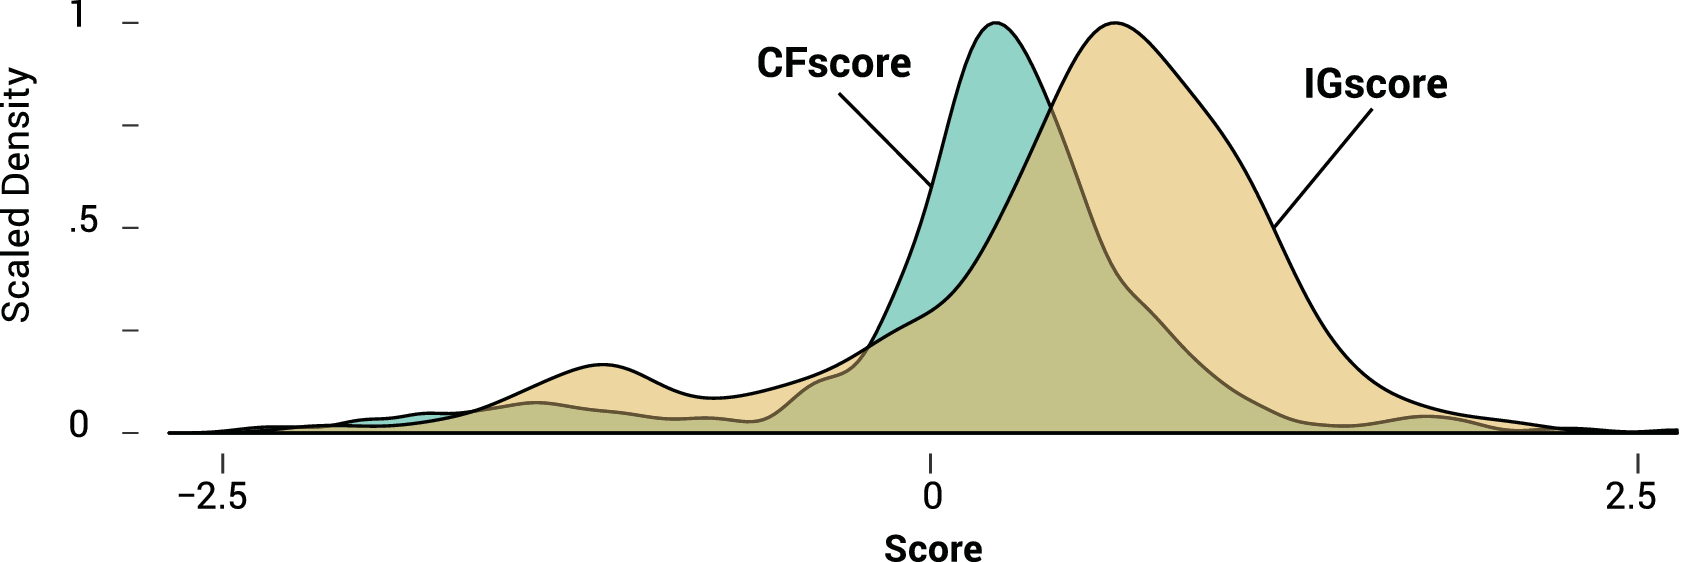
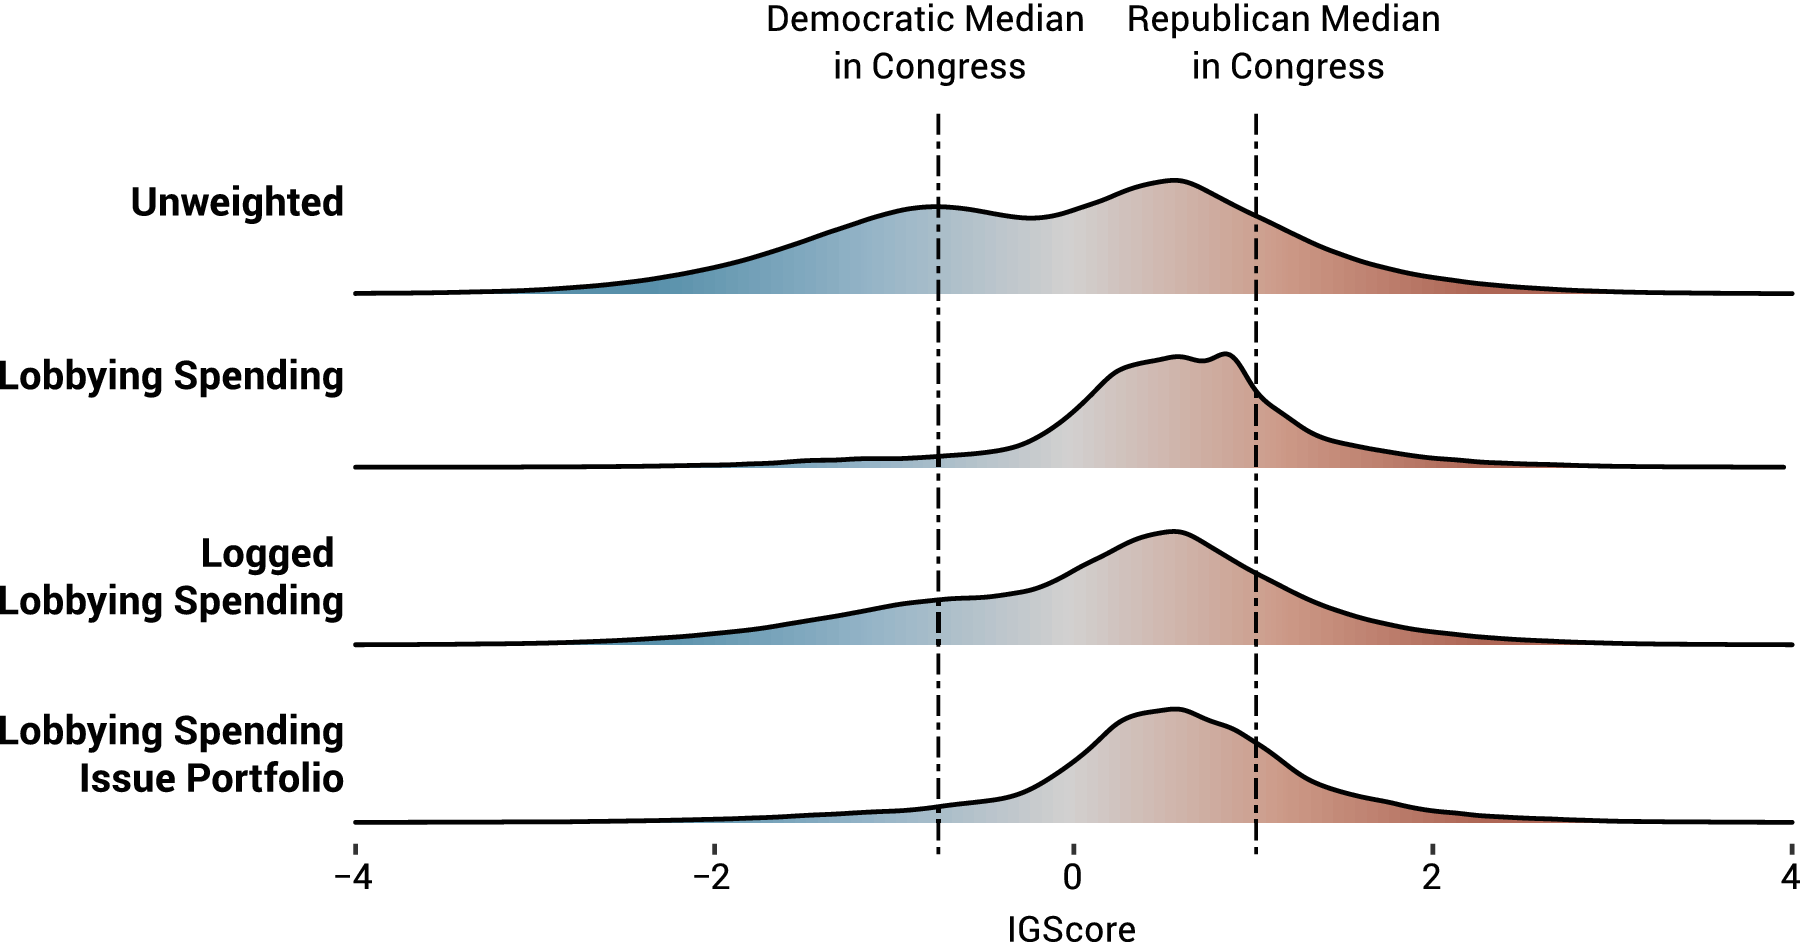




Comments
No Comments have been published for this article.