


I. Introduction
The literature indicates that financially constrained firms save from internal cash flows by comparing the marginal profitability of current and future investments, while the cash saving policies of unconstrained firms remain indeterminate. We theoretically and empirically demonstrate that both constrained and currently unconstrained firms save from external capital. Since raising external capital is costly, firms build cash reserves in a way that lowers the overall cost of capital (COC), averaged over time, for their investment opportunities.
We show that, in the presence of a time-varying COC, which differs from the internal discount rate due to market frictions, firms save cash from external capital issuance when the COC is relatively low. This cash is then used when facing a higher COC for future investments, mitigating the risk of underinvestment when the COC is high, thereby reducing the overall COC. We refer to this incentive as “hedging motive,” which is most pronounced in firms that tend to face a higher COC when they have greater external capital needs. Under uncertainty about the COC and investment opportunities, this hedging motive drives the sensitivity of cash saving to the COC for both financially constrained and (currently) unconstrained firms.
We measure a firm’s time-varying COC by its weighted average cost of capital (WACC) based on its debt-to-equity ratio and the costs of equity and debt. Our focus on WACC is driven by survey evidence indicating that most firms base their decisions on WACC and regularly re-estimate it in response to market dynamics (Zenner, Junek, and Chivukula (Reference Zenner, Junek and Chivukula2014)). The cost of equity (COE) is estimated by the implied required rate of return, obtained by equating the stock price to the present value of future cash flow forecasts. This implied cost of capital (ICC) approach is used to estimate the COE, as previous studies have found that the ICC approach outperforms the CAPM and multi-factor models in measuring the required rate of return in both time series and cross-sectional analyses (Frank and Shen (Reference Frank and Shen2016), Hommel, Landier, and Thesmar (Reference Hommel, Landier and Thesmar2023)). The cost of debt (COD) is estimated as the actual yield on the debt carried by the firm.Footnote 1 We then examine the impacts of the time-varying COC, as well as the cross-sectional differences in firms’ hedging needs, on their cash saving decisions.
We measure a firm’s hedging motive as the time-series regression coefficient of the firm’s external finance needs on the COC, using several standard proxies of external finance needs used in the literature.Footnote 2 A high value of the coefficient indicates that the firm faces a higher COC when it needs more external capital, signifying a high hedging motive. Consistent with our hypotheses, we find that firms’ cash savings from external capital are more sensitive to the COC when their hedging needs are greater. Such firms issue significantly more external capital in excess of their current financial needs to save as cash when the COC is relatively low. We also show that future investment needs influence the sensitivity of cash saving to the COC, especially in firms with a strong hedging motive. These findings support our novel perspective that firms with high hedging motives save cash from external capital to hedge their future investments against a high COC.Footnote 3
To address the endogeneity concern that cash saving may itself affect the COC or that the relationship may be driven by other economic factors, we adopt two identification strategies. The first strategy uses the Regulation Fair Disclosure (Reg FD) in 2000 as a shock to the COC. The purpose of Reg FD is to prevent public companies from selectively disclosing material nonpublic information to certain parties without simultaneously disclosing the information to the general public. Reg FD reduced the COC by leveling the information-playing field, particularly among firms that were more prone to selective disclosure prior to the regulation (Chen, Dhaliwal, and Xie (Reference Chen, Dhaliwal and Xie2010)), which allows us to test our model predictions where market frictions (asymmetric information) affect the COC without changing the internal discount rate.
To exploit the cross-sectional variation in the impact of Reg FD on the COC, we define treatment and control firms based on the market-to-book ratio and R&D ratio before Reg FD. Previous studies show that firms with greater growth opportunities are more likely to disclose material information privately to selected investors (Gintschel and Markov (Reference Gintschel and Markov2004), Hutton (Reference Hutton2005)). Our results indicate that treatment firms experience significantly greater declines in the COC, especially COE, and exhibit increased cash savings from external capital after Reg FD relative to control firms. As a result of the lower COC following Reg FD, treatment firms issue more external capital in excess of their current financial needs and increase their cash savings more in anticipation of future investment than control firms. Moreover, these treatment effects are only significant among firms with high hedging motives. We also verify that pre-existing divergent trends cannot explain our results, and additional placebo tests suggest that our results are more likely to be driven by changes in the COC following Reg FD rather than by unobservable omitted factors such as investment opportunities. Additionally, the inclusion of firm fixed effects helps control for time-invariant unobserved factors that affect firms’ cash saving decisions, while year fixed effects control for economic conditions affecting all firms in a given year.
Secondly, we use the unified monetary policy shock measure developed by Bu, Rogers, and Wu (Reference Bu, Rogers and Wu2021) to capture plausibly exogenous shocks to the COC. Treatment and control firms are defined based on cross-sectional differences in exposure to monetary policy shocks. The exposure is measured by the monetary policy exposure (MPE) index developed by Ozdagli and Velikov (Reference Ozdagli and Velikov2020), which is constructed using observable firm characteristics that capture the effects of various monetary policy transmission mechanisms documented in the literature. We show that contractionary monetary policy shocks increase the COC significantly more for firms with greater exposure to monetary policy shocks (treatment firms) than for those with less exposure (control firms). Moreover, following the increase in COC stemming from monetary policy shocks, treatment firms with high hedging motives save significantly less from external capital relative to those with low hedging motives. Furthermore, the negative effects of contractionary monetary policy shocks on external capital issuance in excess of their current financial needs and cash savings for future investment are particularly pronounced among treatment firms with high hedging motives. These results provide further evidence that firms with high hedging motives are particularly sensitive to COC shocks.
We also find that both financially constrained and unconstrained firms save more in response to a low COC. These are interesting results because, in an important contribution, Almeida, Campello, and Weisbach (Reference Almeida, Campello and Weisbach2004) show that financially constrained firms save from internal cash flows to mitigate underinvestment due to financial constraints. Our findings suggest that firms save not only from internal cash flows to mitigate the effect of financial constraints, but also from external capital to hedge against higher financing costs for future investments. Thus, in the presence of a time-varying COC, both constrained and unconstrained firms are affected by the hedging motive.
Finally, the hedging motive explains the sensitivity of cash saving to the COC independently of market timing or precautionary motives. The market timing motive suggests that firms save from equity issuance proceeds to take advantage of overvalued stock (Kim and Weisbach (Reference Kim and Weisbach2008), Bates, Kahle, and Stulz (Reference Bates, Kahle and Stulz2009)). Market timing of equity issuances is not necessarily motivated by future investments, as pointed out by Bolton, Chen, and Wang (Reference Bolton, Chen and Wang2013). The purpose of precautionary saving is to insulate firms from external finance by saving from internal cash flows (Keynes (Reference Keynes1936)), especially for financially constrained firms. Our evidence reiterates the conclusions of DeAngelo, DeAngelo, and Stulz (Reference DeAngelo, DeAngelo and Stulz2010) and Dittmar, Duchin, and Harford (Reference Dittmar, Duchin and Harford2019) that neither market timing nor the precautionary motive alone can fully explain firms’ cash saving behavior.
II. Related Literature
The literature has offered several explanations for firms’ cash holdings, including macroeconomic conditions (Graham and Leary (Reference Graham and Leary2018)), agency conflicts (Jensen (Reference Jensen1986), Dittmar, Mahrt-Smith, and Servaes (Reference Dittmar, Mahrt-Smith and Servaes2003), Dittmar and Mahrt-Smith (Reference Dittmar and Mahrt-Smith2007), Harford, Mansi, and Maxwell (Reference Harford, Mansi and Maxwell2008), and Nikoloo and Whited (Reference Nikoloo and Whited2014)), tax considerations (Foley, Hartzell, Titman, and Twite (Reference Foley, Hartzell, Titman and Twite2007), Harford, Wang, and Zhangl (Reference Harford, Wang and Zhangl2017), and Faulkender, Hankins, and Petersen (Reference Faulkender, Hankins and Petersen2019)), product market competition (Fresard (Reference Fresard2010)), diversification (Duchin (Reference Duchin2010)), refinancing risk (Harford, Klasa, and Maxwell (Reference Harford, Klasa and Maxwell2014)), and leverage (DeAngelo, Gonçalves, and Stulz (Reference DeAngelo, Gonçalves and Stulz2021)). While most studies focus on the level of cash holdings, we focus on explaining firms’ cash saving behavior (changes in cash). Our study contributes to the literature by demonstrating the importance of the hedging motive for corporate cash savings from external capital in the presence of time-varying COC.
Kim and Weisbach (Reference Kim and Weisbach2008) suggest that firms’ savings from equity issuance reflect the market timing motive to take advantage of overvalued stocks, while McLean (Reference McLean2011) finds that equity proceeds are an important source of cash saving for the precautionary motive. We propose a hedging motive for cash saving from external capital where firms consider both the time variation in COC and future financing needs for investments when making current cash saving and external financing decisions. This hedging motive might help explain the finding of DeAngelo et al. (Reference DeAngelo, DeAngelo and Stulz2010) that most firms with attractive market timing opportunities fail to issue stocks and that many mature firms without apparent financial difficulties and hence with low precautionary motive issue equity to save.
Our study is also related to Azar, Kagy, and Schmalz (Reference Azar, Kagy and Schmalz2016), who suggest that the cost of carry for cash holdings, which depends on the risk-free interest rate, is an important factor explaining the trend in corporate cash holdings over time. However, Gao, Whited, and Zhang (Reference Gao, Whited and Zhang2021) find a hump-shaped relationship between cash holdings and interest rates. They suggest that firms’ precautionary cash demand is nonmonotonically correlated with interest rates and that interest rates are unlikely to explain the recent rise in corporate cash holdings.Footnote 4 Morck, Shleifer, and Vishny (Reference Morck, Shleifer and Vishny1990) and Baker et al. (Reference Baker, Stein and Wurgler2003) suggest that the COC is the key channel through which financial markets affect corporate decisions. To the best of our knowledge, our study is the first to employ the time-varying firm-level COC, which reflects movements in stock prices and interest rates, to provide direct evidence for the impact of the time-varying COC on cash savings from external capital.Footnote 5
Recently, Huang and Ritter (Reference Huang and Ritter2020) and Denis and McKeon (Reference Denis and McKeon2021) show that firms’ debt and equity financing decisions are driven by the expected cash needs rather than by the volatility of cash flows as suggested by the precautionary motive. These firms’ financing decisions are consistent with our hedging motive in that firms save from external financing for future external financing needs. Dittmar et al. (Reference Dittmar, Duchin and Harford2019) maintain that the existing theories fail to explain most within-firm variation in cash savings. Our study shows that the variation in cash savings is sensitive to the within-firm variation of the COC.
We also extend the literature on the effects of financial constraints on cash savings. Almeida et al. (Reference Almeida, Campello and Weisbach2004) suggest that the cash flow sensitivity of cash captures the effect of financial constraints. Riddick and Whited (Reference Riddick and Whited2009) challenge this interpretation by showing that financially constrained firms’ cash savings and cash flows can be negatively related because firms reduce cash to increase investment after receiving positive cash flow shocks. The continuous-time model developed by Bolton et al. (Reference Bolton, Chen and Wang2013) demonstrates that financially constrained firms respond to fluctuations in financing conditions, such as the probability of a crisis, by adjusting cash, payout, and investment decisions for a precautionary motive, and by timing equity markets even without immediate funding needs when firms have low cash holdings. We propose that constrained and (presently) unconstrained firms trade off between not only current and future investments but also the current and future costs of capital in accessing external capital so as to hedge against higher financing costs for future investments. Acharya, Almeida, and Campello (Reference Acharya, Almeida and Campello2007) show that financially constrained firms’ preference for cash saving from internal funds over preserving debt capacity depends on their need to hedge investment opportunities against income shortfalls. Our hedging motive is distinct from theirs because we consider cash savings from external capital (especially equity) in response to the COC.
Our article is related to Eisfeldt and Muir (Reference Eisfeldt and Muir2016), who find a positive correlation between aggregate external financing and cash savings and connect it to the aggregate cost of external finance. We extend the analysis from the aggregate level to the firm level and incorporate a wedge between the COC and the friction-free discount rate into our model. Our study complements Eisfeldt and Muir (Reference Eisfeldt and Muir2016) by highlighting firm-specific, time-varying COC that deviates from the internal discount rate as an important mechanism behind the hedging motive for cash saving decisions. Introducing such a wedge is inspired by earlier work showing that the optimal hurdle rate need not equal the firm’s COC when markets are affected by mispricing or financial frictions (Stein (Reference Stein1996), Warusawitharana and Whited (Reference Warusawitharana and Whited2016)). Recently, Gormsen and Huber (2024) present evidence that discount rates used for investment are sticky with respect to expected inflation and the COC, while Gormsen and Huber (Reference Gormsen and Huber2024) argue that the perceived and true costs of capital often diverge, challenging standard models that assume no such deviations. Gormsen and Huber (Reference Gormsen and Huber2025) suggest that firms make investment decisions based on the inside discount rate (hurdle rate) that can deviate from the perceived COC. The weak relation between discount rates and the perceived COC generates large and time-varying discount rate wedges. Our model builds on these insights by introducing a wedge between the COC and the friction-free discount rate, which drives optimal cash saving behavior.
III. Hedging Motive Hypotheses
A. An Example
We start with a basic example that illustrates the essential elements of our theory. Specifically, we examine the optimal cash-saving policy of a firm that anticipates growth opportunities in the future and faces a time-varying COC. Suppose the firm has $100 in pledgable cash flows at date 2 and an investment opportunity of size $50 at date 1, which yields a return of 21% between date 1 and date 2. If the COC at date 1, denoted as
$ {\delta}_1 $
 , exceeds 21%, then the firm will not find it profitable to invest at that time unless it possesses cash; otherwise, the project would yield a positive net present value (NPV).
Let us then consider a firm whose
$ {\delta}_1 $
 does exceed 21%. This situation characterizes a “hedging motive” firm. To make the investment profitable at date 1, the firm can issue external capital against date 2 cash flows at date 0 and save cash. We denote the per-period COCat date 0 for raising two-period capital as
$ {\delta}_0 $
 . In other words, to raise $1 at date 0, the firm needs to repay external financiers
$ {\left(1+{\delta}_0\right)}^2 $
 at date 2. If
$ {\delta}_0 $
 satisfies the condition
$ {\left(1+{\delta}_0\right)}^2<1.21 $
 (equivalently
$ {\delta}_0<10\% $
 ), then it is optimal for the firm to issue external capital at date 0 and save as cash for investment needs at date 1. In fact, even if
$ {\delta}_1 $
 is less than 21%, it may be optimal for the firm to issue at date 0 and save (instead of issuing at date 1 to fund the project) if
$ {\delta}_0 $
 is sufficiently low. The more general condition that recognizes the positive NPV condition, as well as the intertemporal optimization across time-varying costs of capital, is thus
$ {\left(1+{\delta}_0\right)}^2<\mathit{\min}\left[1.21,\left(1+{\delta}_1\right)\right] $
 .
We introduce a parameter
$ \gamma $
 that characterizes a positive coincidence of investment needs and a high COC. Firms at date 1 are distributed based on the value of
$ \gamma $
 , where
$ {\delta}_1={\overline{\delta}}_1\left(1+\gamma \right) $
 and
$ {\overline{\delta}}_1 $
 is a constant determining the overall level of COC at date 1. Intuitively, a firm with a high
$ \gamma $
 has a higher COC for its investment at
$ t=1 $
 . Specifically, a firm will issue external capital at date 0 and save cash for investment at date 1 if and only if
$ {\left(1+{\delta}_0\right)}^2<1+{\overline{\delta}}_1\left(1+\gamma \right) $
 . Define
$ {\gamma}^{\ast}\equiv \left[{\left(1+{\delta}_0\right)}^2-\left(1+{\overline{\delta}}_1\right)\right]/{\overline{\delta}}_1 $
 . If
$ \gamma \le \gamma \ast $
 , then the firm has no hedging motive. If
$ \gamma >\gamma \ast $
 , then the firm does have a hedging motive. In the model presented in the next section, we generalize this example to show that both constrained and (presently) unconstrained firms save by issuing external capital when
$ \gamma $
 , the hedging motive, is high.
B. The Model
To understand how variation in the COC, denoted by
$ \delta $
 , affects cash savings, we consider a two-period model where a firm’s initial shareholders (referred to as insiders or the firm) make the cash saving decision to lower the overall COC for investments. Our model introduces a friction-induced wedge between the firm’s COC and the friction-free discount rate (or opportunity cost of internal funds). This wedge, and thus the firm-level COC, varies over time with external financing conditions that reflect information asymmetry and macroeconomic conditions.Footnote
6 To maximize the value of discounted cash flows, the firm makes investment, financing, and saving decisions at the initial stage, with observed
$ {\delta}_0 $
 for future investment needs.
The firm is endowed with
$ {W}_0 $
 . At
$ t=0 $
 , the firm invests
$ {I}_0 $
 , which yields a return of
$ \pi \left({I}_0\right) $
 at
$ t=2 $
 and presents an opportunity to expand operations at
$ t=1 $
 . We assume that the return function exhibits diminishing returns, characterized by
$ {\pi}_I>0 $
 and
$ {\pi}_{II}<0 $
 .Footnote
7 To finance this investment, the firm raises external funds
$ {X}_0 $
 at a fixed per-period cost
$ {\delta}_0 $
 and saves
$ {C}_0={W}_0+{X}_0-{I}_0 $
 for its investment opportunity at
$ t=1 $
 . We assume that cash holdings earn zero return.
Let
$ {z}_1 $
 denote the cash flow to assets realized at
$ t=1 $
 with a mean of zero and variance
$ {\sigma}^2 $
 . At
$ t=1 $
 , the firm has cash
$ {W}_1={C}_0+{z}_1 $
 and makes investments
$ {I}_1 $
 , which generates
$ \pi \left({I}_1\right) $
 at
$ t=2 $
 . The insiders face opportunity costs
$ {\rho}_t>0 $
 (
$ t=0,1 $
 ), representing the friction-free discount rate for the period
$ \left[t,t+1\right] $
 , if
$ {W}_t $
 is used to finance investment
$ {I}_t $
 . If the firm raises capital
$ {X}_t $
 from outside investors, the external financing costs,
$ {\delta}_t $
 , exceed
$ {\rho}_t $
 due to market frictions. Below, we show that the wedge between
$ {\rho}_t $
 and
$ {\delta}_t $
 is a key element determining the optimal cash saving and that variation in
$ {\delta}_t $
 drives the firm’s incentive to save cash when the COC is low in order to hedge against underinvestment when the COC is high.
The following timeline illustrates the firm’s cash flows and decisions:

The firm maximizes the present value of expected cash flows after accounting for financing costs as follows:

The first term on the right-hand side of equation (1) represents the present value of the net profit from the initial investment
$ {I}_0 $
 made at
$ t=0 $
 with external finance
$ {X}_0 $
 and the second term represents the present value of
$ {V}_1 $
 which is the present value at
$ t=1 $
 of net profit from subsequent investments
$ {I}_1 $
 made after realizing cash flow
$ {z}_1 $
 at
$ t=1 $
 with external finance
$ {X}_1 $
 .
The expected value of
$ {V}_1 $
 can be expressed as follows:

where
$ {\hat{I}}_1 $
 is investment with
$ {\pi}_I\left({\hat{I}}_1\right)=\left(1+{\delta}_1\right) $
 ,
$ {X}_1\left(={\hat{I}}_1-{W}_1\right) $
 is external finance, and
$ {I}_1^{\ast } $
 is the first-best investment with
$ {\pi}_I\left({I}_1^{\ast}\right)=\left(1+{\rho}_1\right) $
 . The last term on the right-hand side of equation (2) represents the expected return from investment when having enough cash to make the first-best investment (
$ {I}_1^{\ast}\le {W}_1 $
 ). In this case, the first-best investment,
$ {I}_1^{\ast } $
 , is determined by the FOC:
$ {\pi}_I\left({I}_1^{\ast}\right)=\left(1+{\rho}_1\right) $
 . For simplicity, we assume that any surplus cash at
$ t=1 $
 , occurring when total available funds exceed the optimal investment level (
$ {W}_1={z}_1+{C}_0>{I}_1^{\ast } $
 ), is distributed to initial shareholders.
The first and second terms represent the expected returns from investing below the first best when the firm does not have sufficient internal fund at
$ t=1 $
 (
$ {W}_1<{I}_1^{\ast } $
 ). In the first term, the firm lacks cash and raises external finance (
$ {X}_1>0 $
 ). Investment is determined by
$ {\pi}_I\left({\hat{I}}_1\right)=1+{\delta}_1 $
 . Since
$ {\pi}_I\left({\hat{I}}_1\right)=\left(1+{\delta}_1\right)>\left(1+{\rho}_1\right)={\pi}_I\left({I}_1^{\ast}\right) $
 , we have
$ {\hat{I}}_1<{I}_1^{\ast } $
 , the investment falls below the first-best level when cash is insufficient. Saving cash at
$ t=0 $
 can reduce reliance on costly external funds at
$ t=1 $
 and move investment toward
$ {I}_1^{\ast } $
 . Thus, cash savings mitigate underinvestment stemming from the wedge between
$ {\rho}_1 $
 and
$ {\delta}_1 $
 .Footnote
8
In this case, we can also see that saving cash at
$ t=0 $
 is valuable when the COC varies over time. Each dollar saved at
$ t=0 $
 entails a compounded two-period cost of
$ {\left(1+{\delta}_0\right)}^2 $
 , but it avoids raising external capital at
$ t=1 $
 and repaying
$ \left(1+{\delta}_1\right) $
 at
$ t=2 $
 . Thus, the NPV of cash savings at
$ t=0 $
 is given by
$ \int_{-\infty}^{{\hat{I}}_1-{C}_0}\left\{\frac{\left(1+{\delta}_1\right)-{\left(1+{\delta}_0\right)}^2}{\left(1+{\rho}_0\right)\left(1+{\rho}_1\right)}{C}_0\right\}g(z) dz $
 . This NPV is positive if
$ \left(1+{\delta}_1\right)>{\left(1+{\delta}_0\right)}^2 $
 . Therefore, firms with a lower
$ {\delta}_0 $
 have an incentive to issue external finance and save cash to avoid higher financing costs for future investment.
The second term represents a “sliding area,” where the firm invests all available cash,
$ {I}_1={W}_1 $
 , without raising external finance because we have
$ {\pi}_I\left({\hat{I}}_1\right)=\left(1+{\delta}_1\right)>{\pi}_I\left({I}_1\right)>\left(1+{\rho}_1\right)={\pi}_I\left({I}_1^{\ast}\right) $
 , for
$ {I}_1\in \left({\hat{I}}_1,{I}_1^{\ast}\right) $
 . With cash saving
$ {C}_0 $
 , the firm’s investment approaches the first-best investment, while shifting away from external-financed investment,
$ {\hat{I}}_1 $
 .
While saving cash at
$ t=0 $
 lowers the future repayment burden (
$ 1+{\delta}_1\Big){X}_1 $
 by reducing the need for external financing at
$ t=1 $
 , surplus cash at
$ t=1 $
 incurs an opportunity cost. A higher expected first-best investment
$ {I}_1^{\ast } $
 increases the value of saving cash by reducing the probability of surplus cash while reducing future reliance on costly external finance. Consequently, the firm with a higher expected investment has a stronger incentive to save at a currently low COC to hedge against a higher future COC for future investment.
Moving back to the first period, the firm maximizes
$ {V}_0 $
 . We derive the FOCs in the Supplementary Material, which show that optimal cash saving and investment decisions satisfy the following conditions:


where
$ G=\frac{1}{\left(1+{\rho}_0\right)}\left\{\int_{-\infty}^{{\hat{I}}_1-{C}_0}\;\left(\frac{1+{\delta}_1}{1+{\rho}_1}\right)g(z) dz+\int_{{\hat{I}}_1-{C}_0}^{I_1^{\ast }-{C}_0}\frac{\pi_I\left({I}_1\right)}{\left(1+{\rho}_1\right)}g(z) dz+\int_{I_1^{\ast }-{C}_0}^{\infty }g(z) dz\right\} $
 is the expected marginal benefit of cash saving at
$ t=0 $
 . This reflects the hedging benefit of cash, which enables the firm to undertake more investment at date 1. When no future investment is anticipated, the benefit of cash savings is minimal. The FOCs indicate that the firm’s cash saving decision is driven by a trade-off between the current COC and the hedging benefit of cash saving.
We formally derive the following results:
Result 1. The optimal external finance,
$ {\hat{X}}_0 $
 , cash saving,
$ {\hat{C}}_0 $
 , and investment,
$ {\hat{I}}_0 $
 , exhibit the following properties:

Proof. See the Supplementary Material.
Result 1 suggests that the firm adjusts its cash savings and external capital raised at
$ t=0 $
 based on the COC(
$ {\delta}_0 $
 ). Specifically, the firm reduces cash savings and external capital when facing a higher COC, and increases them when facing a lower COC.
If the firm is currently constrained (
$ {W}_0<{I}_0^{\ast } $
 , where
$ {I}_0^{\ast } $
 is the first-best investment), it will increase external finance, cash savings, and investment in response to a lower COC to satisfy the FOCs. The firm will choose optimal cash savings by issuing excess capital until the marginal benefit of cash savings,
$ G $
 , equals the marginal cost of external finance.
If the firm is currently unconstrained but “overall” intertemporally constrained (
$ {I}_0^{\ast}\le {W}_0<{I}_0^{\ast }+{I}_1^{\ast } $
 ), the financial constraint is not currently binding, but the external finance constraint at
$ t=1 $
 is still binding. It may currently make the optimal investment without issuing external finance and pay out the remaining to shareholders if it does not consider future financing needs. However, when facing future financing needs with uncertainty, the firm will reduce payout and increase
$ {X}_0 $
 to save cash until its marginal benefit equals the marginal cost. If
$ {\delta}_0 $
 is lower, the firm will issue more external capital
$ {X}_0 $
 to save for
$ {I}_1 $
 . Thus, both currently constrained and future constrained firms save by issuing excess capital (
$ {X}_0-{I}_0 $
 ) when the COC is lower. Facing uncertain investment opportunities and cash flows, no firm will be completely insulated from the external capital market. Cash saved today reduces future external capital needs, underinvestment, and the total costs of external capital.
The precautionary motive suggests that a firm’s cash savings are driven by uncertain future cash needs, whereas the market timing suggests that external financing is driven by a lower COC.Footnote
9 As shown below, what distinguishes the hedging motive from these alternative motives is that the correlation between the COC and external capital needs, denoted by
$ \gamma $
 , drives the sensitivity of cash saving to the COC.
To capture the firm’s hedging motive more generally, we introduce a parameter
$ \gamma $
 that characterizes a positive coincidence of investment needs and a high COC. Firms at date 1 are distributed based on the value of
$ \gamma $
 with
$ {\delta}_1={\overline{\delta}}_1\left(1+\gamma \right) $
 , where
$ {\overline{\delta}}_1 $
 is a constant determining the overall level of COC at date 1. With this specification, the firm’s optimal investment using external financing at
$ t=1 $
 is given by
$ {\pi}_I\left({\hat{I}}_1\right)=1+\left(1+\gamma \right){\overline{\delta}}_1 $
 . Thus, with a higher
$ \gamma $
 , the firm incurs higher costs for additional external financing, which in turn reduces its investment below the first-best level. A higher
$ \gamma $
 becomes particularly onerous if the firm faces a negative cash flow shock and expects a large investment. Such a firm will have a greater incentive to save when facing a lower COC at
$ t=0 $
 .
Given that the effect of external finance is greater for a higher
$ \gamma $
 , firms with a high
$ \gamma $
 will have stronger incentives to save when the COC is relatively low. Thus, we can consider cross-sectional variations in the cash saving motive by analyzing firms’ optimal saving decision
$ t=0 $
 with respect to
$ \gamma $
 :
Result 2. The correlation between external capital needs and the COC,
$ \gamma $
 , increases the sensitivity of optimal cash saving
$ {\hat{C}}_0 $
 to
$ {\delta}_0 $
 ;

Proof. See the Supplemntary Material.
Result 2 shows the direct effect of the correlation between external capital needs and COC on the sensitivities of the optimal cash saving decisions to the COC. Firms with a high
$ \gamma $
 may have to reduce investment due to higher external finance costs when facing lower cash flows and hence have a higher marginal value of cash saving (
$ G $
 ). Accordingly, such firms can issue excess external capital (
$ {X}_0-{I}_0 $
 ) and save for future investment, thereby reducing their overall cost of external finance. Consequently, the amount of cash saving and excess capital issuance in response to the COC at
$ t=0 $
 should be greater when firms face a higher
$ \gamma $
 .
Given the above results, we propose the following hedging motive hypotheses:
Hypothesis 1a. Both constrained and unconstrained firms save more from external finance when the COC is relatively low.
Hypothesis 1b. Firms with high hedging motives will save more from external finance when the COC is relatively low.
Hypothesis 1c. Firms with high hedging motives will issue more excess external capital when the COC is relatively low.
Hypothesis 1d. Firms with high hedging motives have a higher cash saving sensitivity to the COC when they expect more future investment.
The two results above show how the exogenous change in the COC at
$ t=0 $
 affects a firm’s cash saving policy. However, there may be cases where a shock affects both the COC at
$ t=0 $
 and the expected COC at
$ t=1 $
 . We refer to this as a permanent shock to the COC. For example, Reg FD mandates simultaneous public disclosure of material information, reducing information asymmetry and potentially permanently lowering the COC. Moreover, a shock may not only change the COC but also affect the friction-free rate of return,
$ {\rho}_0 $
 . A unified monetary policy shock is a good example of this type. To better capture the impacts of various shocks to the COC, we make the following extensions to our model:
Extension 1. The optimal cash saving
$ {\hat{C}}_0 $
 exhibits the following properties in the presence of a permanent shock of the same magnitude to both
$ {\delta}_0 $
 and
$ {\delta}_1 $
 :

Proof. See the Supplementary Material.
Extension 2. The optimal external finance,
$ {\hat{X}}_0 $
 , cash saving,
$ {\hat{C}}_0 $
 , and investment,
$ {\hat{I}}_0 $
 , exhibit the following properties in the presence of a monetary policy shock, which leads to the changes in both the friction-free rate and the COC with
$ 0<\frac{d{\rho}_0}{d{\delta}_0}\le 1 $
 :

Proof. See Suplementary Material.
IV. Data and Variables
A. Sample
Our initial sample includes all U.S. firms from the annual Compustat files for the 1981–2020 period. We require that firms have positive values for total assets, equity, cash holdings, and net sales. Financial firms (SIC codes 6000–6799) and regulated utilities (SIC codes 4900–4999) are excluded from the sample. We obtain analysts’ earnings and growth forecasts and stock prices from IBES. Observations with missing net income and stock price are excluded. We require nonmissing data for the prior year’s book value, earnings, and dividends. When explicit forecasts are unavailable, we obtain forecasts by applying the long-term growth rate to the prior year’s earnings forecast.
B. Cost of Capital
It is challenging to estimate individual firms’ COC because the COE and the COD are not directly observable. In light of the findings of Frank and Shen (Reference Frank and Shen2016) and Hommel et al. (Reference Hommel, Landier and Thesmar2023), we measure the COE using the ICC approach, which estimates the required rate of return implied by market prices.Footnote
10 Specifically, the ICC is the discount rate that equates a stock’s present value of expected cash flows to its current price. According to the discounted cash flow model, the stock price of a firm at time
$ t $
 is given by

where
$ {P}_t $
 is the market value of the stock at time
$ t $
 ,
$ {E}_t\left({FE}_{t+k}\right) $
 is the expected free cash flow to equity at time
$ t+k $
 , and
$ {ICC}_t $
 is the implied COE capital.
To estimate the COE, we use three models based on analyst forecasts proposed by Gebhardt, Lee, and Swaminathan (Reference Gebhardt, Lee and Swaminathan2001), Claus and Thomas (Reference Claus and Thomas2001), and Li et al. (Reference Li, Ng and Swaminathan2013), and one residual income model developed by Li and Mohanram (Reference Li and Mohanram2014). The consensus analyst forecasts from IBES are used to predict future earnings per share. Given that firms are required to file their financial statements within 90 days of the fiscal year end, we estimate the COE using the earliest forecasts available after 3 months of the prior fiscal year end. As these models rely on analyst forecasts to estimate future free cash flow to equity, the estimated ICC is only available for firms with both analyst coverage and positive earnings forecasts. To circumvent this disadvantage, we also use the approach developed in Li and Mohanram (Reference Li and Mohanram2014) to forecast future earnings from cross-sectional residual income models. Since this approach does not use analyst forecasts, it helps mitigate concerns about potential biases in analyst forecasts (Hoberg and Philips (Reference Hoberg and Philips2010)), and allows us to include firms with no analyst coverage and negative earnings. The specific estimation procedures are provided in Section D of the Supplementary Material. The reported results in the tables to follow are based on the Gebhardt et al. (Reference Gebhardt, Lee and Swaminathan2001) approach. The results are robust to alternative COE estimation methods (see Section A2 of the Supplementary Material).
We estimate the COC as follows:

where
$ {COC}_{i,t} $
 is the WACC of firm
$ i $
 in year
$ t $
 .
$ \frac{Debt_{it}}{MVA_{it}} $
 is the market leverage ratio.
$ {COD}_{i,t} $
 is the cost of debt of the firm
$ i $
 in year
$ t $
 proxied by the actual yield on the debt carried by the firm, as used in Frank and Shen (Reference Frank and Shen2016).Footnote
11 The COC of each firm is estimated for each year.
Hedging Motive Measures
We measure the hedging motive at the firm level by the time series regression coefficient of its external capital needs on its COC.Footnote 12 We follow Shyam-Sunder and Myers (Reference Shyam-Sunder and Myers1999), Frank and Goyal (Reference Frank and Goyal2003), and Byoun (Reference Byoun2008) to capture firms’ needs for external capital as follows:

where
$ Div $
 is the cash dividend;
$ Acq $
 is acquisitions;
$ Inv $
 is net investments;
$ ICF1 $
 is income before extraordinary (ibc) items plus depreciation and amortization (dpc), and
$ TA $
 is total assets at the beginning of the period. We regress the annual external capital needs of an individual firm on its COC over the sample period. Based on the estimated coefficient, which is our hedging motive measure, we define firms in the top 30% as “high hedging motive firms” and those in the bottom 30% as “low hedging motive firms,”removing the middle 40%. We also use two alternative measures of hedging motives for a robustness check (reported in Panel D of Table A2 in the Supplementary Material).
V. Empirical Analysis
A. Univariate Analysis
The summary statistics of the firm characteristic variables and the COC are reported in Panel A of Table 1. The average cash holding is 14.17% of total assets, and the cash saving rate is approximately 1.84% of total assets. The average COC is 11.15%, with an average COE of 12.93% and an average COD of 7.53%.Footnote 13 Panel B shows the decomposition of the standard deviation of the COC across firms and over time. As expected, the COD exhibits less variation than the COE across firms and over time. The COE varies much more over time than across firms. In Panel C, we compare the standard deviation of the COE, COD, and COC over time between high and low hedging motive firms. The COC of firms with high hedging motives fluctuates more over time than that of firms with low hedging motives.

Table 1 Long description
The table is divided into three sections.
Panel A, Summary Statistics, lists 16 variables with their Mean, Median, and Standard Deviation. Key values include:
* Delta Cash: Mean 0.0184, Median 0.0029, Std. Dev. 0.1214.
* Cash: Mean 0.1417, Median 0.0826, Std. Dev. 0.1566.
* ExCapital: Mean 0.0286, Median 0.0000, Std. Dev. 0.1301.
* I C F: Mean 0.1171, Median 0.1102, Std. Dev. 0.1021.
* Size: Mean 6.5656, Median 6.4405, Std. Dev. 1.9035.
* M forward slash B: Mean 1.8381, Median 1.4936, Std. Dev. 1.0558.
* Vol: Mean 0.0158, Median 0.0138, Std. Dev. 0.0099.
* Dividend: Mean 0.0143, Median 0.0054, Std. Dev. 0.0199.
* Leverage: Mean 0.2086, Median 0.1959, Std. Dev. 0.1644.
* N W C: Mean 0.2532, Median 0.2371, Std. Dev. 0.2090.
* CapEx: Mean 0.1227, Median 0.0778, Std. Dev. 0.2073.
* Acquisitions: Mean 0.0426, Median 0.0000, Std. Dev. 0.1551.
* R and D: Mean 0.0528, Median 0.0010, Std. Dev. 3.9241.
* C O E: Mean 0.1293, Median 0.0998, Std. Dev. 0.1286.
* C O D: Mean 0.0753, Median 0.0721, Std. Dev. 0.0331.
* C O C: Mean 0.1115, Median 0.0902, Std. Dev. 0.0931.
Panel B, Standard Deviation, compares Cross-Section and Time-Series values for:
* C O E: Cross-Section 0.0922, Time-Series 0.1032.
* C O D: Cross-Section 0.0298, Time-Series 0.0221.
* C O C: Cross-Section 0.0524, Time-Series 0.0787.
Panel C, Compare Time Series Standard Deviation, contrasts High and Low hedging motive firms across:
* High hedging motive firms: C O E 0.1275, C O D 0.0229, C O C 0.0952.
* Low hedging motive firms: C O E 0.1107, C O D 0.0224, C O C 0.0867.
Figure 1 plots cash holdings as a percentage of total assets and the annual average COC for all sample firms over the sample period. The inverse relationship suggests that firms increase (decrease) cash when the COC is low (high). To examine how the variation in the COC relates to corporate cash saving, we obtain a firm’s COC minus its historical average for firms with a minimum of 3 years of data. Graph A of Figure 2 plots cash savings across deciles of the deviation of COC from the historical average for the sample period 1981–2020 and the subsample periods 1981–2000 and 2001–2020. The downward-sloping graphs indicate that firms save more when the COC is lower relative to the historical average. Graph B presents cash savings across deciles of the deviation of COC from the historical average, separately for high and low hedging motive firms. Figure 2 shows that cash saving of high hedging motive firms is particularly sensitive to the variation in the COC. The sensitivity of cash saving to the variation in the COC is weaker for firms with low hedging motives.
Figure 1 shows the scatter plot between annual average cash holdings as a percentage of total assets and the COC. Cash is cash and equivalents divided by total assets.

Figure 1 Long description
A scatter plot with the horizontal X axis labeled C O C and the vertical Y axis labeled Cash Holdings. Both axes are measured in percentages. The X axis ranges from 8.00 percent to 20.00 percent in increments of 2.00 percent. The Y axis ranges from 5.00 percent to 25.00 percent in increments of 5.00 percent.
Data points are distributed as follows:
* At the far left, two outliers show high Cash Holdings above 25.00 percent when C O C is below 10.00 percent.
* Between 10.00 percent and 13.00 percent C O C, there is a steep downward cluster where Cash Holdings drop rapidly from approximately 18.00 percent to 10.00 percent.
* From 14.00 percent to 19.00 percent C O C, the data points level off, forming a flatter horizontal band where Cash Holdings remain relatively stable between 6.00 percent and 10.00 percent.
The overall trend is an L-shaped curve, indicating that as the cost of capital increases, cash holdings decrease sharply before stabilizing at a lower level.
Figure 2 presents firms’ cash saving percentage of lagged total assets across deciles of the deviation of the cost of capital from its historical average for firms with a minimum of 3 years of observations for the 1981–2020 sample period and the 1981–1999 and 2000–2020 subsample periods (Graph A), firms with high hedging motives and firms with low hedging motives (Graph B). Cash saving denotes the changes in cash and equivalents divided by total assets at the beginning of the year.

Figure 2 Long description
A two-panel line graph.
Graph A, titled All Firms, plots Cash Saving on the vertical axis from 0.60 percent to 2.60 percent against Deviation from Average C O C on the horizontal axis with decile values from negative 9.7 percent to 13.6 percent. Three lines are shown. The 2000-2020 period (black dash-dot line with circles) remains the highest, starting at 2.5 percent and decreasing to 1.1 percent. The 1981-2020 period (solid blue line with squares) starts at 2.4 percent and ends at 1.0 percent. The 1981-2000 period (orange dashed line with triangles) is the lowest, starting at 2.3 percent and ending at 0.8 percent. All three lines show a consistent downward trend as C O C deviation increases.
Graph B, titled High Hedging Motive versus Low Hedging Motive Firms, plots Cash Saving from 0.00 percent to 3.00 percent against Deviation From Average C O C from negative 5.90 percent to 14.84 percent. The Low Hedging Motive line (solid blue with squares) starts at 2.6 percent, drops to 1.5 percent, and then plateaus horizontally. The High Hedging Motive line (orange dashed with triangles) starts at 2.4 percent and shows a steep, continuous decline, ending significantly lower at approximately 0.25 percent.
To examine whether firms’ cash saving is related to future investment, Figure 3 plots the current year cash savings across future investment (subsequent 2-year average) deciles. Figure 3 shows that firms with greater future investment save more cash in the current year, which is consistent with the hedging motive view that firms save cash for future investments.
Figure 3 plots firms’ cash savings relative to future investment deciles. Future investment is defined as the 2 subsequent years’ average of net investment. Cash saving is the current year change in cash and equivalents divided by lagged total assets.

Figure 3 Long description
The X-axis represents Future Investment Deciles from 1 to 10. The primary Y-axis on the left measures Future Investment as a percentage, ranging from negative 5.00 percent to 25.00 percent. The secondary Y-axis on the right measures Cash Saving as a percentage, ranging from 0.00 percent to 4.00 percent.
Two lines are plotted:
* Future Investment (orange dashed line with triangle markers): Shows a consistent exponential increase. It starts near 0.00 percent at decile 1 and rises sharply to approximately 22.00 percent at decile 10.
* Cash Saving (blue solid line with circular markers): Follows a similar upward trajectory but with more volatility in the lower deciles. It remains near 0.50 percent between deciles 1 and 5, then increases rapidly from decile 6 to reach its peak at approximately 4.20 percent at decile 10.
The two lines intersect near decile 7, where both metrics begin their steepest ascent.
B. Cost of Capital and Cash Saving
To test the hypothesis that firms build cash savings from external capital, we first evaluate the relative importance of external capital to internal cash flows by estimating the following regression:

where
$ \Delta {Cash}_{it} $
 is the change in cash and equivalents of firm
$ i $
 in year
$ t $
 ;
$ {ICF}_{it} $
 is internal cash flow; and
$ {ExCapital}_{it} $
 is the sum of net debt and equity issuance. Each variable is divided by total assets at the beginning of the period.
$ {X}_{it-1} $
 is a vector of control variables and
$ {f}_i $
 denotes firm fixed effects.
$ {\eta}_t $
 represents year fixed effects which control for the macroeconomic effects. Following Opler, Pinkowitz, Stulz, and Williamson (Reference Opler, Pinkowitz, Stulz and Williamson1999) and Bates et al. (Reference Bates, Kahle and Stulz2009), we include the following control variables:
$ M/{B}_{it-1} $
 , the market-to-book asset ratio that controls for investment opportunities;
$ {Cash}_{it-1} $
 , the lagged cash-to-asset ratio;
$ {Vol}_{it} $
 , cash flow volatility;
$ {Leverage}_{it-1} $
 , leverage ratio;Footnote
14
$ {Size}_{it-1} $
 , the logarithm of total assets;
$ {NWC}_{it} $
 , net working capital excluding cash and equivalents divided by total assets at
$ t-1 $
 ;
$ {CapEx}_{it} $
 , capital expenditures divided by total assets at
$ t-1 $
 ;
$ {Acquisitions}_{it} $
 , acquisitions divided by total assets at
$ t-1 $
 ; and
$ {Dividend}_{it} $
 , cash dividend divided by total assets at
$ t-1 $
 . We winsorize variables at the 2 and 98 percentiles to mitigate the effects of outliers.
We first estimate the model without firm and year fixed effects. As shown in Panel A of Table A1, column 1 in the Supplementary Material. the coefficient estimate of external capital (
$ ExCapital $
 ) is 0.4914 and significant, whereas that of internal cash flows (
$ ICF $
 ) is 0.3047 and significant. Column 5 shows that the standardized beta coefficient of external capital is much larger than that of internal cash flow (0.5564 vs 0.2774), indicating that external capital is a major source of firms’ cash saving. As equity and debt are the two main sources of external capital, we further investigate their relative importance for firms’ cash saving. Panel B of Table A1 in the Supplementary Material shows that the coefficient estimate of net equity issues (
$ EIssue $
 ) is 0.5666 and significant, with an adjusted
$ {R}^2 $
 of 10.43%. The coefficient estimate of debt issues (
$ DIssue $
 ) is 0.0879, and the adjusted
$ {R}^2 $
 is 0.44%.Footnote
15 The estimated coefficient of internal cash flows (
$ ICF $
 ) is 0.277 and statistically significant, with an adjusted
$ {R}^2 $
 of 4.81%.Footnote
16 Overall, external equity is the most important source of cash saving.
To test Hypothesis 1b, concerning the impact of the COC on firms’ cash savings from external capital, we include the COC and its interaction with external capital (
$ ExCapital $
 ) in equation (8). Table 2 reports the estimation results for the main variables of interests. For brevity, the coefficients of the control variables,
$ M/B $
 ,
$ Cash $
 ,
$ Vol $
 ,
$ Leverage $
 ,
$ Size $
 ,
$ NWC $
 ,
$ CapEx $
 ,
$ Acquisitions $
 , and
$ Dividend $
 , are not reported. The negative and significant coefficient estimates of the interaction term between the COC and external capital (
$ ExCapital\times COC $
 ) indicate that firms save significantly more from external capital when the COC is lower. We next examine the relative importance of the COE and COD for firms’ cash saving by including the interaction terms between the COE (COD) and net equity issuance proceeds (net debt issuance proceeds) in our regression model. As shown in Table 2 column 2, the coefficient estimate on
$ Eissue\times COE $
 is negative and significant, whereas the coefficient estimate on
$ Dissue\times COD $
 is insignificant. These results indicate that firms’ cash savings from external capital are more sensitive to COE than COD.

Table 2 Long description
The table consists of two columns of regression results.
Column 1 results:
* C O C: -0.0045 with standard error 0.0061.
* ExCapital: 0.5614*** with standard error 0.0236.
* ExCapital times C O C: -0.6280*** with standard error 0.1173.
* I C F: 0.3274*** with standard error 0.0220.
* Adjusted R-squared: 0.3374.
* Number of observations: 60,228.
Column 2 results:
* C O E: -0.0018 with standard error 0.0039.
* C O D: -0.2521*** with standard error 0.0275.
* Eissue: 0.8027*** with standard error 0.0305.
* Dissue: 0.3113*** with standard error 0.0171.
* Eissue times C O E: -0.5125*** with standard error 0.1425.
* Dissue times C O D: 0.0637 with standard error 0.1348.
* I C F: 0.3193*** with standard error 0.0215.
* Adjusted R-squared: 0.3052.
* Number of observations: 60,112.
Both models include Controls, Firm F E s, and Year F E s. Asterisks indicate significance levels: *** for 1 percent, ** for 5 percent, and * for 10 percent.
C. Financial Constraints
The precautionary motive suggests that financially constrained firms can avoid external financing by saving cash from internal cash flows (Almeida et al. (Reference Almeida, Campello and Weisbach2004) and Bates et al. (Reference Bates, Kahle and Stulz2009)). Acharya et al. (Reference Acharya, Almeida and Campello2007) suggest that financially constrained firms save cash to hedge against income shortfalls. Given the importance of financial constraints in firms’ cash saving decisions, we investigate whether financial constraints explain the sensitivity of cash saving to the COC. Our hypothesis is that both financially constrained and unconstrained firms save when the COC is low to hedge against a higher future COC (Hypothesis 1a). To test this prediction, we follow previous studies to use credit ratings and the HP index (Hadlock and Pierce (Reference Hadlock and Pierce2010)) to define financially constrained and unconstrained firms.Footnote 17 Financially constrained (unconstrained) firms are defined as firms without (with) credit ratings or firms in the top (bottom) 30% of the HP index.
The results presented in Table 3 show that the coefficients of
$ ExCapital $
 and
$ ICF $
 are positive and significant, indicating that both constrained and unconstrained firms save from external capital and internal cash flows. The estimated coefficients of
$ ExCapital\times COC $
 are negative and statistically as well as economically significant for both constrained and unconstrained firms. When
$ ExCapital\times COC $
 decreases by 1 standard deviation, the cash saving of financially unconstrained (constrained) firms based on the HP index increases by 8.73% (8.23%). These results are consistent with Hypothesis 1a and suggest that the time-varying COC is an important consideration for cash saving decisions of both constrained and unconstrained firms.

Table 3 Long description
The table is organized into four columns. Columns 1 and 2 categorize firms by Rating (Unconstrained and Constrained). Columns 3 and 4 categorize firms by H P Index (Unconstrained and Constrained).
Key variables and their coefficients (standard errors in brackets):
* C O C: Column 1 is -0.0298*; Column 2 is -0.0250**; Column 3 is -0.0304***; Column 4 is 0.0074.
* ExCapital: Column 1 is 0.4005***; Column 2 is 0.6402***; Column 3 is 0.6878***; Column 4 is 0.4166***.
* ExCapital times C O C: Column 1 is -0.6460***; Column 2 is -0.8851***; Column 3 is -0.8052***; Column 4 is -0.5292**.
* I C F: Column 1 is 0.2188***; Column 2 is 0.3565***; Column 3 is 0.3909***; Column 4 is 0.2746***.
All models include Controls, Firm F Es, and Year F Es (all marked Yes).
* Number of observations: Column 1 (16,749), Column 2 (31,007), Column 3 (27,991), Column 4 (28,016).
* Adjusted R super 2: Column 1 (0.3261), Column 2 (0.3457), Column 3 (0.3873), Column 4 (0.3204).
D. Hedging Motive
Next, we test the hedging motive hypothesis that firms with a high correlation between their COC and external financing needs (high hedging motive) have greater incentives to raise external capital and save cash at a relatively low COC. As noted in Figure 2, Graph B, firms with high hedging motives save more cash when their COC is lower relative to its historical mean, whereas such a downward-sloping relationship is much weaker for firms with low hedging motives. We formally test below the hedging motive Hypotheses 1b, 1c, and 1d.
1. Hedging Motive and Cash Saving
To test Hypothesis 1b, that firms with high hedging motives save more from external capital when the COC is relatively low, we examine whether the sensitivity of cash saving to the COC is more pronounced among these firms. We divide the sample into high and low hedging motive firms based on the hedging motive measure and report the results in Panel A of Table 4. The coefficient estimate of the interaction term between external finance and the COC (
$ ExCapital\times COC $
 ) is significant and negative only among high hedging motive firms, indicating that firms with greater hedging motives save more from external capital when the COC is relatively low.

Table 4 Long description
The table is divided into three sections: Panel A (Cash Saving), Panel B (Excess Issuance), and Panel C (Future Investment).
Panel A: Cash Saving
- C O C: 0.0030 [0.0076] for High Hedging; -0.0081 [0.0109] for Low Hedging.
- ExCapital: 0.6041*** [0.0318] for High Hedging; 0.4456*** [0.0435] for Low Hedging.
- ExCapital times C O C: -0.4848*** [0.1177] for High Hedging; -0.1664 [0.2478] for Low Hedging.
- I C F: 0.4082*** [0.0260] for High Hedging; 0.2969*** [0.0282] for Low Hedging.
- Adj. R super 2: 0.4392 for High Hedging; 0.3030 for Low Hedging.
Panel B: Excess Issuance
- C O C: -0.0731*** [0.0143] for High Hedging; -0.0129 [0.0139] for Low Hedging.
- Adj. R super 2: 0.2221 for High Hedging; 0.2219 for Low Hedging.
Panel C: Future Investment
- FInvestment: 0.1382*** [0.0270] for High Hedging; 0.0756*** [0.0269] for Low Hedging.
- FInvestment times C O C: -0.2553** [0.1284] for High Hedging; -0.1778 [0.1689] for Low Hedging.
- C O C: -0.0114 [0.0126] for High Hedging; -0.0190 [0.0149] for Low Hedging.
- Adj. R super 2: 0.2441 for High Hedging; 0.1672 for Low Hedging.
All panels include Controls, Firm F Es, and Year F Es (all marked ‘Yes’). Number of observations is 17,990 for High Hedging and 18,600 for Low Hedging across all panels.
2. Hedging Motive and Excess Capital Issuance
According to Hypothesis 1c, firms with greater hedging motives issue excess capital when the COC is relatively low. To test this prediction, we define excess capital issuance as net external capital issues minus financial deficit, which represents the portion of external capital saved as cash. We regress excess capital issuance on the COC while controlling for firm characteristics, firm fixed effects, and year fixed effects. As shown in Panel B of Table 4, the coefficient estimate of the COC is negative and significant only for firms with high hedging motives, which suggests that high hedging motive firms issue more external capital in excess of current financial needs when the COC is lower. The results are thus consistent with Hypothesis 1c.
3. Future Investments and Cash Savings
To test Hypothesis 1d, that firms with high hedging motives save cash from external capital to fund future investments, we estimate the following regression:

where
$ {FInvestment}_{it} $
 is the future investment at time
$ t $
 of firm
$ i $
 , defined as the average of investment scaled by lagged total assets in the subsequent 2 years.Footnote
18 The same set of control variables in equation (8) and ICF are included to control for the effects of other factors on cash saving. We estimate equation (9) separately for firms with high and low hedging motives. Since the incentive to save cash from external capital for future expected investment will be greater when facing a relatively low COC, we expect
$ {\alpha}_3 $
 to have a negative sign, especially for firms with high hedging motives. Table 4, Panel C reports the results for high and low hedging motive firms. The coefficient estimate of the interaction term between future investment and COC (
$ FInvestment\times COC $
 ) is negative and significant only for high hedging motive firms, which is consistent with Hypothesis 1d.
VI. Shocks to the COC
An endogeneity concern may arise if firms’ cash savings affect their COC or if other confounding factors drive the observed relationship. To ease this concern, we exploit two plausibly exogenous events that affect firms’ COC to examine whether high hedging motive firms’ cash savings from external capital are particularly sensitive to the COC.
A. Regulation Fair Disclosure (Reg FD)
In the first quasi-experiment, we use Reg FD as a shock to the COC and investigate whether firms experiencing a greater reduction in their COC during the post-Reg FD period save more from external capital than firms experiencing a smaller reduction in their COC. Reg FD, which was implemented on Oct. 23, 2000, prohibits the selective disclosure of material information to a subset of market participants, such as analysts and institutional investors, without simultaneously disclosing such information to the public. The Securities and Exchange Commission (SEC) believed that Reg FD would encourage investor participation in capital markets by curtailing the practice of selective information disclosure, thereby lowering the COC. The Reg FD-driven decline in the COC is exogenous to firm fundamentals (Chen et al. (Reference Chen, Dhaliwal and Xie2010)) and reflects variation in the COC arising from information-asymmetry frictions.
Previous studies suggest that the effects of selective disclosure before Reg FD are more pronounced for firms with a high market-to-book ratio, since these firms face greater growth opportunities, are more difficult to value, and more likely to disclose material information privately to selected investors (Gintschel and Markov (Reference Gintschel and Markov2004), Hutton (Reference Hutton2005)). Accordingly, we use the M/B ratio to classify firms into treatment and control groups. Specifically, treatment and control firms are defined as the top and bottom 30% ranked by the M/B ratio in 1999, respectively. As a robustness check, we also use R&D before the implementation of Reg FD as an alternative criterion to construct treatment and control groups, since previous studies show that firms with more R&D investments are more likely to engage in selective disclosure. These robustness results are reported in Table A3 in the Supplementary Material. We set the
$ Post $
 dummy to 1 for 2000–2003 and 0 for 1996–1999.
Arguably, Reg FD might have a permanent effect on reducing the COC by lowering the component driven by market frictions; in our framework, this corresponds to a shock to
$ {\delta}_t $
 while holding
$ {\rho}_t $
 fixed. This enables us to test Extension 1 of our model: a shock that decreases both current and future COCs increases firms’ cash savings, with a stronger effect for firms facing a greater wedge between
$ {\delta}_0 $
 and
$ {\rho}_0 $
 (i.e., greater market frictions). Thus, to the extent that firms with higher exposure to Reg FD are more likely to face greater market frictions, they should increase cash savings more in response to Reg FD. For firms with hedging motives, the decline in the COC strengthens the incentive to save cash today to hedge future investment needs.
We first verify whether treatment firms experience a greater decrease in their COC than control firms following Reg FD. Panel A of Table 5 reports the results. The coefficient estimates on
$ Treated\times Post $
 are negative and significant in all regressions, which confirms that treatment firms have a larger drop in the COE, COD, and COC after Reg FD. The COC of treatment firms following Reg FD is decreased by 1.96% lower than that of control firms, which is economically significant.

Table 5 Long description
Panel A, titled The Impact on the C O C, contains three columns: 1 C O E, 2 C O D, and 3 C O C. The primary variable Treated times Post shows negative and highly significant coefficients across all columns: minus 0.0289 for C O E, minus 0.0065 for C O D, and minus 0.0196 for C O C. Standard errors are provided in brackets below each coefficient. All models include Controls, Firm F E s, and Year F E s. The number of observations is 9,942 for columns 1 and 3, and 9,428 for column 2. Adjusted R super 2 values range from 0.4520 to 0.7062.
Panel B, titled The Impact on Cash Saving, contains three columns: 1 Reg F D, 2 Placebo 1, and 3 Placebo 2. The triple interaction term Treated times ExCapital times Post is the key variable, showing a positive and highly significant coefficient of 0.1181 in column 1, while the placebo tests in columns 2 and 3 are statistically insignificant at minus 0.0678 and 0.0504 respectively. Other variables include Treated times Post, ExCapital times Post, Treated times ExCapital, ExCapital, and I C F. All models include Controls, Firm F E s, and Year F E s. The number of observations varies from 7,716 to 9,942, with Adjusted R super 2 values between 0.4323 and 0.6452.
We next examine whether treatment firms save more from external capital than control firms in the post-Reg FD period as a consequence of reduced COC. Column 1 in Panel B of Table 5 shows that the coefficient estimate of the triple interaction term
$ Treated\times ExCapital\times Post $
 is positive and significant, indicating that cash savings from external capital increase significantly among treatment firms relative to control firms following Reg FD.Footnote
19 Cash savings from external capital by treatment firms after Reg FD are 11.81% higher than those of control firms.
To address the concern that the results may be influenced by confounding factors such as growth opportunities, we also conduct placebo tests based on fictitious event years of 1989 and 2007. We report results for these 2 fictitious years because they are immediately prior to a recession. This approach addresses the concern that the cash savings effect might be a consequence of the 2001 recession rather than the shock to the COC from Reg FD. The sample period includes the 8 years surrounding each fictitious event year. If other observed or unobserved factors drive the different sensitivities of cash saving to the COC between control and treatment firms, we should observe similar results in the absence of a shock to the COC. Columns 2 and 3 of Panel B report the results of the placebo tests, showing that the coefficient estimates on
$ Treated\times ExCapital\times Post $
 are insignificant, indicating that treatment firms do not save more from external capital when not experiencing a decrease in the COC. Thus, our results are unique to Reg FD and are unlikely to be driven by other confounding factors. These findings increase our confidence that the COC affects firms’ cash savings from external capital.
It is also possible that the above results simply capture pre-existing divergent trends or differences between treatment and control groups that are unrelated to the shock to the COC. To explore this possibility, we investigate the dynamics of firms’ cash savings from external capital surrounding the shock. If this alternative explanation holds true, we should observe more cash savings from external capital by the treatment firms prior to Reg FD. To test this possibility, we replace
$ Post $
 them with year indicator variables associated with the years surrounding Reg FD. Figure 4 presents the coefficient estimates of the triple interaction term
$ Treated\times ExCapital\times Year $
 with the 90% confidence interval. As shown in Graph A, the differences in the sensitivities of cash saving to external capital between the treatment and control groups were close to zero before Reg FD. However, treatment firms’ cash savings from external capital become significantly higher than that of control firms after Reg FD. We also plot the differences in the sensitivities of cash savings to external capital between the treatment and control groups surrounding the fictitious event years of 1989 and 2007 in the middle and bottom figures, but we do not observe similar effects.
Figure 4 plots the differences in the sensitivities of cash saving to external capital around the adoption of Reg FD in 2000 between the treated and control firms (Graph A) and the differences around the fictitious event years 1989 and 2007 (Graphs B and C). The treatment control firms are classified based on the top and bottom 30% of the M/B ratio in 1999 (Graph A), 1988 (Graph B), and 2006 (Graph C), respectively.

Figure 4 Long description
A multi-panel figure with three graphs, each sharing a y-axis labeled Coefficients of Treated x ExCapital x Year ranging from negative 0.4 to 0.4 and an x-axis labeled Year.
Graph A, titled Actual Reg F D Event Study (2000 Adoption), shows data from 1997 to 2003. Points for 1997, 1998, and 1999 are near zero with vertical error bars crossing the dashed zero line. In 2000 and 2001, the coefficients jump to approximately 0.22 and 0.24 respectively, with error bars entirely above zero. In 2002 and 2003, the points return toward zero.
Graph B, titled Placebo Event Study (1989 Fictitious Event), shows data from 1986 to 1992. All data points are below the zero line, ranging between negative 0.1 and negative 0.3, with large error bars that overlap the zero line in most cases.
Graph C, titled Placebo Event Study (2007 Fictitious Event), shows data from 2004 to 2010. All data points are clustered very close to the zero line, with error bars consistently crossing the dashed zero line throughout the period.
We now test the Hypotheses 1b, 1c, and 1d in the setting of Reg FD by dividing the Reg FD sample into high and low hedging motive firms based on the hedging motive measure. As shown in Table 6, Panel A, the coefficient estimate on
$ Treated\times ExCapital\times Post $
 is significant only for firms with high hedging motives, indicating that firms with high hedging motives that experience a larger decline in the COC after Reg FD save more from external capital than control firms. These results provide support for hypothesis 1b that firms with high hedging motives save more when the COC is relatively low.

Table 6 Long description
The table is divided into three panels: Panel A (Cash Saving), Panel B (Excess Issuance), and Panel C (Future Investment). Each panel compares Column 1 (High Hedging Motive) and Column 2 (Low Hedging Motive).
* Panel A: Cash Saving
- Treated times Post: 0.0058 [0.0049] for High; 0.0113 [0.0086] for Low.
- ExCapital times Post: 0.0313 [0.0628] for High; -0.0363 [0.0608] for Low.
- Treated times ExCapital times Post: 0.1354* [0.0758] for High; 0.0866 [0.0849] for Low.
- Treated times ExCapital: 0.1098*** [0.0370] for High; 0.1589*** [0.0590] for Low.
- ExCapital: 0.2683*** [0.0276] for High; 0.2499*** [0.0406] for Low.
- I C F: 0.3056*** [0.0509] for High; 0.2971*** [0.0382] for Low.
- Number of observations: 3,318 for High; 3,312 for Low.
- Adjusted R-squared: 0.5171 for High; 0.4033 for Low.
* Panel B: Excess Issuance
- Treated times Post: 0.0356*** [0.0083] for High; 0.0289 [0.0186] for Low.
- Number of observations: 3,318 for High; 3,312 for Low.
- Adjusted R-squared: 0.5171 for High; 0.4033 for Low.
* Panel C: Future Investment
- FInvestment: 0.0426 [0.0372] for High; -0.0067 [0.0369] for Low.
- FInvestment times Post: -0.0376 [0.0532] for High; -0.0629* [0.0377] for Low.
- Treated times Post times FInvestment: 0.1145* [0.0656] for High; 0.0550 [0.0765] for Low.
- Treated times Post: -0.0117 [0.0107] for High; 0.0182 [0.0160] for Low.
- Treated times FInvestment: -0.0741 [0.0625] for High; 0.1604** [0.0737] for Low.
- Number of observations: 3,318 for High; 3,312 for Low.
- Adjusted R-squared: 0.5171 for High; 0.4033 for Low.
All panels include Controls, Firm F E s, and Year F E s (all marked Yes). Standard errors are in brackets. Asterisks indicate significance levels: *** for 1 percent, ** for 5 percent, and * for 10 percent.
We also use the Reg FD sample to test whether treated firms with a high hedging motive issue more excess capital than firms with a low hedging motive after Reg FD. In Panel B of Table 6, the results show that the coefficient estimate on
$ Treated\times Post $
 is significant only for firms with high hedging motives. These results are consistent with Hypothesis 1c that firms with high hedging motives issue excess external capital to save when the COC is lower.
Finally, we test whether future investment affects firms’ current cash savings for firms with high hedging motives. As shown in Table 6, Panel C, the coefficient on
$ Treated\times Post\times FInvestment $
 is positive and significant only for firms with high hedging motives. These results are consistent with Hypothesis 1d that future investment affects high hedging motive firms’ incentives to save more from external capital when the COC is lower.
B. Monetary Policy Shocks
Previous studies show that monetary policy shocks affect the COC by influencing equity premia, term premia, and credit spreads (Bernanke and Kuttner (Reference Bernanke and Kuttner2005), Savor and Wilson (Reference Savor and Wilson2013), Gertler and Karadi (Reference Gertler and Karadi2015), Hanson and Stein (Reference Hanson and Stein2015), Lucca and Moench (Reference Lucca and Moench2015)). A more positive monetary policy shock reflects a tighter monetary policy, which should raise the overall financing costs. Using monetary policy shocks as exogenous shocks to the firm-level COC, we examine how these shocks affect cash savings from external capital across firms with different MPEs. Extension 2 of our model shows that a monetary policy shock that increases both
$ {\delta}_0 $
 and
$ {\rho}_0 $
 will have negative effects on investment, cash saving, and external finance.
We employ the methodology developed by Bu et al. (Reference Bu, Rogers and Wu2021), which applies Fama and MacBeth (Reference Fama and MacBeth1973) two-step regressions to estimate unobservable monetary policy shocks.Footnote 20 In the first step, time-series regressions are run to estimate the sensitivities (betas) of 1- to 30-year interest rate changes to Federal Open Market Committee (FOMC) announcements. In the second step, a cross-sectional regression of interest rate changes across different maturities against the corresponding estimated betas obtained from the first step is estimated for each year to recover the aligned monetary policy shock. The series of estimated coefficients obtained from the second-step regression represents the monetary policy shock series. As demonstrated in Bu et al. (Reference Bu, Rogers and Wu2021), this monetary policy shock series is not only largely unpredictable based on the available economic information, but also contains no significant central bank information effect.
The literature suggests that the impacts of monetary policy shocks on firms’ COC depend on firms’ exposure to monetary policy, which goes beyond simple adjustments to the risk-free rate (Ippolito, Ozdagli, and Perez-Orive (Reference Ippolito, Ozdagli and Perez-Orive2018), Ozdagli and Velikov (Reference Ozdagli and Velikov2020)). Firms with different characteristics react differently to monetary policy. To capture this, Ozdagli and Velikov (Reference Ozdagli and Velikov2020) develop an MPE index based on observable firm characteristics that previous studies link to the monetary policy. These firm characteristics capture the effects of various monetary policy transmission mechanisms documented in the literature, including the credit channel, balance sheet liquidity, the discount rate effect, and nominal rigidities. They show that this MPE index captures the multidimensional nature of the cross-sectional variation in policy sensitivity and outperforms other methods of estimating MPE. Following their study, we construct the MPE index as follows:

where WW is the WW index. Cash, CF Duration, CF Volatility, and Operating Profitability capture a firm’s liquid assets, expected duration of cash flows, cash flow volatility, and profitability, respectively. The detailed variable definitions are provided in the Supplementary Material. We define Treated as a dummy variable that equals 1 (0) if a firm has an MPE index in the top (bottom) tercile.
We first investigate whether monetary policy shocks have differential effects on the external financing costs of treated firms than on those of control firms. Panel A of Table 7 shows that the coefficient estimates on
$ Treated\times Shock $
 are positive and significant for COE, COD, and COC, indicating that firms with more exposure to contractionary monetary policy shocks experience a greater increase in their external financing costs relative to those with less exposure. We then examine how firms’ financing decisions are affected. Panel B of Table 7 shows that the coefficients on
$ Treated\times Shock $
 are negative and significant for external capital issuance, equity issuance, and debt issuance. The results indicate that firms with greater exposure to contractionary monetary policy shocks issue less external capital, both equity and debt, than firms with less exposure.

Table 7 Long description
The table is divided into three panels.
Panel A, titled The Impact on the C O C, has three columns: 1 C O E, 2 C O D, and 3 C O C. The interaction term Treated times Shock shows positive and significant coefficients: 0.0027 for C O E, 0.0009 for C O D, and 0.0028 for C O C, all significant at the 1 percent level. Standard errors are in brackets below each coefficient. Controls, Firm F E s, and Year F E s are included for all columns. Adjusted R-squared values range from 0.5937 to 0.8651.
Panel B, titled Equity versus Debt Issuance, has three columns: 1 External Capital, 2 Equity Issuance, and 3 Debt Issuance. The interaction term Treated times Shock shows negative and significant coefficients: minus 0.0148 for External Capital, minus 0.0033 for Equity Issuance, and minus 0.0097 for Debt Issuance, all significant at the 1 percent level. Adjusted R-squared values range from 0.3378 to 0.3899.
Panel C, titled The Impact on Cash Saving, has three columns: 1 Monetary Policy Shockrises, 2 Placebo 1, and 3 Placebo 2. Key interaction terms include Treated times ExCapital times Shock, which is minus 0.0954 and significant at the 5 percent level in column 1, but insignificant in the placebo columns. The term Treated times Shock is 0.0054 and significant at the 5 percent level in column 1. Adjusted R-squared values are approximately 0.297 for all columns. All panels report 27,247 observations except for C O D in Panel A which has 27,165.
To examine the impacts of monetary policy shocks on firms’ cash savings from external capital, we estimate the following regression model:

where
$ Shock $
 is a dummy variable that equals 1 if the average monetary policy shock over a year is above the mean, and 0 otherwise;
$ {X}_{it-1} $
 contains a set of control variables as defined previously; and
$ {f}_i $
 and
$ {\eta}_t $
 are firm and year fixed effects, respectively.
The estimation results are reported in Panel C of Table 7. In column 1, the variable of interest is
$ Treated\times ExCapital\times Shock $
 . The negative and significant coefficient estimate suggests that contractionary monetary policy shocks, which increase the COC, lead to less cash saving from external capital by firms with greater exposure to monetary policy shocks relative to firms with less exposure.
A potential concern is that these results might be influenced by other differences between firms with high and low exposures to monetary policy shocks. To ease this concern, we conduct falsification tests to verify whether our results remain the same in the absence of a shock to the COC. If the observed effects stem from other confounding factors, then we should observe similar results even without monetary policy shocks. Columns 2 and 3 of Panel C report the results of placebo tests based on randomly generated monetary policy shocks from the standard normal distribution. The coefficients
$ Treated\times ExCapital\times Shock $
 are insignificant, indicating that there is no significant difference in cash saving from external capital between firms with more and less exposures when there are no shocks to the COC. Thus, the treatment effects are attributable to the effects of monetary policy shocks on the COC.
In Table 8, we conduct tests for the effects of monetary policy shocks on cash saving, excess external capital issuance, and cash saving for future investment, conditional on hedging motives. In Panel A for cash saving, the coefficient estimate on
$ Treated\times ExCapital\times Shock $
 is negative and significant only for high hedging motive firms, suggesting that more contractionary monetary policy, which increases the COC, induces high hedging motive firms to reduce cash saving. However, we do not find similar effects for firms with low hedging motives, as evidenced by the insignificant coefficient estimate on
$ Treated\times ExCapital\times Shock $
 . In Panel B for excess capital issuance, the coefficient estimate on
$ Treated\times Shock $
 is negative and significant only for high hedging motive firms, suggesting that higher hedging motive firms reduce excess external capital issuance when facing tighter monetary policy. Thus, our results suggest that high hedging motive firms save less from external capital in response to unexpected increases in the COC stemming from monetary policy shocks. The cash saving for future investment results are reported in Panel C. The coefficient estimates on
$ Treated\times Shock\times Finvestment $
 is negative and significant only for high hedging motive firms, which is consistent with the view that future investment affects high hedging motive firms’ incentives to save cash from external capital in response to shocks to the COC.

Table 8 Long description
The table is divided into three sections: Panel A (Cash Saving), Panel B (Excess Issuance), and Panel C (Future Investment). Each panel compares Column 1 (High Hedging Motive) and Column 2 (Low Hedging Motive).
Panel A: Cash Saving
* Treated: 0.0501 (High) and 0.0385 (Low).
* Treated times ExCapital times Shock: -0.1535 (High, significant at 5 percent) and -0.0716 (Low).
* ExCapital: 0.4767 (High) and 0.2803 (Low), both significant at 1 percent.
* I C F: 0.4084 (High) and 0.2916 (Low), both significant at 1 percent.
* Adjusted R-squared: 0.3624 (High) and 0.2626 (Low).
Panel B: Excess Issuance
* Treated: 0.0718 (High) and 0.0522 (Low), both significant at 1 percent.
* Treated times Shock: -0.0124 (High, significant at 1 percent) and -0.006 (Low).
* Adjusted R-squared: 0.3624 (High) and 0.2626 (Low).
Panel C: Future Investment
* Treated: 0.0729 (High, significant at 5 percent) and 0.0467 (Low, significant at 1 percent).
* Treated times Shock times FInvestment: -0.1828 (High, significant at 5 percent) and -0.0324 (Low).
* FInvestment: 0.1139 (High, significant at 5 percent) and 0.0313 (Low).
* Adjusted R-squared: 0.3624 (High) and 0.2626 (Low).
All panels include controls for Firm F E s and Year F E s. The number of observations is 8,842 for High Hedging Motive and 8,041 for Low Hedging Motive.
C. Robustness
Although we show that the COC has a significant impact on cash savings from external capital in the quasi-natural experiment settings, an endogeneity concern may still exist due to measurement errors in the COC. As a remedy for measurement errors in the COC, we estimate the model using high-order cumulants as suggested by Erickson, Jiang, and Whited (Reference Erickson, Jiang and Whited2014). Table A2 in the Supplementary Material reports the estimation results. The coefficient estimates of the interaction between external capital and the COC in Panel A are negative and significant for high hedging motive firms but insignificant for lower hedging motive firms (columns 1 and 2). These results are consistent with those reported in previous tables.
McKeon (Reference McKeon2015) shows that external equity issuance can be driven by employees’ exercise of stock options, which is unlikely to reveal managers’ motives to raise external capital. To control for the effects of such employee-initiated issuances, we restrict our sample to firms that raise external capital at least 3% or 5% of total assets. Since the results are similar when using these two thresholds, we report the estimation results using 3% as the threshold. Columns 3 and 4 in Panel A of Table A2 in the Supplementary Material show that the coefficient estimates remain negative and significant for high hedging motive firms and insignificant for low hedging motive firms, indicating that our results are not driven by employee-initiated equity issuance.
We also examine whether our results are robust to alternative measures of the COC by using the Claus and Thomas (Reference Claus and Thomas2001) and Li et al. (Reference Li, Ng and Swaminathan2013) approaches as specified in the Supplementary Material. There may still be concerns that these models rely on analyst forecasts for future earnings that are not available for all firms and that analyst forecasts may be biased. To mitigate these concerns, we adopt an alternative approach to forecast future earnings without relying on analyst forecasts. Li and Mohanram (Reference Li and Mohanram2014) propose the use of two cross-sectional models to estimate future earnings: the earning persistence (EP) and residual income (RI) models. They show that the RI model outperforms the cross-sectional model developed by Hou, Van Dijk, and Zhang (Reference Hou, Van Dijk and Zhang2012) and EP models in forecasting future EPS. Therefore, we use the Li and Mohanram (Reference Li and Mohanram2014) RI model approach to forecast future EPS and estimate the implied COE using the Gebhardt et al. (Reference Gebhardt, Lee and Swaminathan2001) model. The results shown in Panel B of Table A2 in the Supplementary Material demonstrate that our findings are robust to these alternative COC measures.
Additionally, we investigate the robustness of our results to different time periods. To this end, we partition our sample into two subperiods: 1981–2000 and 2001–2020 and perform the tests. We observe that about 60% of high (low) hedging motive firms in the first subperiod remain high (low) hedging motive firms in the second subperiod. As shown in Panel C of Table A2 in the Supplementary Material, the coefficients
$ ExCapital\times COC $
 remain significant and negative for firms with high hedging motives, but are insignificant for firms with low hedging motives. These results indicate that our main findings are not specific to a particular sample period.
To further check the robustness of our results, we construct two additional hedging motive measures. For the first alternative hedging motive measure (Hedging Motive 1), we measure external finance following Rajan and Zingales (Reference Rajan and Zingales1998) as
$ External=\left( CapEx- OCF\right)/ CapEx $
 , where
$ CapEx $
 is capital expenditures; and
$ OCF $
 is the operating income before depreciation and amortization. The industry median
$ External $
 based on the 2-digit SIC code is used as the proxy for external capital needs. To construct the second alternative hedging motive measure (Hedging Motive 2), we follow Baker et al. (Reference Baker, Stein and Wurgler2003) and use the revised KZ index to measure external finance dependence as follows:
$ KZ=-1.002 CF-39.368 DIV-1.315 CASH+3.139 LEV $
 , where
$ CF $
 is the operating cash flow before depreciation and amortization divided by net property, plant and equipment at the beginning of the period (PPE);
$ DIV $
 is cash dividend divided by PPE;
$ CASH $
 is cash and equivalents divided by PPE; and
$ LEV $
 is long-term debt divided by long-term debt plus total equity. To measure hedging motive, we obtain annual external capital needs and compute their regression coefficients on individual firms’ COC over the sample period. Panel D of Table A2 in the Supplementary Material shows that the coefficient estimates on
$ ExCapital\times COC $
 remain significant and negative for firms with high hedging motives, but insignificant for firms with low hedging motives. Thus, our results are robust to alternative hedging motive measures.
In the Reg FD setting, we also use R&D as an alternative criterion to construct treatment and control groups and further examine whether the results based on this criterion still hold. Table A3 in the Supplementary Material shows that our results remain similar with this alternative criterion (columns 1 and 2). Previous studies posit that an increasing number of firms in high-tech industries with significant intangible assets and negative cash flows have driven an increase in average cash holdings (Graham and Leary (Reference Graham and Leary2018), Begenau and Palazzo (Reference Begenau and Palazzo2021), and Denis and McKeon (Reference Denis and McKeon2021)). As a robustness check, we examine whether our results are driven by firms in high-tech industries. We show that our results still hold after excluding firms in high-tech industries from the full sample (columns 5 and 6 in Panel A of Table A2 in the Supplementary Material) and from the Reg FD sample (columns 3 and 4 of Table A3 in the Supplementary Material).
Finally, we discuss alternative theories potentially explaining the sensitivity of cash saving to the COC in Section C of the Supplementary Material. The results in Table A4 in the Supplementary Material indicate that the sensitivity of cash saving to the time-varying COC cannot be fully explained by alternative theories such as the Acharya et al. (Reference Acharya, Almeida and Campello2007) hedging perspective (Panel A), the market timing motive (Panel B), the precautionary motive (Panel C), or the joint market timing and precautionary motives (Bolton et al. (Reference Bolton, Chen and Wang2013)) (Panels D and E). These results suggest that our findings cannot be explained by simply intersecting the market timing and precautionary motives. Moreover, the sensitivity of cash saving to the COC is particularly pronounced for high hedging motive firms regardless of credit risk (Panel F) and agency risk (Panel G).
VII. Discussions and Conclusions
We hypothesize that in the presence of a friction-induced wedge between the internal discount rate and the time-varying COC, firms channel funds into future states with a high COC by saving cash from external capital when the current COC is relatively low. Such intertemporal smoothing of the COC matters because a higher future COC could impose financial constraints, even if firms face no immediate constraints. When a firm expects a higher COC for future investments, it will increase cash savings from external capital at a low cost to lower the overall COC. The time-varying COC induces firms to hedge future investments against higher COC. Accordingly, cash savings and excess external financing should show a greater sensitivity to the COC for firms with greater hedging needs.
Consistent with these hypotheses, we find that both financially constrained and (presently) unconstrained firms save more cash from external capital when the COC is relatively low. The cash savings of firms with greater hedging needs are particularly sensitive to the COC. Firms with greater hedging needs tend to issue excess external capital to save when the COC is relatively low. Firms expecting greater future investment and having greater hedging needs save more when they face a lower COC. Moreover, the impact of the COE on firms’ cash savings from equity issuance is stronger than the impact of the COD on cash savings from debt issuance. Finally, the sensitivity of cash saving to the COC cannot be fully explained by other alternative motives.
In summary, our study illustrates that firms’ hedging motive to transfer funds from a low COC state to a higher COC state through cash saving is an important consideration for corporate cash saving policies. Previous studies show that credit lines also play an important role in firms’ liquidity and risk management (Sufi (Reference Sufi2009) and Acharya, Almeida, Ippollito, and Perez (Reference Acharya, Almeida, Ippollito and Perez2014)). How the time-varying COC affects firms’ choice between cash and credit lines is an interesting issue. Extending our study to answer this question seems a fruitful area for future research.
Supplementary Material
To view supplementary material for this article, please visit http://doi.org/10.1017/S0022109026102877.


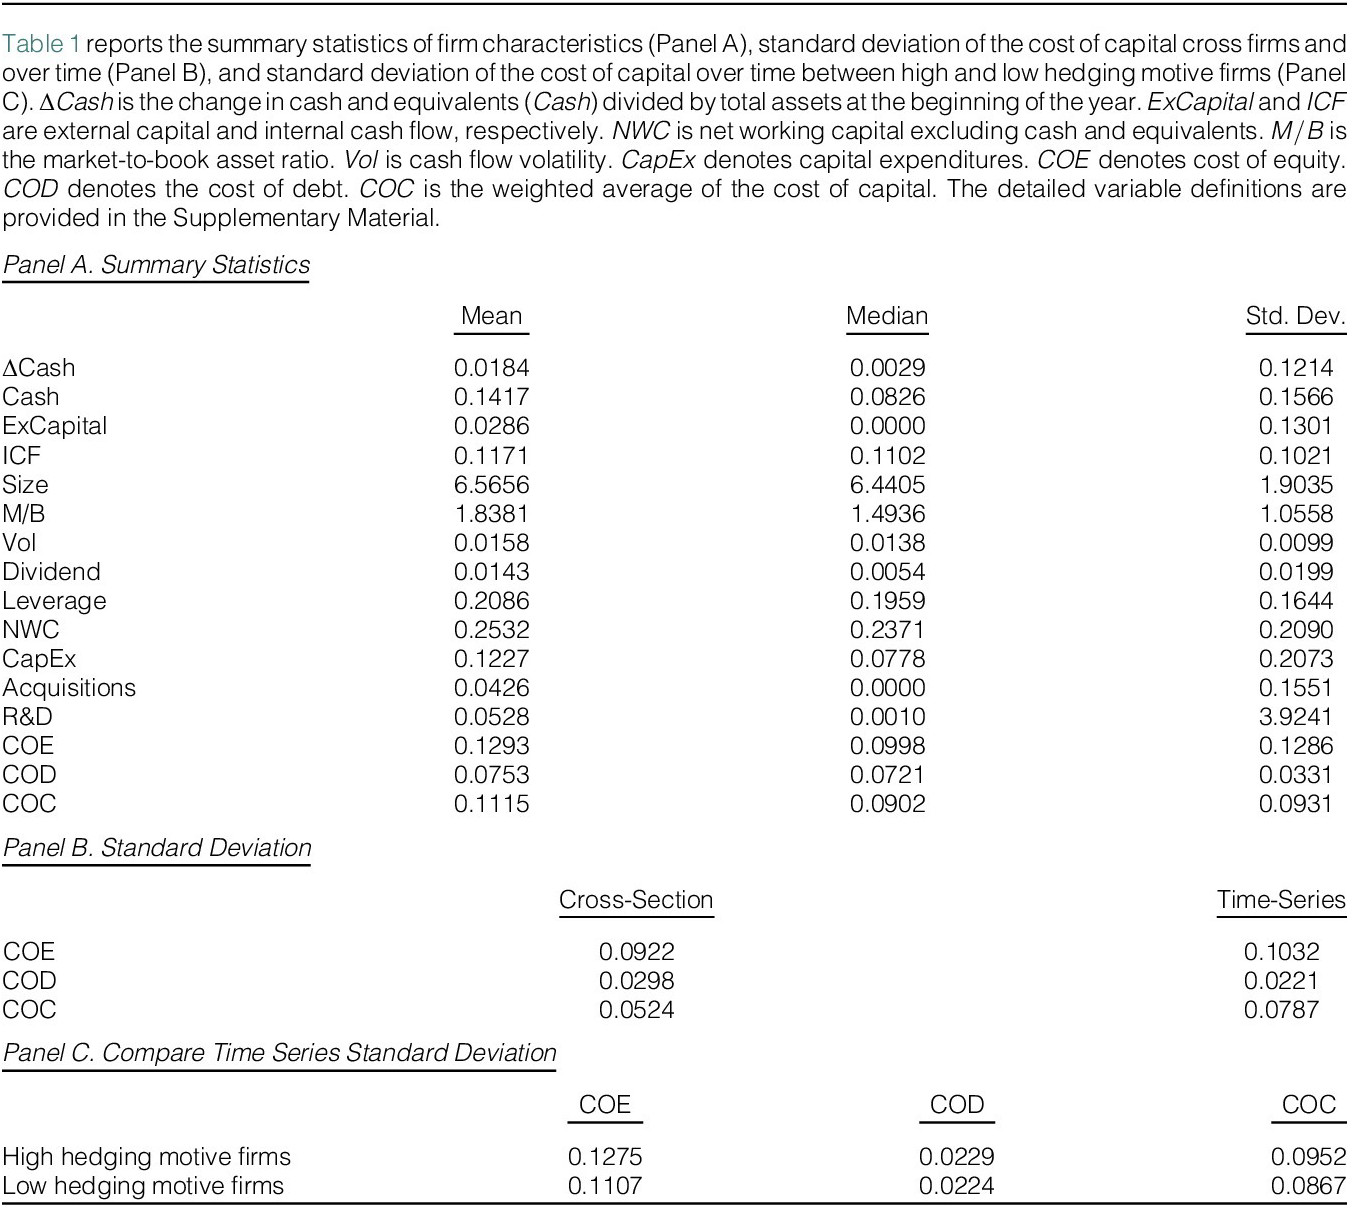
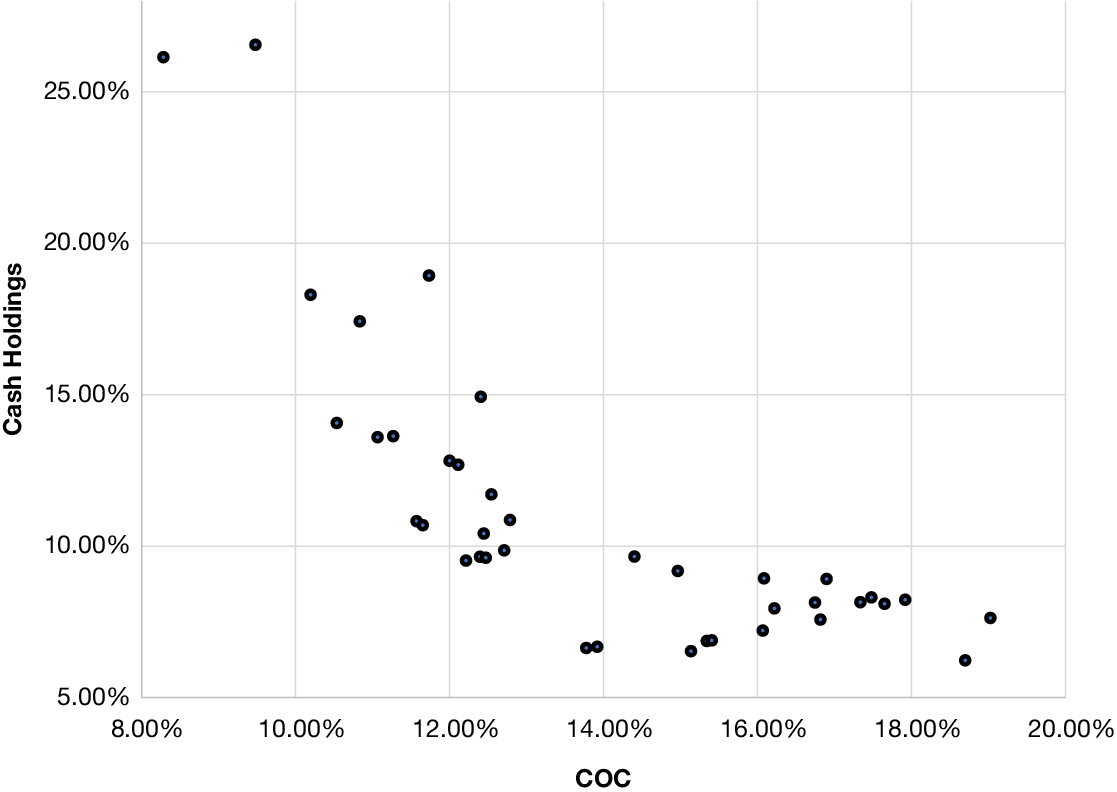
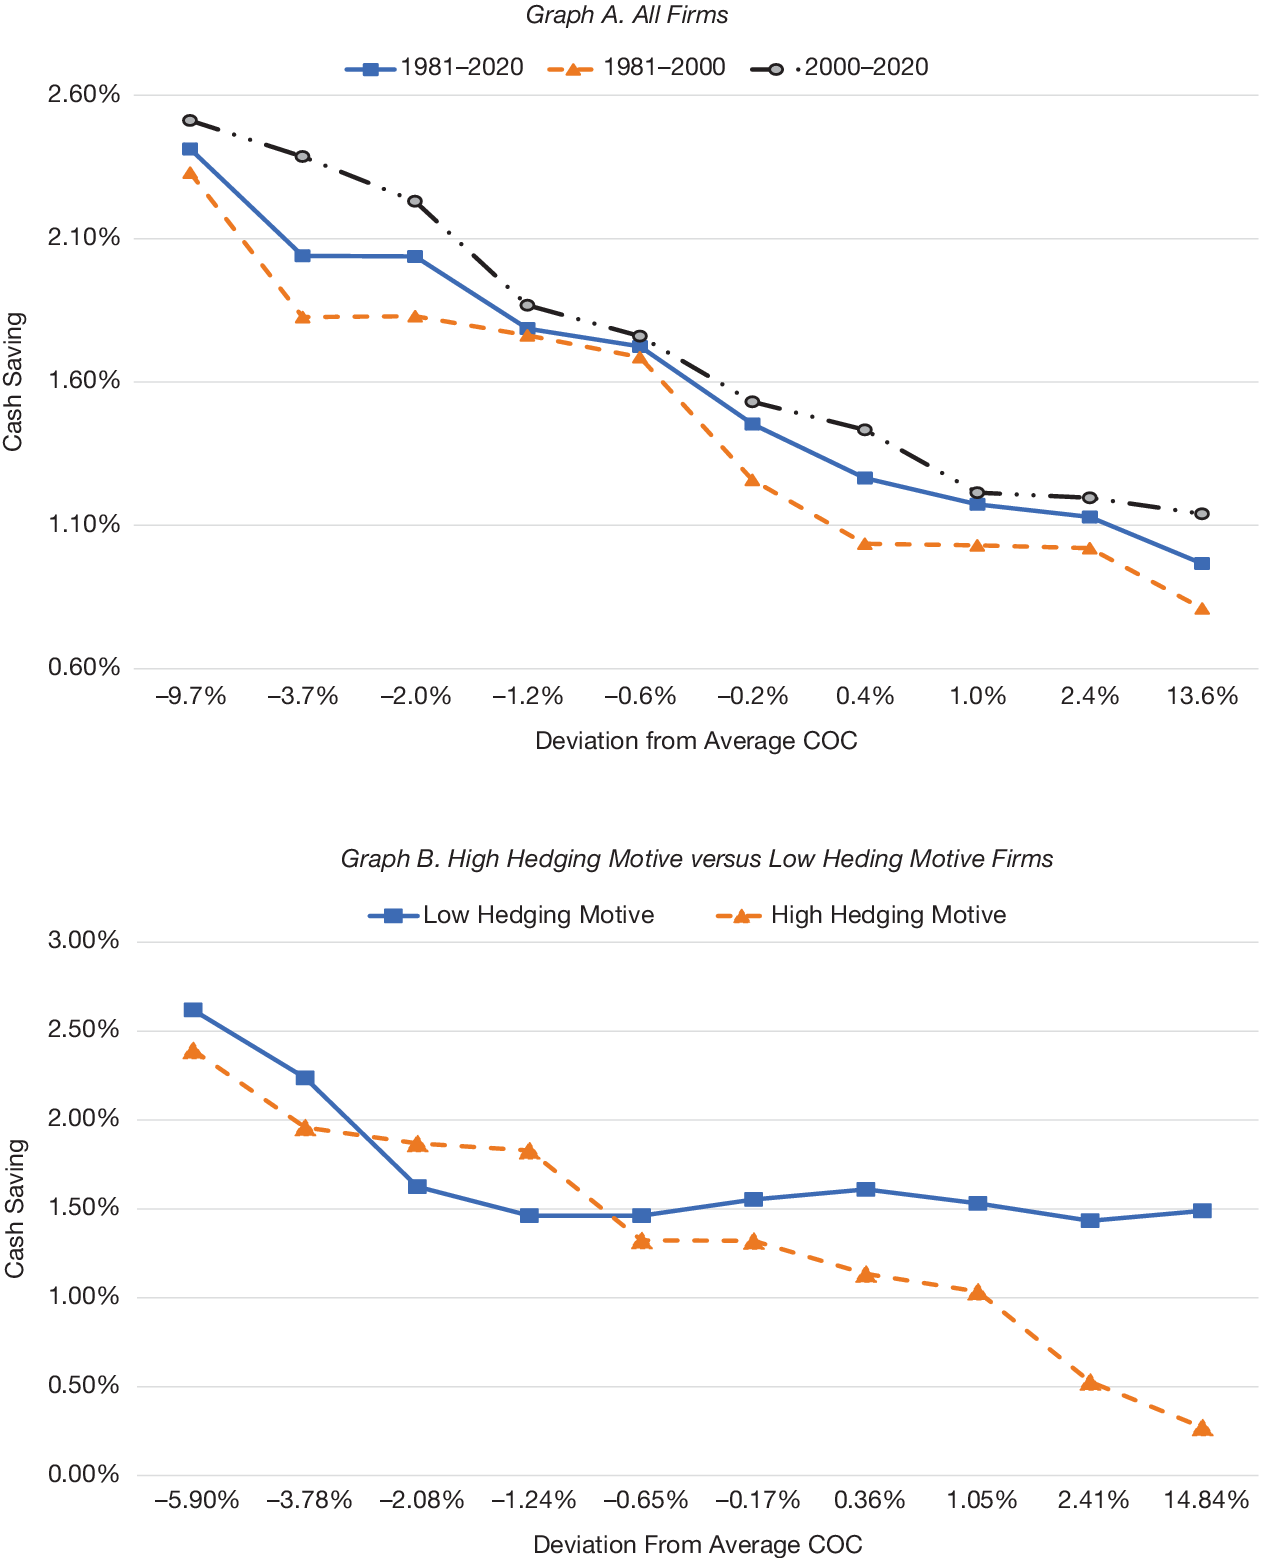
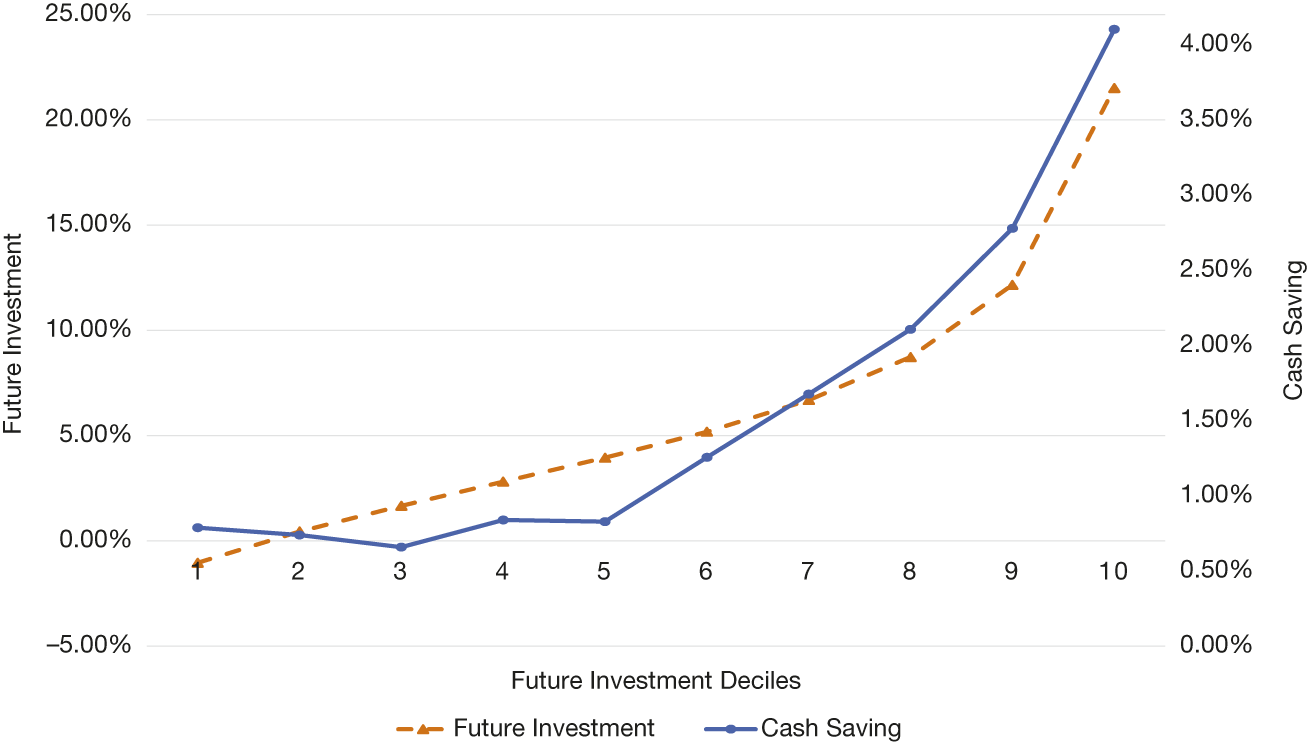
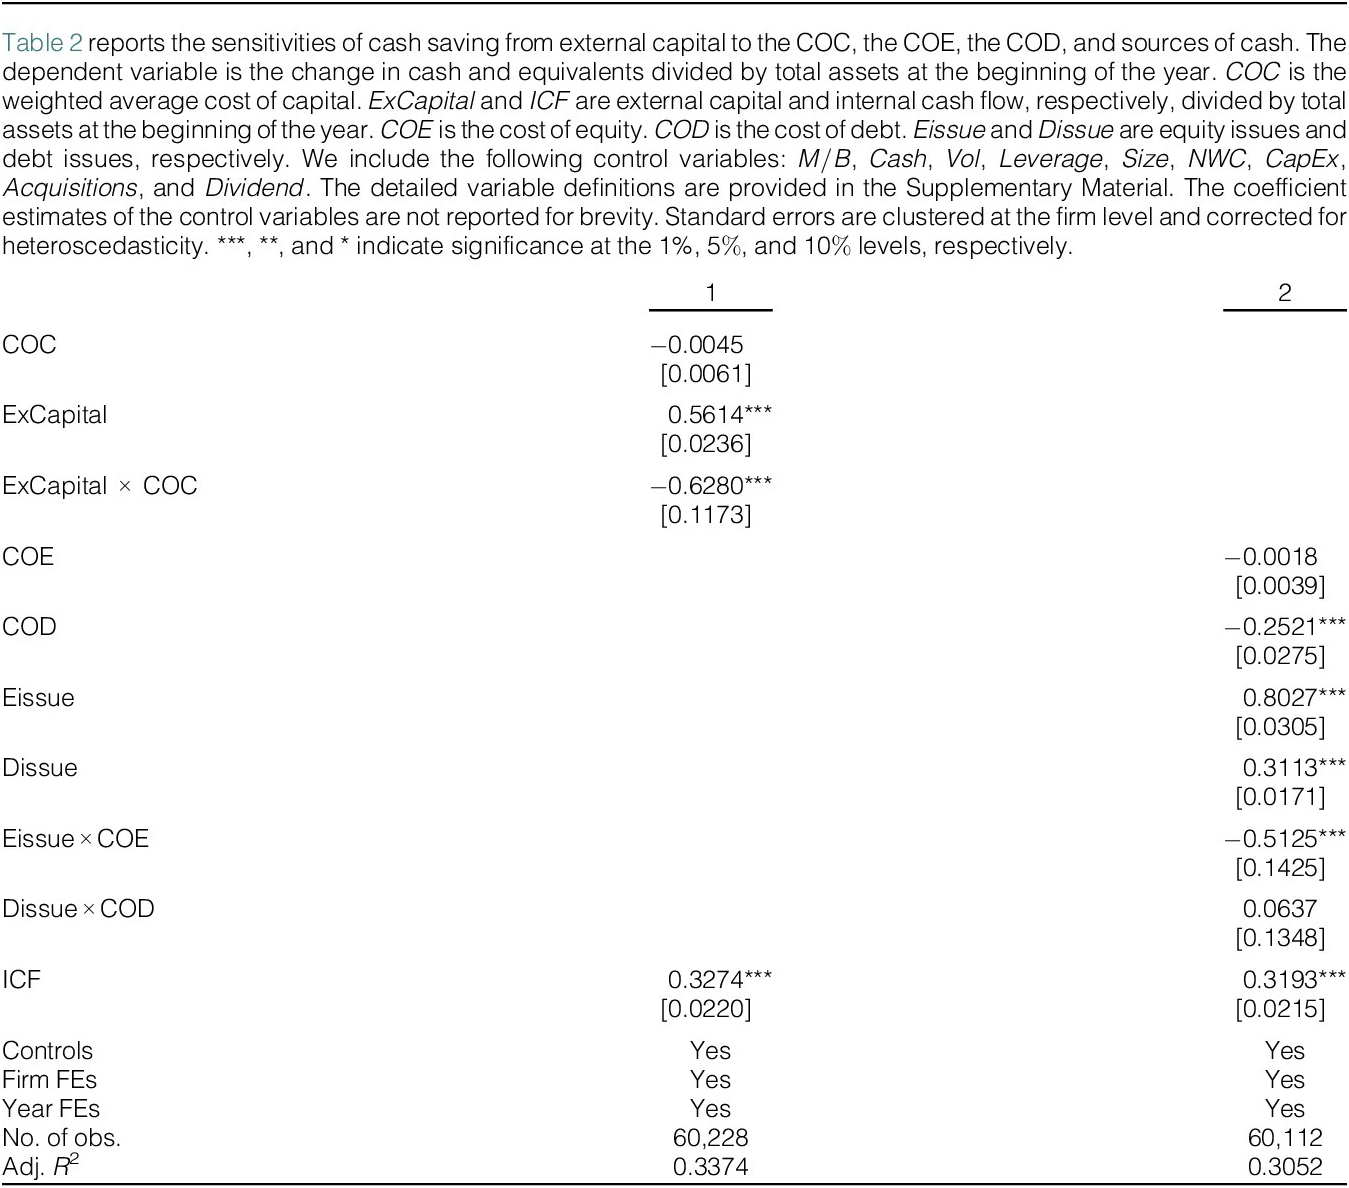
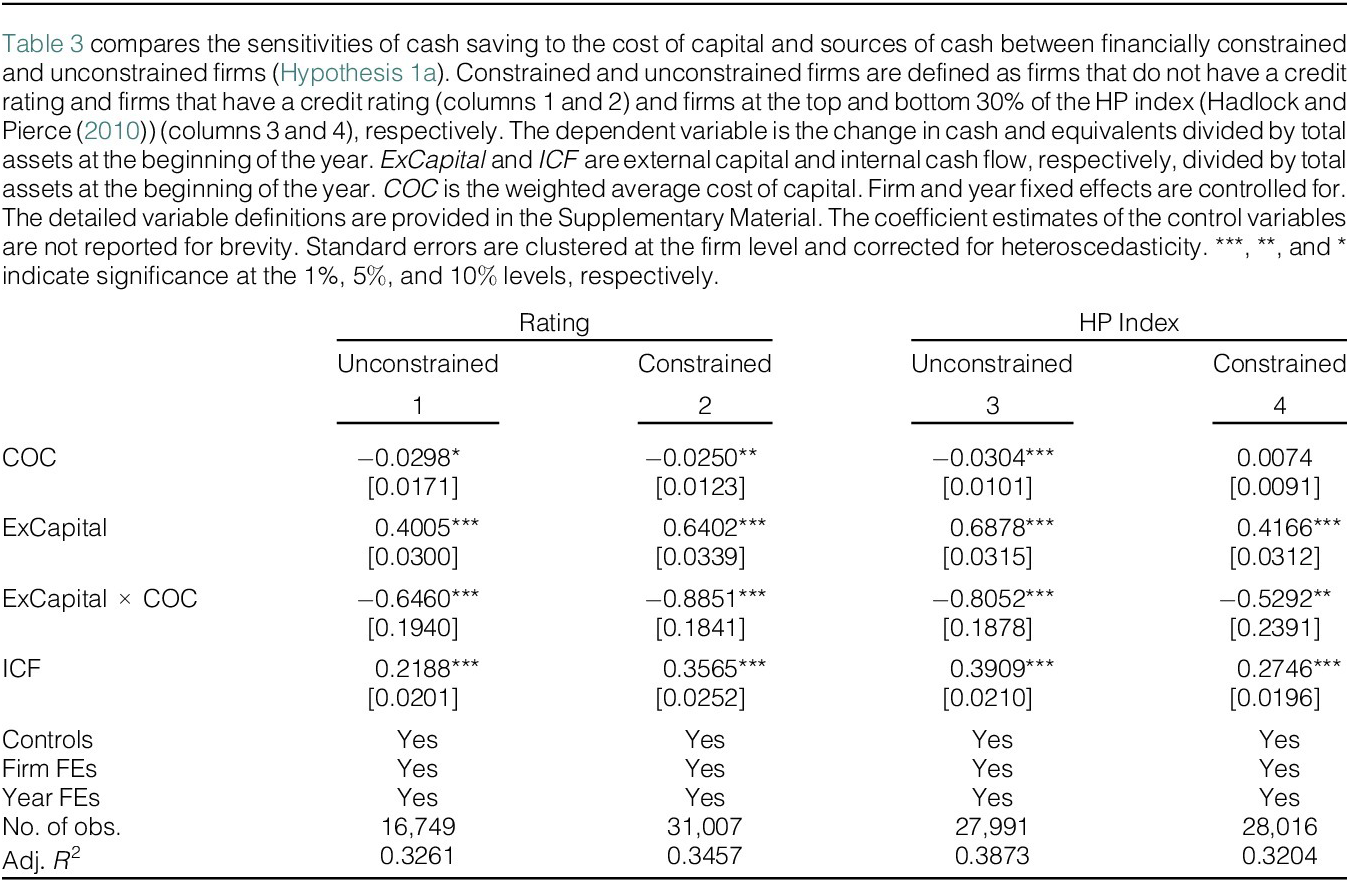
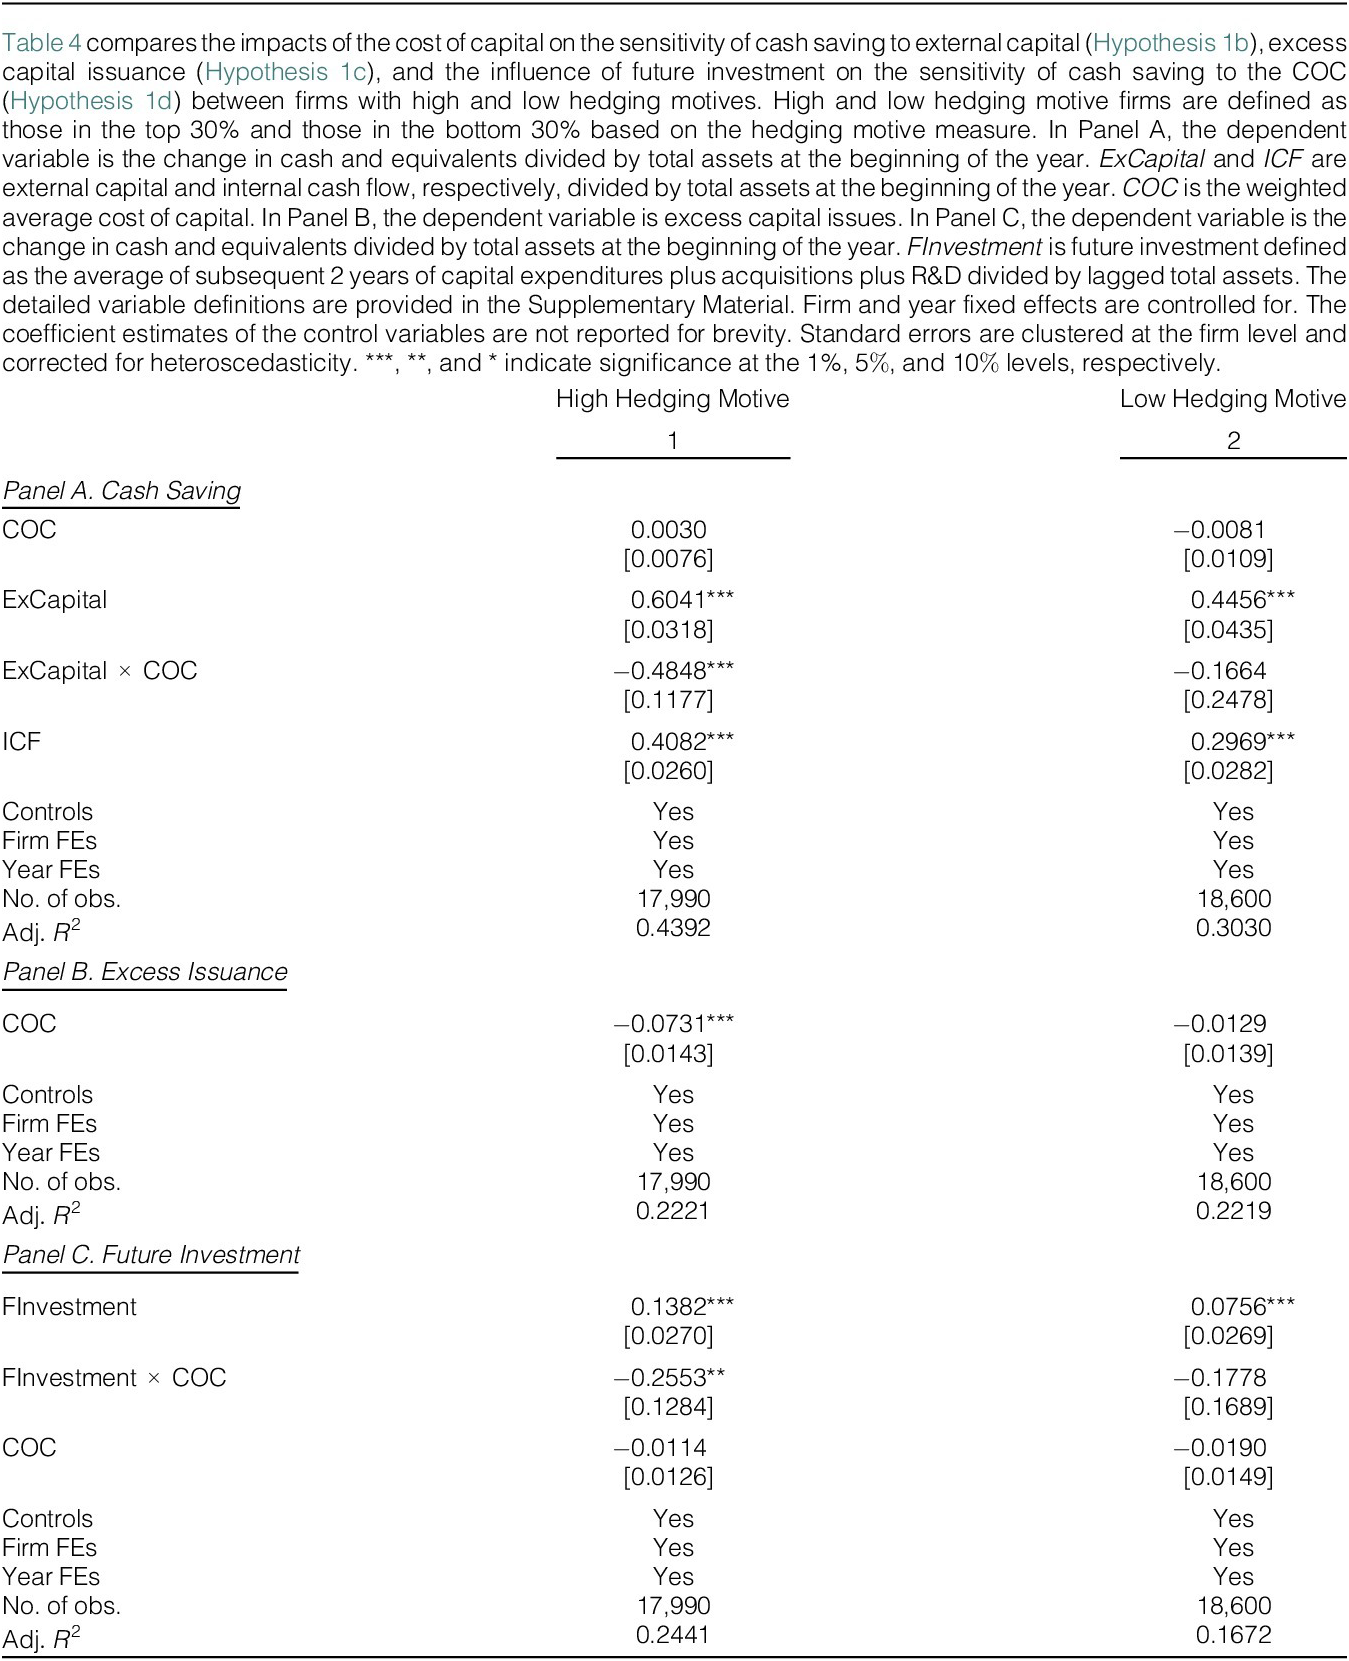
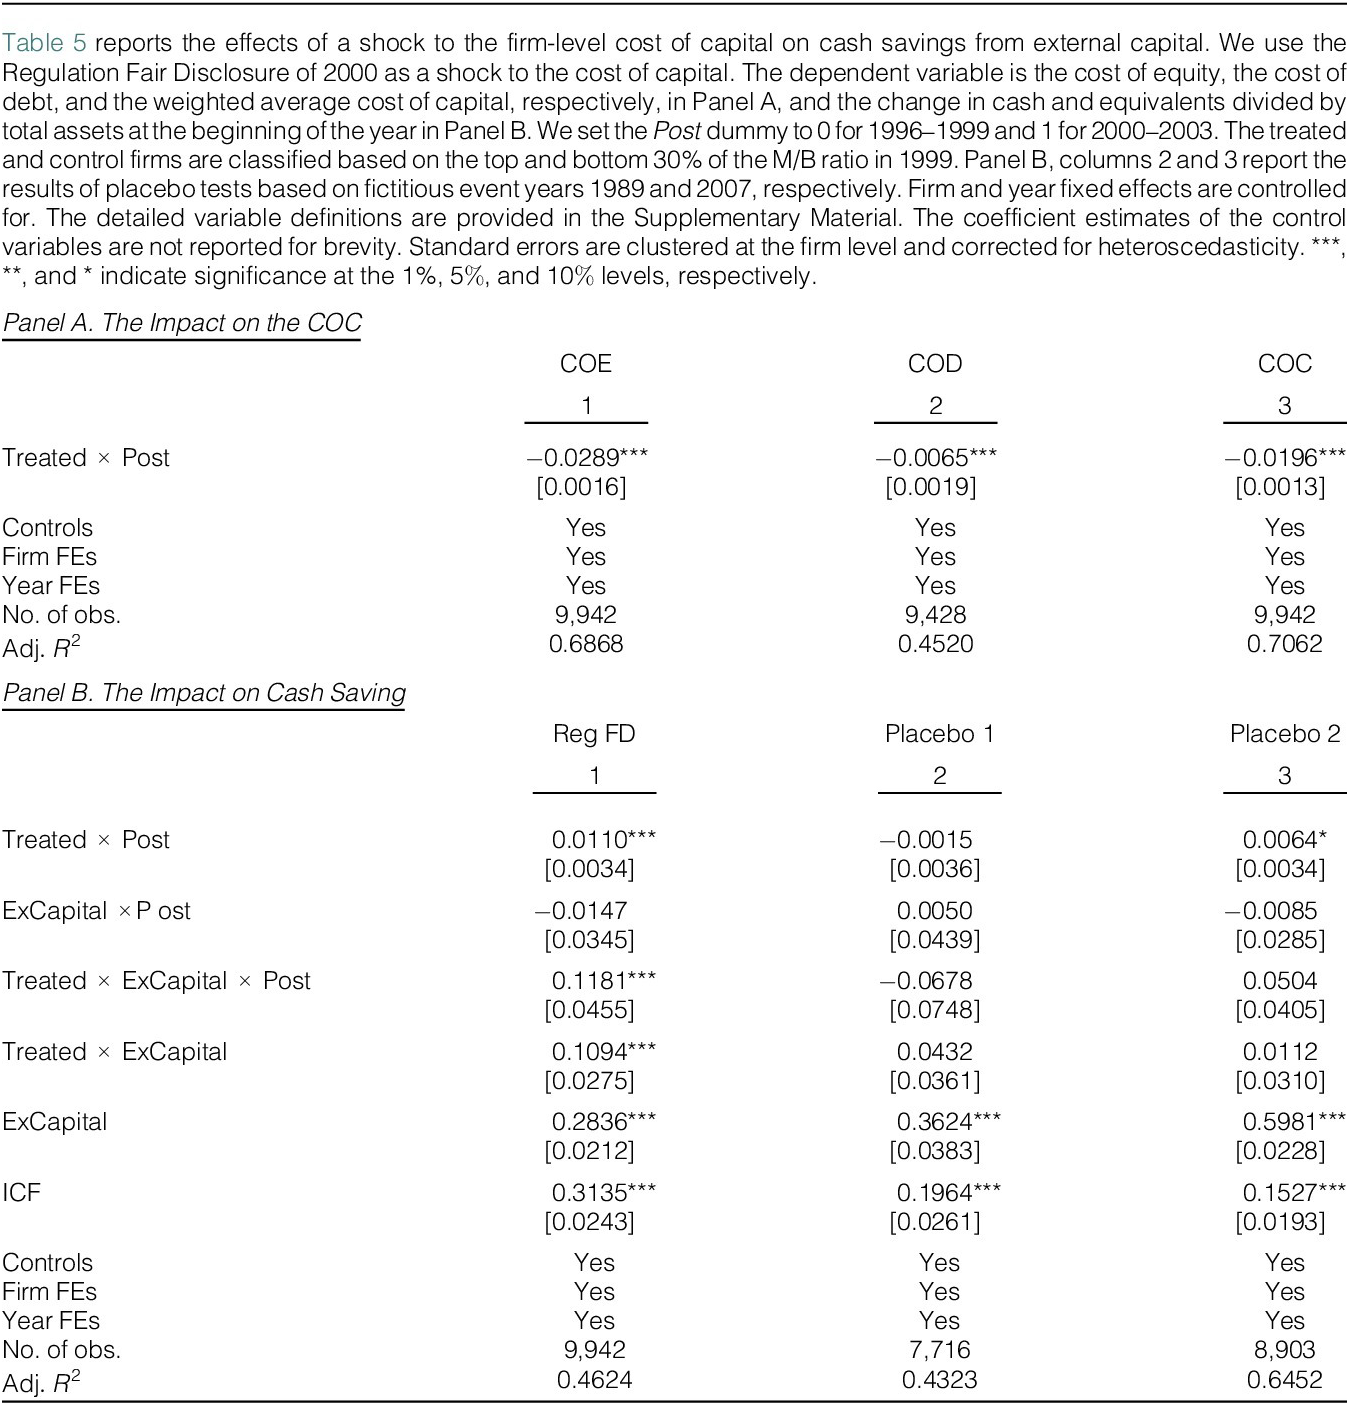
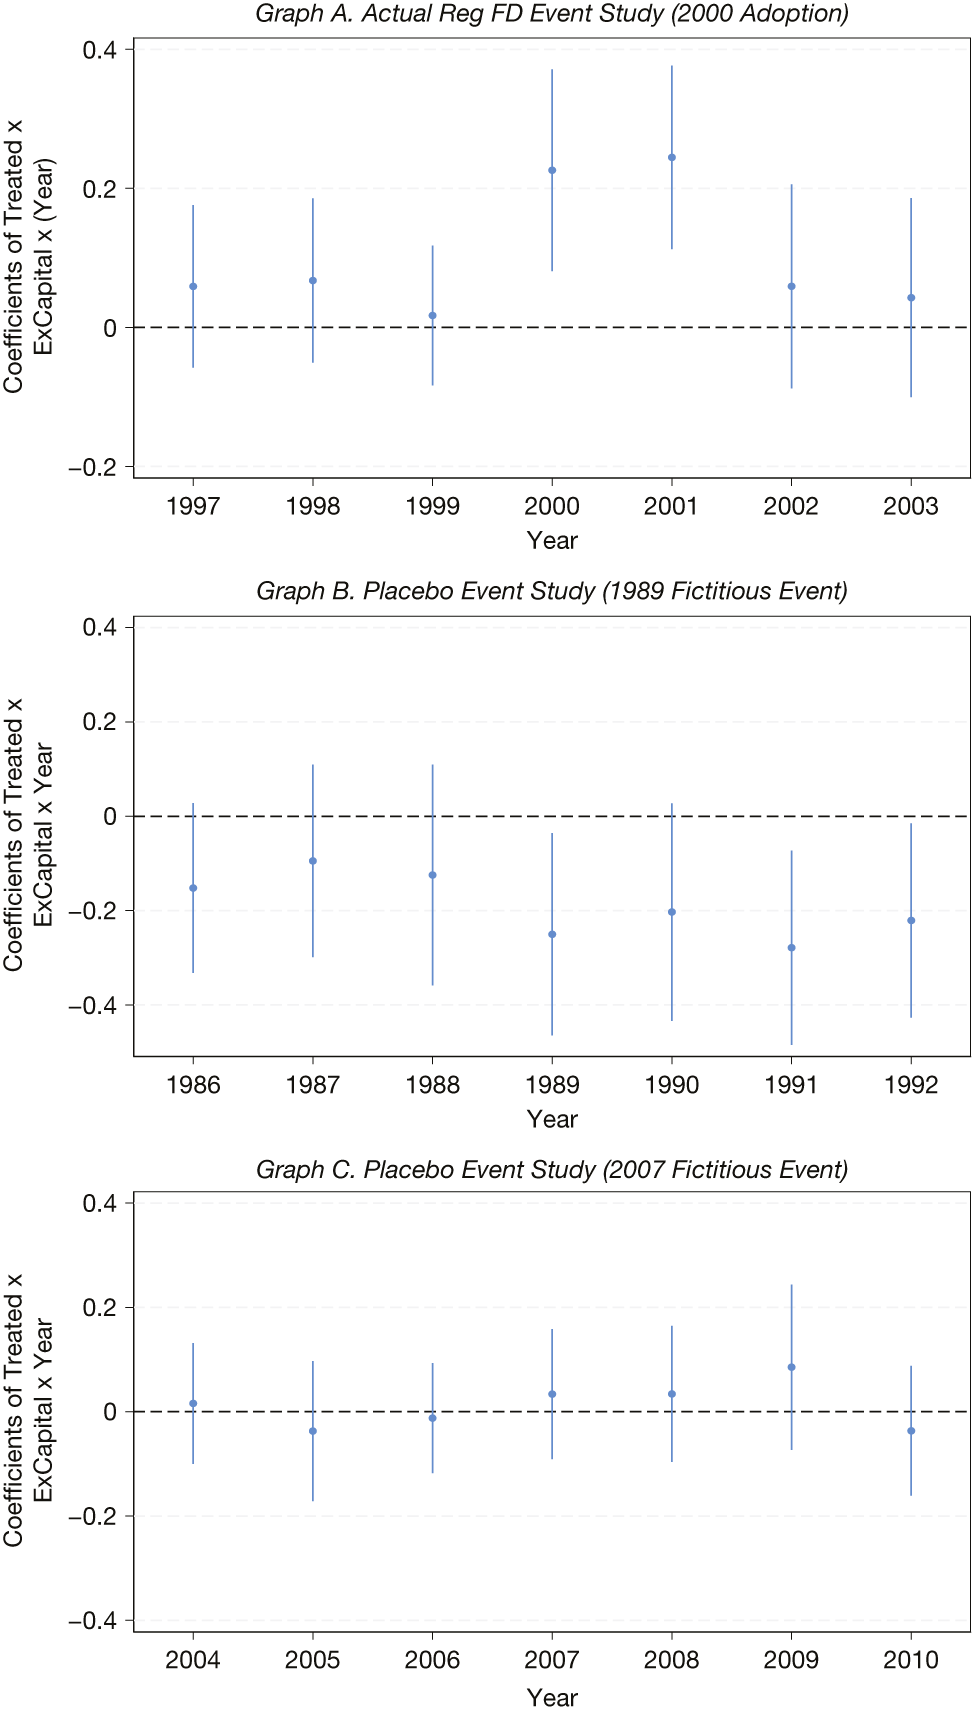
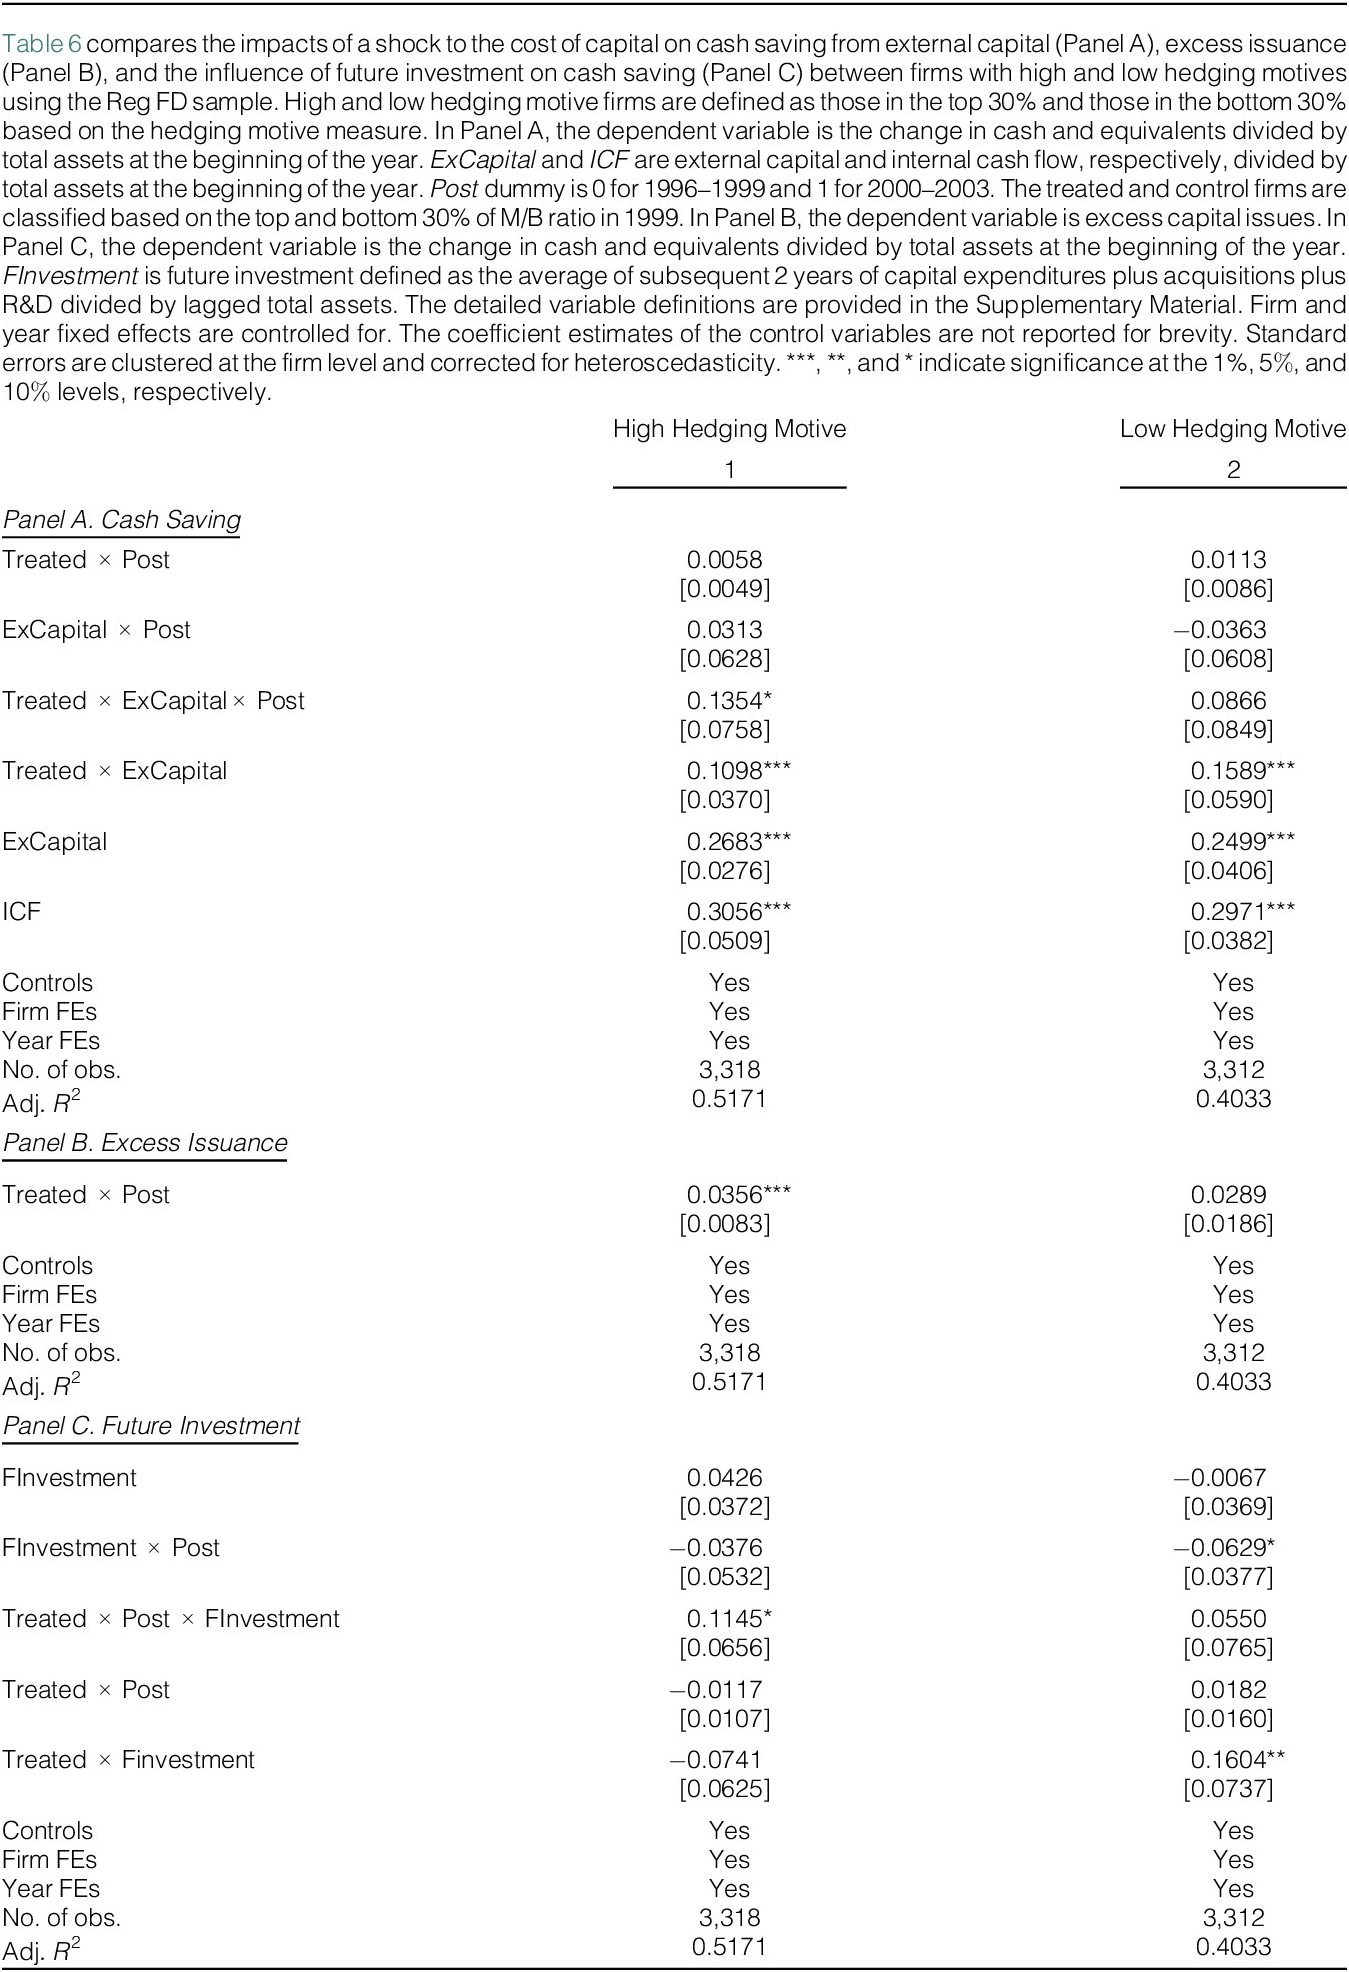
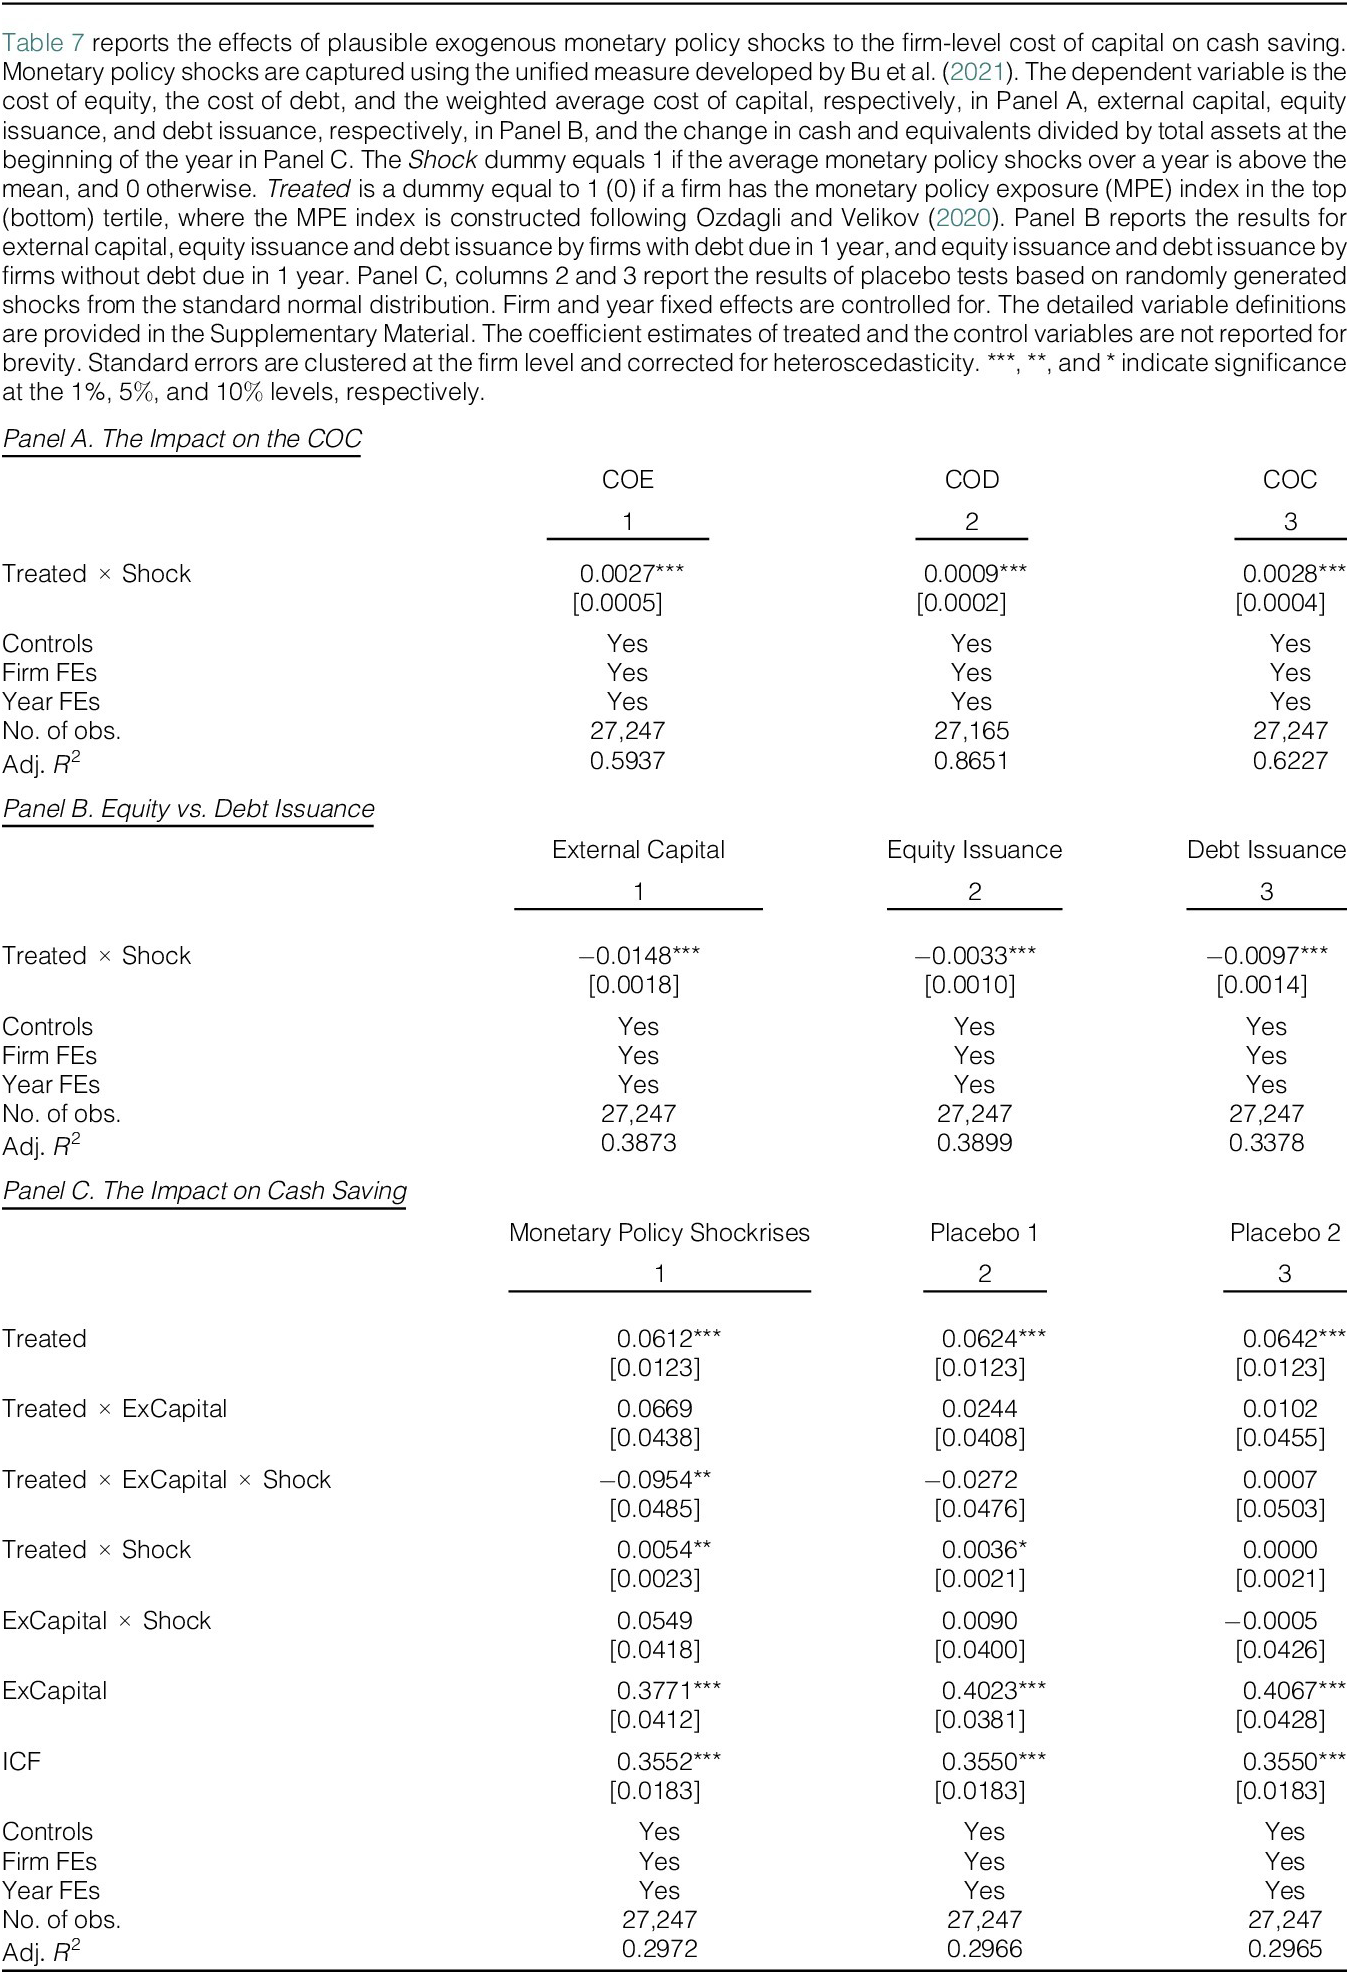
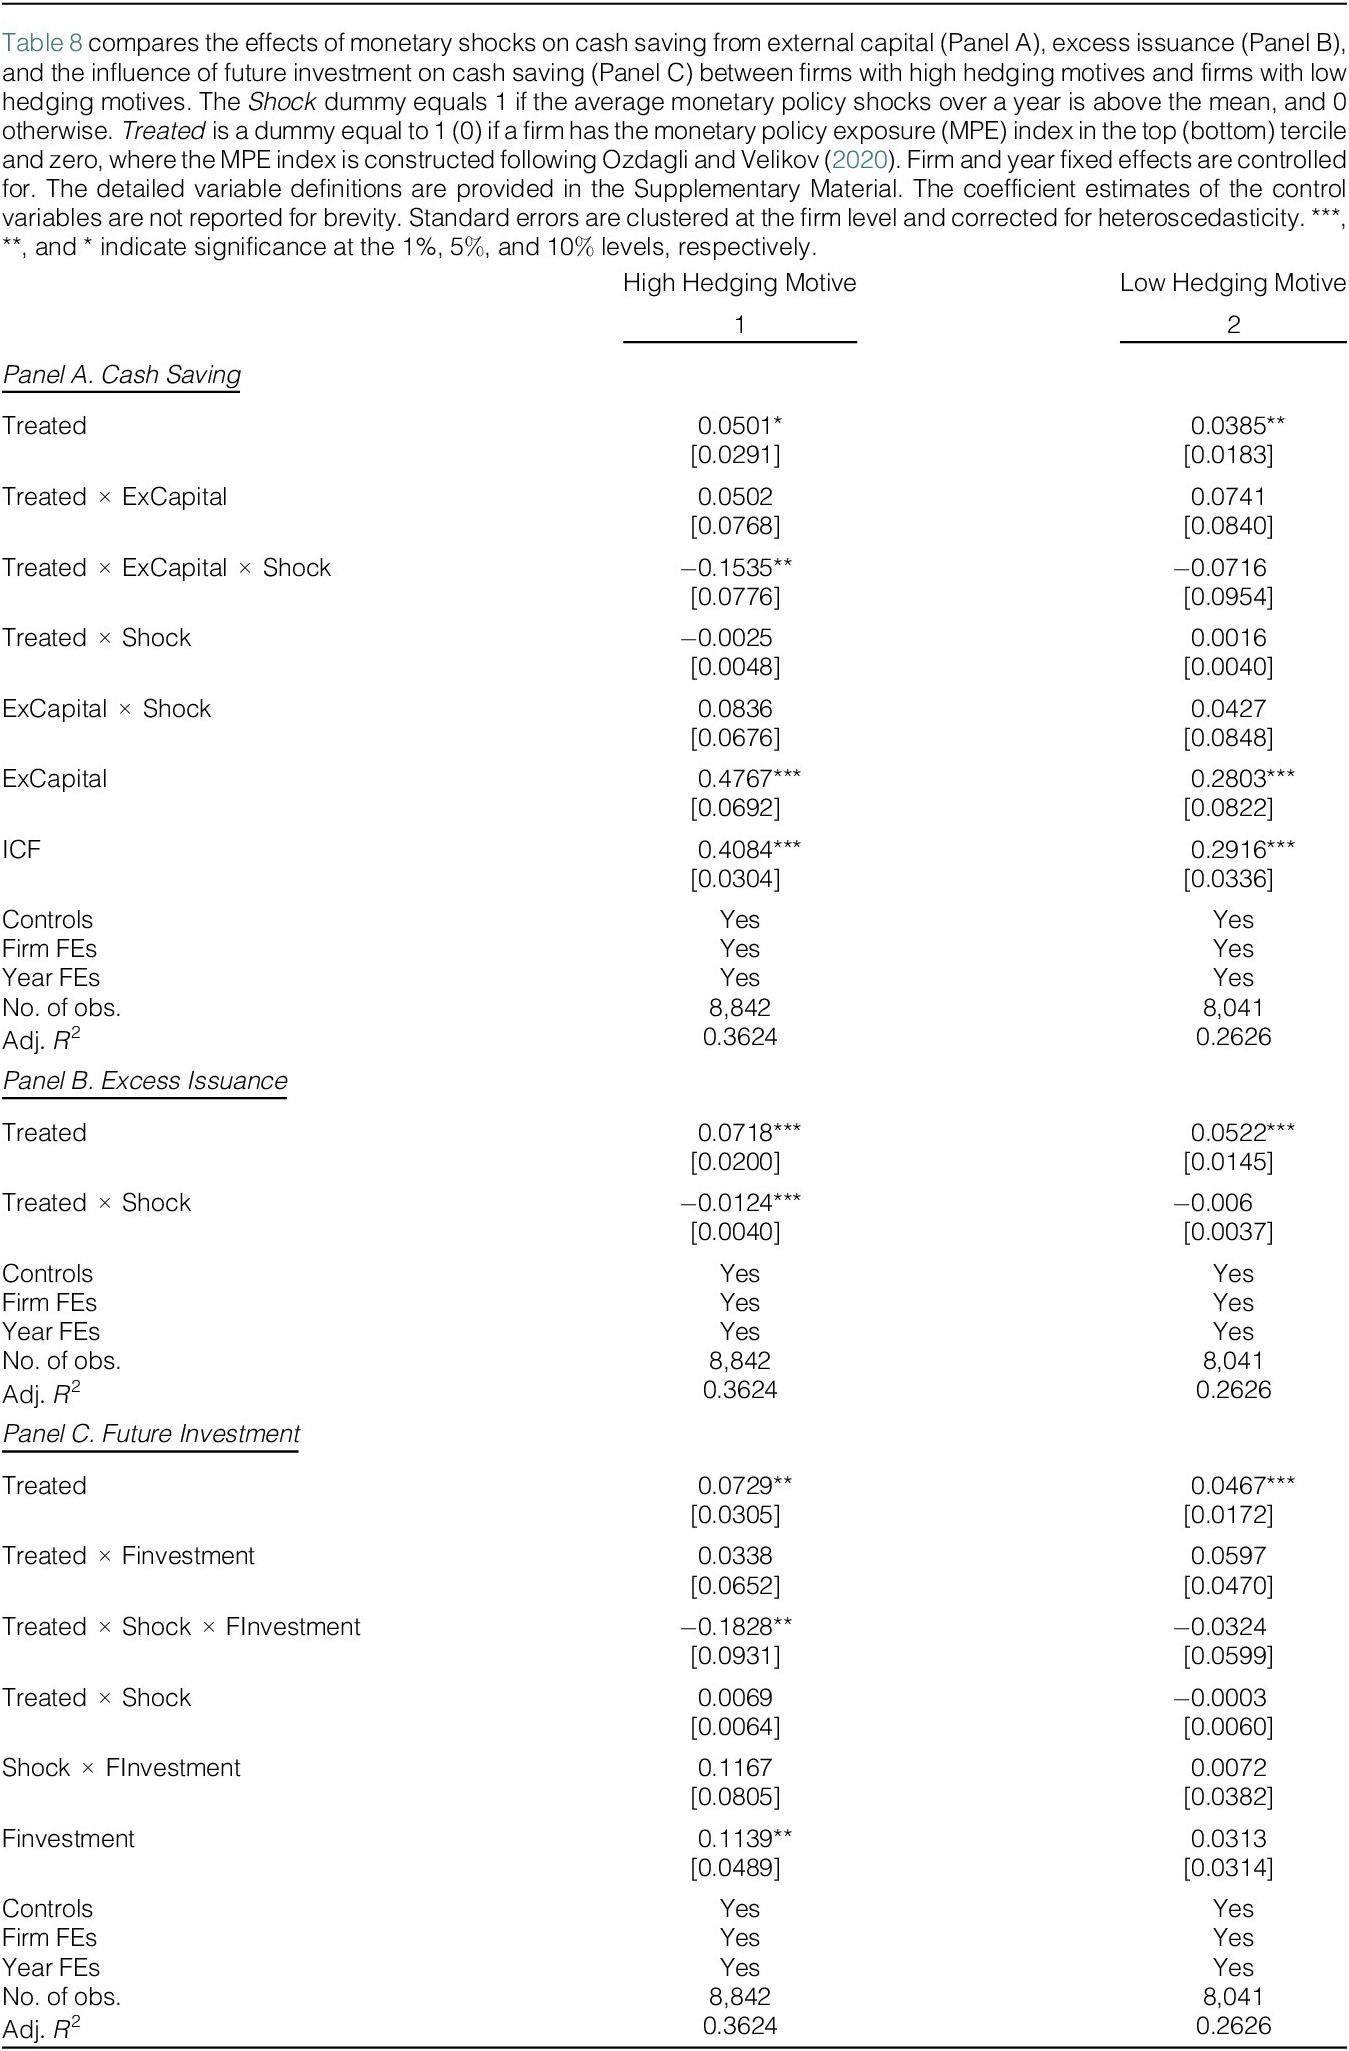


 Open access

