1. Introduction
Has population growth changed the agricultural land? Did the change in the share of agricultural land and productivity induce population growth? Does a decline in population growth reduce the expansion of agricultural land? These questions have no clear and scientific answers. One difficulty in answering these questions is the lack of robust empirical research addressing land use and population growth. Research has previously focused on case studies, which often depend on the individual level of interaction between the physical and human world. Although the case studies illuminate the particular intricacies of the population and land use relationship, these are not comparable across varying geographies (Hoffmann, Reference Hoffmann, Weith, Barkmann, Gaasch, Rogga, Strauß and Zscheischler2021; Jolly & Torrey, Reference Jolly and Torrey1993).
Our study, using an Indian context, will attempt to examine the long-term contested discussions between optimists and pessimists regarding their concern for population growth and food production. Current interest is shifting toward population and land use with a reduction in per capita land in increasing world population scenarios. Whether Malthus' view about food insecurity owing to increasing population and limited land is accurate or Boserup's thoughts of technological transformation in agricultural land use to sustain the growing population seem correct, these issues remain debatable. At its outset, this study is an attempt to work for a resurgence of population and land debates through the theoretical framework of the Boserupian school of thought (Turner & Fischer-Kowalski, Reference Turner and Fischer-Kowalski2010).
Malthusian thought concerns the ecological limit of the land, as increasing populations will demand more land for sustenance with food and other essential materials. Boserup, on the contrary, argued that increasing population pressure will innovate and intensify the methods for increasing production from limited land. Boserup viewed population density as the major determinant in innovating modern farm technology for better food production with changes in land use systems. In many countries, including India, farm technology was implemented due to increasing population pressure, although land encroachment for agriculture has also been carried out. Thus, both intensification and extensification of agricultural land occurred simultaneously.
The core of this study is to theoretically and empirically document how the “man–land” interaction evolved in Indian context. Although several studies have investigated the relationship between population and agricultural land, most of them have established a correlation at a point in time or merely postulated theoretical arguments. Only limited studies have assessed the dynamic relationship between population growth and agricultural land, using panel data over a long period in the Indian context. We have investigated the relation of population growth, instead of size and density, with the share of agricultural land use for the last six decades in Indian districts. Some studies have found a multiphasic response between population pressure and agricultural land use change, even though they show the role of increasing population in the tradeoff between extensification and intensification of agricultural land (Bilsborrow, Reference Bilsborrow1987; Codjoe & Bilsborrow, Reference Codjoe and Bilsborrow2011; Turner & Ali, Reference Turner and Ali1996). Our study not only analyzes population growth as one of the major determinants for agricultural land use change but also attempts to capture the response of agricultural land use through India's demographic transition during the last six decades.
Modern debates on land and population are concerned with the environmental degradation of the land due to the use of degradative materials to raise agricultural production and fulfill the demand for food amid population pressure. This debate has its roots in the Malthusian–Boserupian debate of limited land for food production and increasing population size. The relevance of this study is to highlight the Malthusian–Boserupian debate of land and population growth with a unique empirical approach, which employs a long-term district-level panel data analysis in the Indian context. This study contributes significantly to the literature on population, development, and environment. In particular, the major contributions of this paper are fourfold. First, the study formulates a theoretical framework to study the long-term relationship between population and agricultural land. Second, it employs a cutting-edge econometric approach using long-term panel data to test the study hypothesis, i.e., whether the population growth rate influences the increase or decrease in cultivated land. Third, using a spatial econometric regression model, it addresses the geographical heterogeneity of the population growth rate and agricultural land use. Finally, the main findings are reaffirmed using several robustness checks, including analyses of alternative outcome variables, alternative break points in a segmented regression model, and analysis in light of land reforms in Indian states.
The findings of the study suggest that population growth is one of the major determinants in the expansion and reduction of agricultural land. We found a two-stage split relationship between population growth and agricultural land with a breakpoint during the 1980s. Prior to the 1980s, the impact of the population growth rate on cultivated land was positive and significant. There was an expansion of cultivated land in response to the exponential increase of the population. During the post-1980s, there was a gradual reduction in cultivated land with a decline in the population growth rate and an intense rise in agricultural productivity. At the outset, the study suggests, from a policy standpoint, that to prevent cropland expansion at the expense of environmental sustainability, population growth in high-fertility states should be reduced, and innovative and superior technologies should be adopted early in the agricultural intensification process.
The paper is organized as follows. The next section (section 2) discusses the background and literature review. Section 3 describes the trend of population growth rates and agricultural land use in India. Section 4 discusses the theoretical framework of the study. Section 5 illustrates the empirical approach of the study, i.e., the hypothesis, data sources, panel construction, and variables. Section 6 describes the econometric approach of the study. Section 7 depicts the results of various econometric models along with robustness checks, while sections 8 and 9 deal with the discussion and conclusion of the study, respectively.
2. Background and literature review
To sustain the growing population, food production must keep up with growing demand and there are two ways to do so: either expanding agricultural land or intensifying the agricultural land cultivation. Malthus was concerned about the limited availability of agricultural land. He said that with increasing population, agricultural land use expands to raise food production (Malthus, Reference Malthus1973). The new lands acquired for agricultural practice will be less productive than land already in practice because most fertile land is already in use. However, he was unaware of the rapid development of agriculture after the Industrial Revolution. The concern of biological and agricultural scientists in the 20th century was the ecological limits of food production. They hardly believed any future expansion in agricultural production is possible with the technological advancement. Thus, they have warned about food insecurity and environmental degradation because of rapid population growth (Ehrlich et al., Reference Ehrlich, Ehrlich and Holdren1977; Ehrlich & Holdren, Reference Ehrlich and Holdren1971; Raven, Reference Raven1990) and this would result in the Malthusian catastrophe when the food supply could no longer support an expanding population (Fig. 1). Nevertheless, after two centuries of uninterrupted expansion in population and food production, as well as economic advancement, it is difficult to imagine a disaster caused by overpopulation alone (Johnson, Reference Johnson1997).
Pessimists vs. optimists: theoretical differences in arguments of population change and food production.
Source: Martín i Oliveras, Martín-Arroyo Sánchez, and Revilla Calvo (Reference Martín i Oliveras, Martín-Arroyo Sánchez and Revilla Calvo2017).

Neoclassical economists, on the other hand, promulgated and emphasized technological advancement and the substitution of scarce resources with more abundant ones to persist high quality of living with limited resources (Simon, Reference Simon1981; Stiglitz, Reference Stiglitz and Smith1979). Boserup's investigation of agricultural systems of African and Asian countries concluded that with evolution and innovation in farm technology (e.g., fertilizers, soil conservation, irrigation system, farming machinery) and innovative use of finite resources (e.g., cropland intensification, terrace farming, fallow shortening), rapid increase in population could be sustained with increased food production (Boserup, Reference Boserup1965, Reference Boserup1970, Reference Boserup1981). According to Boserup, population expansion will spur innovation in agriculture (Fig. 1). However, she was criticized on the grounds that extreme conditions of poverty and slow economic development would not allow for innovation, as was the situation for many African and Asian countries (Dasgupta, Reference Dasgupta1992). Boserup and Simon were also criticized for their simplistic conclusion, that technological progress would resolve the Malthusian problem and would stay ahead of population growth (Brander, Reference Brander2007).
Amid these arguments and counterarguments in the later 20th century, four reports were published by the United Nations (1953, 1973) and the National Academy of Sciences (1971), National Research Council (1986), two by each. Both organizations were pessimistic in their earlier reports, suggesting negative consequences of population growth. On the contrary, later reports were somewhat revisionist in thinking and made a guarded assessment of the net impact of population on development (Kelley, Reference Kelley, Birdsall, Kelley and Sinding2001). The 1993 report of NAS directly addressed the issue of population and land use in developing countries (Jolly & Torrey, Reference Jolly and Torrey1993). This report said that rapid population growth affects land use in the long run and is disadvantageous for environmental sustainability and human well-being.
Recent arguments between these two perspectives have evolved toward sustainable land use considering the rising threat of climate change and environmental damage in developing nations due to high population density. Sustainability and living standards are key themes in modern population growth and resource management literature. This debate on sustainability is beyond the scope of this study as it focuses more on the relationships between finite land and growing population pressure. The earlier literature in the global and Indian context addresses the two important questions that have been discussed below. Most of the earlier literature classifies the response of agricultural land to population growth as extensification or intensification. We classified the literature with population-induced land use changes, whether extensification or intensification, and the limited possibility of land use changes. Some studies also concluded the simultaneous response of agricultural land as extensification or intensification, which is also discussed.
2.1 Does population growth change the agricultural land?
2.1.1 Extensification of agricultural land
Population-induced changes in agricultural land can be either extensification (conversion of non-agricultural arable lands into agricultural land) or intensification (using tools and labor to increase production on the same land). Malthus' view is one of the earliest descriptions of cultivated land extensification due to increasing population (Malthus, Reference Malthus1973). He further said that the increasing number of people need to be migrated to new lands for agricultural extensification without population checks. But this is a temporary solution, he added. Among the early researchers, Clark (Reference Clark1967) and Perkins (Reference Perkins1969) provided extensive studies on agricultural land extensification in response to population growth. Clark compared land use change and population growth between developed and developing countries, showing how much land is needed for developing nations to maintain the same food and calorie intake as developed countries. However, Clark's data were mostly concentrated on developed nations, and his major limitation was the interpolation of empirical data from the developed to the developing world. Perkins showed how China's growing population, which increased from 75 to 647 million between 1400 and 1957, led to an expansion of agricultural land from 25 to 112 million hectares. Although he also found some evidence of small-scale intensification, the primary response was extensification.
Stonich (Reference Stonich1989) found that in Honduras, population growth leads to smaller land holdings (the land-to-man ratio decreases), forcing the growing population to migrate to highlands to clear forests for setting up new farms to sustain the population. Similar results were found by Cruz (Reference Cruz, Bilsborrow and Hogan1999) in the Philippines, where a rapidly increasing rural population with unequal land distribution leads to smaller land holdings and significant agricultural land extensification, causing massive deforestation. Bilsborrow and Stupp (Reference Bilsborrow, Stupp, Pebley and Rosero-Bixby1997) used agricultural and population census data for Guatemala to link population growth in origin places with deforestation for agricultural land by out-migrants in destination places. Similarly, increasing population growth rates in Kenya also induced out-migration and agricultural land extensification in destination areas by forest clearance (Bilsborrow & Okoth Ogendo, Reference Bilsborrow and Okoth Ogendo1992). A study by Maertens et al. (Reference Maertens, Zeller and Birner2006) in Indonesia found that with increasing population, there is a differential effect on agricultural land extensification based on the location of land (upland or lowland). A recent study by Knauer et al. (Reference Knauer, Gessner, Fensholt, Forkuor and Kuenzer2017) in Burkina Faso, using satellite images, found that with a 3% annual population growth, there was a 91% increase in rainfed agricultural land with massive forest loss. Gray and Bilsborrow (Reference Gray and Bilsborrow2020) also found similar land clearance evidence in the Amazon region.
2.1.2 Intensification of agricultural land
In earlier studies of population and land use intensification, Ester Boserup (Boserup, Reference Boserup1965, Reference Boserup1981) provided comprehensive insights on global trends in land use change and population growth. Boserup (Reference Boserup1965) postulated that population growth is independent of food production and that the pressure of an increasing population drives land use change through land intensification in five stages: forest fallow, bush fallow, short fallow, annual cropping, and multi-cropping. She showed that with increasing population pressure via rural population density, people focus more on land-saving and land-intensifying methods. This intensification occurs with innovations in cultivation tools, an increased labor force, changes in land tenure systems, and rural investments. However, some economists disagreed with her theory and said that only cropping intensity increases more in response to population pressure rather than innovation in agriculture (Grigg, Reference Grigg1979).
A historical study by Blaikie and Brookfield (Reference Blaikie and Brookfield1987) in Papua New Guinea found many agricultural innovations through time as the population increased. In Kenya, Tiffen et al. (Reference Tiffen, Mortimore and Gichuki1994) found results opposite to the Malthusian presumption of extensification due to population growth. With a sevenfold increase in population between 1900 and 2000, the population sustained itself through land intensification in the following stages: grazing, shifting cultivation, sedentary agriculture, cattle-plowing, and integrating crops with livestock. Pender (Reference Pender, Birdsall, Kelly and Sinding2001) has clearly explained this evolutionary relationship between population growth and agricultural land use patterns. Pender points out eight broad stages of this relationship, starting with the extensification of cropland, followed by the shortening of fallow periods, adoption of labor-intensive methods, labor-intensive land investments, capital investment, knowledge intensification, mixed land use, change in occupation and migration, and ends with a change in fertility decision of household. In Vietnam, shifting cultivation with limited land availability induced deforestation and agricultural extensification, but the introduction of individual rights in the late 1980s led to agricultural land intensification and forest restoration (Tachibana et al., Reference Tachibana, Nguyen and Otsuka2001). A recent study by Eckert et al. (Reference Eckert, Kiteme, Njuguna and Zaehringer2017) used Google Earth and Landsat images to study land use change in Kenya from 1987 to 2016. They found that the period from 1987 to 2000 was associated with the extensification of agricultural land, while since 2000, intensive agriculture has been more common with improved irrigation facilities. Other studies have shown similar conclusions about the effect of population pressure (density or growth) on agricultural land intensification (Dias et al., Reference Dias, Pimenta, Santos, Costa and Ladle2016; Josephson et al., Reference Josephson, Ricker-Gilbert and Florax2014; Ricker-Gilbert et al., Reference Ricker-Gilbert, Jumbe and Chamberlin2014; Spera, Reference Spera2017).
2.1.3 Simultaneous presence of extensification and intensification
A few studies depict both extensification and intensification at the same time in response to population growth. Bilsborrow (Reference Bilsborrow1987) uses Davis' (Reference Davis1963) theory of multiphasic response in the Malthusian and Boserupian debate on the extensification and intensification of agricultural land. He stated in the presence of population pressure, land extensification has been witnessed in many countries, but land intensification also parallelly worked in those areas with increasing use of fertilizers, high-yielding seeds, increased irrigated areas, etc. (Bilsborrow, Reference Bilsborrow1987; Bilsborrow & Geores, Reference Bilsborrow, Geores, Arizpe, Stone, Major and Stone2019; Codjoe & Bilsborrow, Reference Codjoe and Bilsborrow2011; Gray & Bilsborrow, Reference Gray and Bilsborrow2020). Studies in consideration of the population density of developing countries, especially China and India, showed that along with increasing cropland, adopting intensive farming systems pushed food production manyfold (Hayami & Ruttan, Reference Hayami, Ruttan, Johnson and Lee1987; Pingali & Binswanger, Reference Pingali, Binswanger, Johnson and Lee1987). Bilsborrow and Geores (Reference Bilsborrow, Geores, Arizpe, Stone, Major and Stone2019) and Heilig (Reference Heilig1994) also concluded a weak but positive relationship between population growth and irrigated land-fertilizer use through temporal changes of country-level data. Carswell (Reference Carswell2002) studied part of Uganda for 50 years and found that fallow lands were increased rather than decreased due to population growth. This happened with land extensification, clearing swamps, and intensification through inter-cropping, crop rotation, and higher production.
2.2 Does limited agricultural land control population growth?
Some scholars counter the idea that population pressure leads to an increase in agricultural productivity and intensification. Higher population densities do not always result in increased agricultural productivity, particularly in locations where farmers own less land and the area is resource-deficient (Lele & Stone, Reference Lele and Stone1989). According to Dasgupta (Reference Dasgupta1992), under extreme poverty and low development rates, people suffer from a vicious cycle of poverty, population growth, environmental degradation and extreme poverty, making Boserup's postulations inapplicable in these settings. The financial cost of bringing new land into cultivation is also substantially higher, preventing developing countries from expanding their land base. According to Scherr and Yadav (Reference Scherr and Yadav2001), land degradation poses a severe threat to food production and rural livelihoods in high-population-density areas of developing countries. They emphasize the importance of land management and land-improving investments through new policies to sustain the growing populations by meeting food demand. Diversification in agricultural land use is possible when basic calorific sufficiency through food is attained, and the goal for quality and diversity in food accessibility demands control of population growth. Studies by Magazzino et al. (Reference Magazzino, Cerulli, Shahzad and Khan2023) and Magazzino et al. (Reference Magazzino, Cerulli, Haouas, Unuofin and Sarkodie2024) show how population growth, especially in urban areas, and rapid changes in agricultural land use increase greenhouse gas emissions, posing a serious threat to the climate. Growing populations induce pollution through agricultural land use change and intensification, which poses significant challenges for developing nations with limited resources. Financial investment in agriculture is required for the adaptation of sustainable technology and innovations in developing countries (Magazzino et al., Reference Magazzino, Mele and Santeramo2021; Magazzino & Santeramo, Reference Magazzino and Santeramo2023).
The well-known Maasai tribes of East Africa have serious issues with limited available land relative to their large population size due to pre- and post-colonial policies (Sindiga, Reference Sindiga1984). The land available for the Maasai does not allow them to be self-sufficient and economically sustained. Carswell (Reference Carswell2002) describes the simultaneous presence of extensification and intensification in parts of Uganda but also expresses concern about future agricultural changes as further extensification has reached its limits and all possible means of intensification have already been applied. In developing countries, an increase in population leads to fragmentation of household holdings and increased landlessness, forcing rural populations to either out-migrate to urban areas for new job opportunities or to other arable and forest areas for agricultural establishment, resulting in extensification in these regions (Bilsborrow, Reference Bilsborrow, Hunter, Gray and Véron2022; Bilsborrow & Okoth Ogendo, Reference Bilsborrow and Okoth Ogendo1992; Bilsborrow & Stupp, Reference Bilsborrow, Stupp, Pebley and Rosero-Bixby1997). Thus, due to the limited availability of arable land, Malthus' thoughts on out-migration to new lands and other countries are well-predicted.
2.3 Population and agricultural land use studies in India
Many studies have investigated land use changes in India, but their emphasis is mostly on land use change rather than land use–population interactions (Roy & Roy, Reference Roy and Roy2010; Tian et al., Reference Tian, Banger, Bo and Dadhwal2014). The land cover of India has altered dramatically, particularly the forest cover. From 1880 to 2010, forest cover decreased by 29%, while agricultural area rose by 51% (Tian et al., Reference Tian, Banger, Bo and Dadhwal2014). Cropland conversion is faster than cropland extension in India and other emerging nations (Richards & Flint, Reference Richards and Flint1994).
The scant-known literature on population and land use interactions is limited to either local areas or mostly uses cross-sectional designs. For instance, a comparative case study undertaken by the United Nations in 1975 in districts of Punjab and Orissa revealed that positive population growth is connected with agricultural transformation by increasing production (United Nations, 1975). However, they also demonstrated that the limited possibility of labor intensification in agriculture in those areas generates labor surplus and forces off-farm employment search. Boyce (Reference Boyce1987) used data from 1901 to 1980 for West Bengal and Bangladesh to study agricultural output upon the growth of the population and concluded that agricultural growth took about 30 years to respond to population growth; while Mukhopadhyay (Reference Mukhopadhyay, Srinivasan and Vlassoff2001) empirically tested the reverse causality and found that agricultural production does affect population growth in India in about 5 years. Another study in India using district-level panel data from 1951 to 1991 showed that population density positively induced agricultural intensification (Mishra, Reference Mishra2002). However, while the work was focused on agricultural intensification, no discussion on agricultural land extensification was conducted. A study by Deb et al. (Reference Deb, Lynrah and Tiwari2013) in the northeastern states of India found that increasing population pressure on agricultural land among tribal shifting cultivators led to various innovations and adaptations for increasing productivity.
The major conclusions from the above studies are as follows: positive population growth is associated with both the expansion of cropland and the intensification of agricultural systems. The studies either show the effect of population growth on land extensification and intensification separately or document the coexistence of both processes. Studies in India have focused on agricultural intensification in response to changing population scenarios. Recent studies using satellite data have only focused on cropland expansion without connecting it to population growth. Long-term studies on agricultural land use change and population growth are also missing in Indian literature. Thus, a long-term study at the district level (as household and community level data for the long term are not available) is needed in the Indian context to understand the dynamics of population and agricultural land. India has witnessed a major demographic transition in the last 70 years. Over the period, India's population growth rate increased rapidly, slowed down, and has been declining since the 1980s. This transition in population growth rate needs to relate to changing agricultural land use to better understand Malthusian and Boserupian ideas in the Indian context.
3. Description of agricultural land and population growth in India
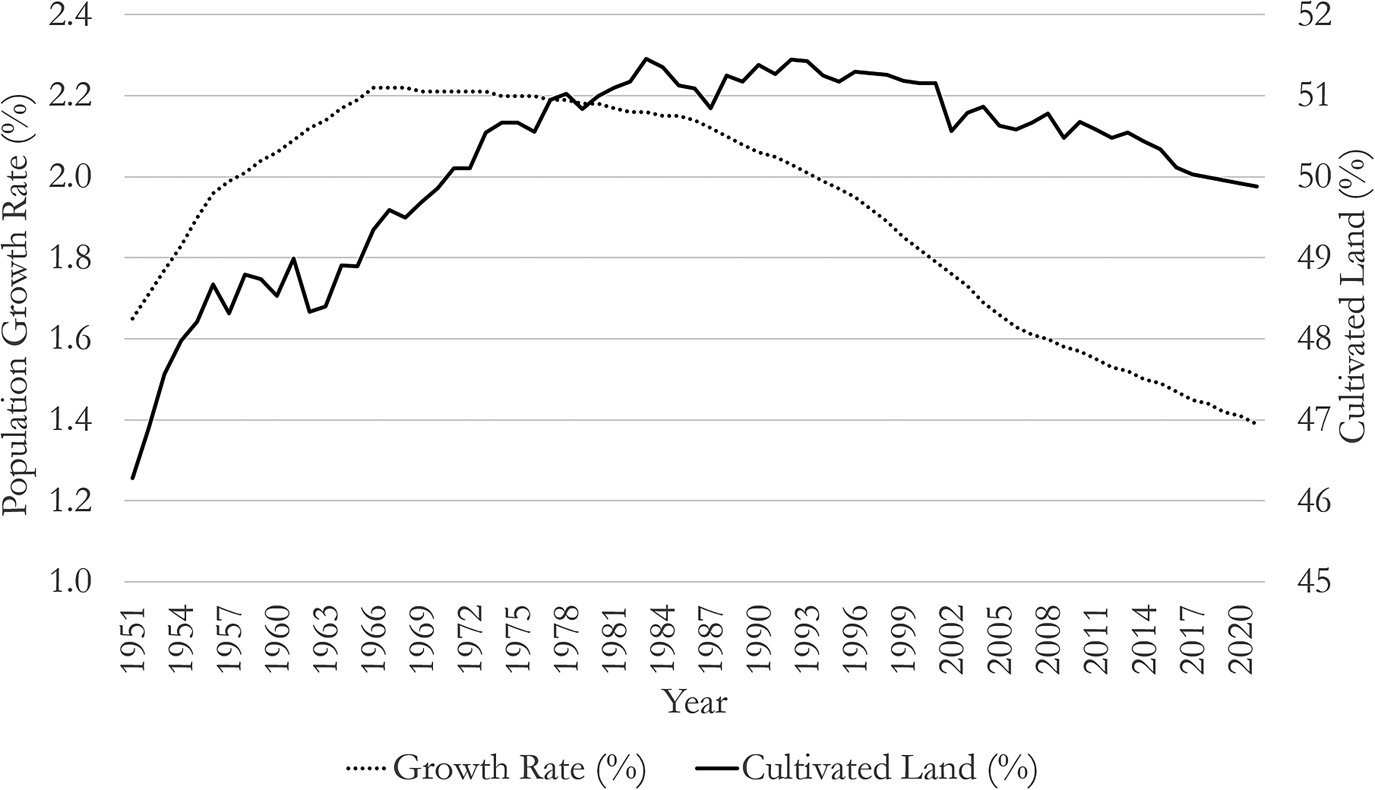
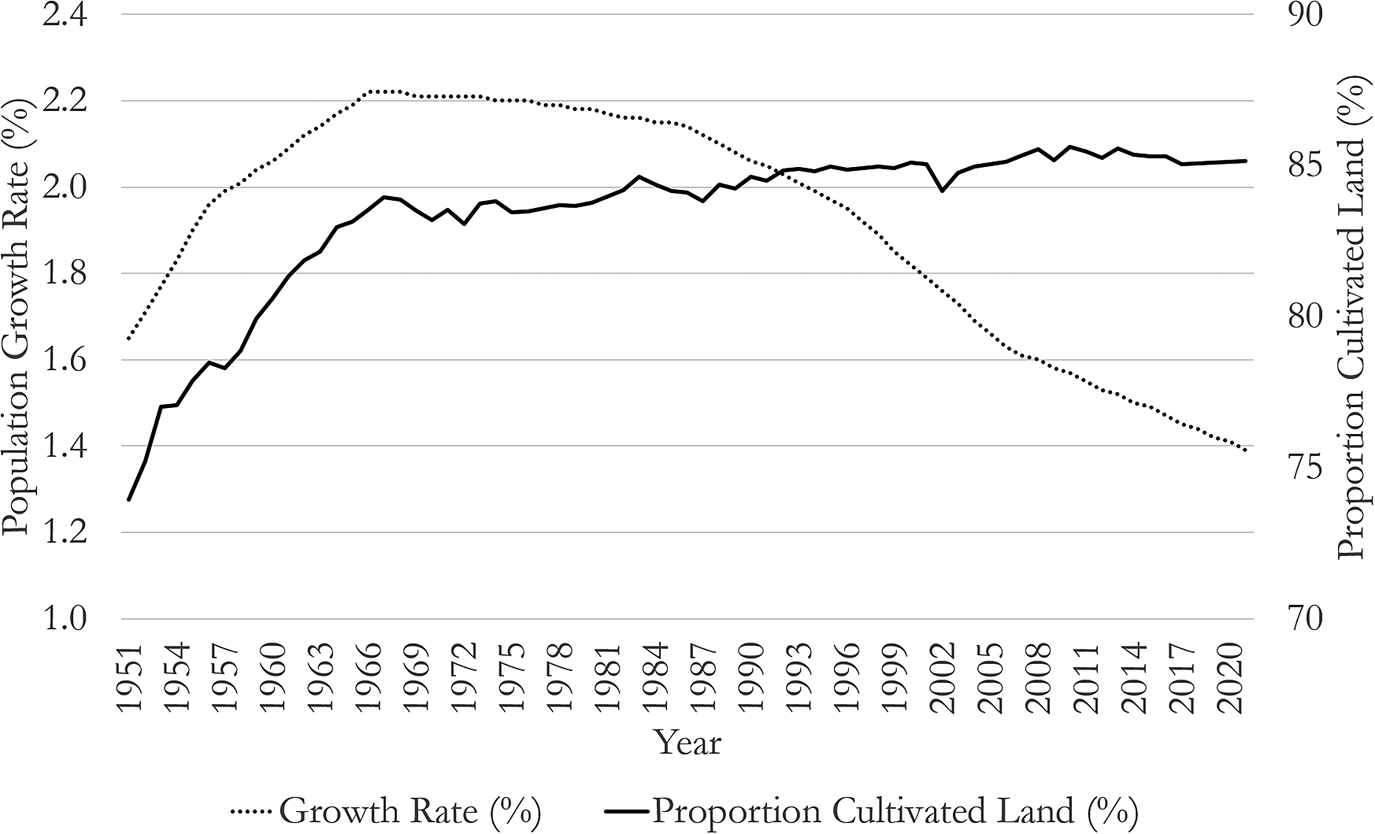
Before formulating a theoretical framework for the study, we have described the long-term trends in agricultural land and population in India. Figure 2 illustrates that since 1951, the rate of population growth has been significantly increasing, leading to an increase in the percentage of cultivated land,Footnote 1 to support the growing population. The population growth rate was increasing until the late 1960s, but remained high and stable until the 1980s, resulting in rapidly expanding absolute population numbers between 1951 and 1981. Since the 1980s, there has been a continuous drop in the population growth rate. The decline in cultivated land was also coupled with a decrease in overall agricultural land.Footnote 2 In 1951, the proportion of cultivated land out of total agricultural land was nearly 73%, but fast population growth increased it to 84% by the late 1960s (Fig. 3). However, since the 1970s, this share has remained constant with few variations.Footnote 3 It also indicates that land expansion was much higher till the late 1960s. Figure 2 also shows that the decline in the population growth rate is followed by the reduction in the use of cultivated land.


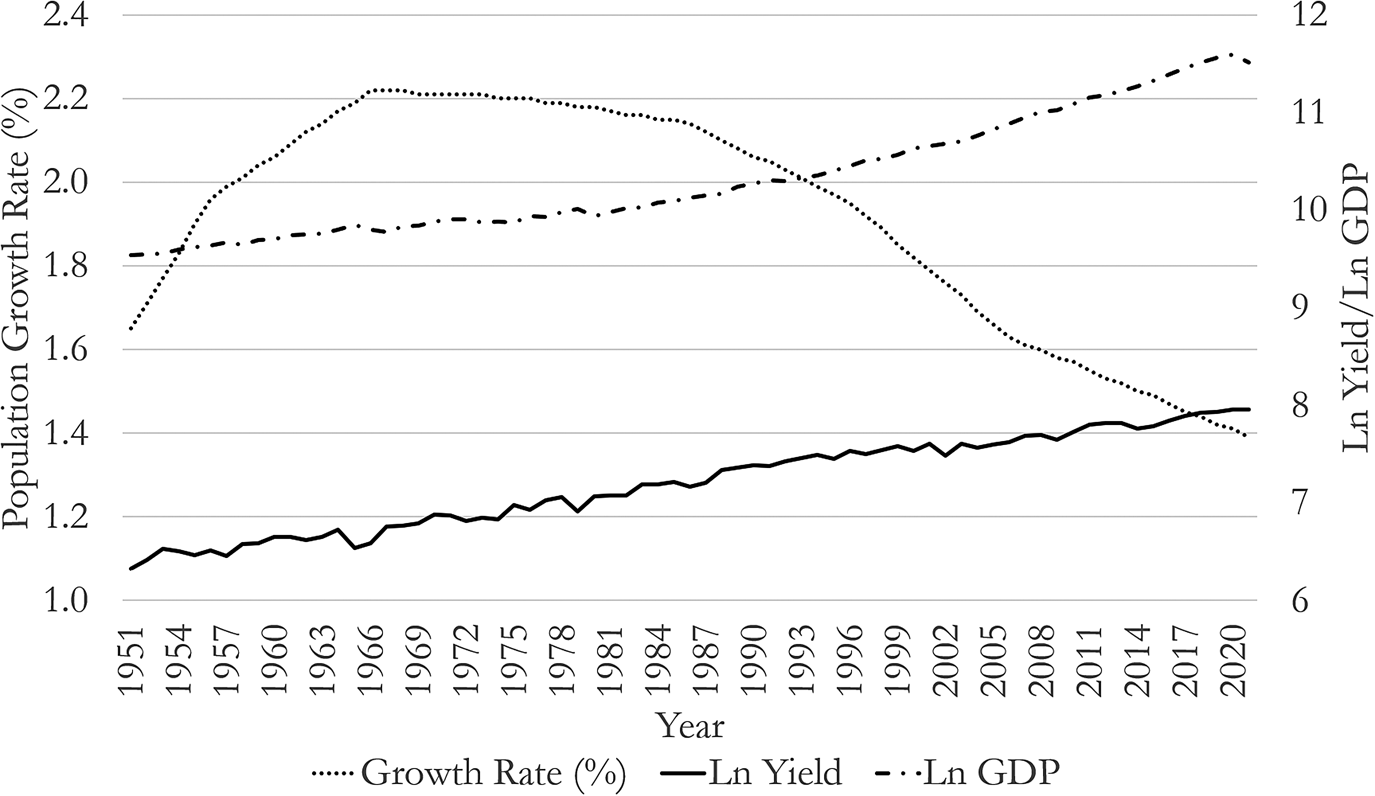
Along with the expansion of cultivated or agricultural land, India witnessed agricultural intensification with the Green Revolution. Figure 4 shows the yield of major crops as an indicator of agricultural intensification. Crop yields have been steadily increasing since 1951, with some fluctuations, though they gained rapid momentum from 1966 onwards with the introduction of high-yielding seeds and other modern agricultural intensification methods. This intensification in agriculture is also associated with economic development in India, as it made intensification methods economically viable. Economic growth helps to slow and further reduce the population growth rate by improving job opportunities, educating the population, and reducing gaps in social groups. Although the pace of economic development was slow until the 1990s, new liberal economic policies accelerated it, as illustrated in Fig. 4 with India's per capita gross domestic product. It can be said that agricultural development occurred as a result of rapid population expansion, as well as economic development, particularly after the 1990s.

4. Theoretical framework
The relationship between humans and land, more specifically population growth and agricultural land, is evolutionary. The term “evolutionary” is important since this relationship is not static; it varies over time based on demographic transitions. The theoretical framework presented in this study is primarily based on a synthesis of two distinct transitional systems: demographic and agricultural, as shown in section 3.
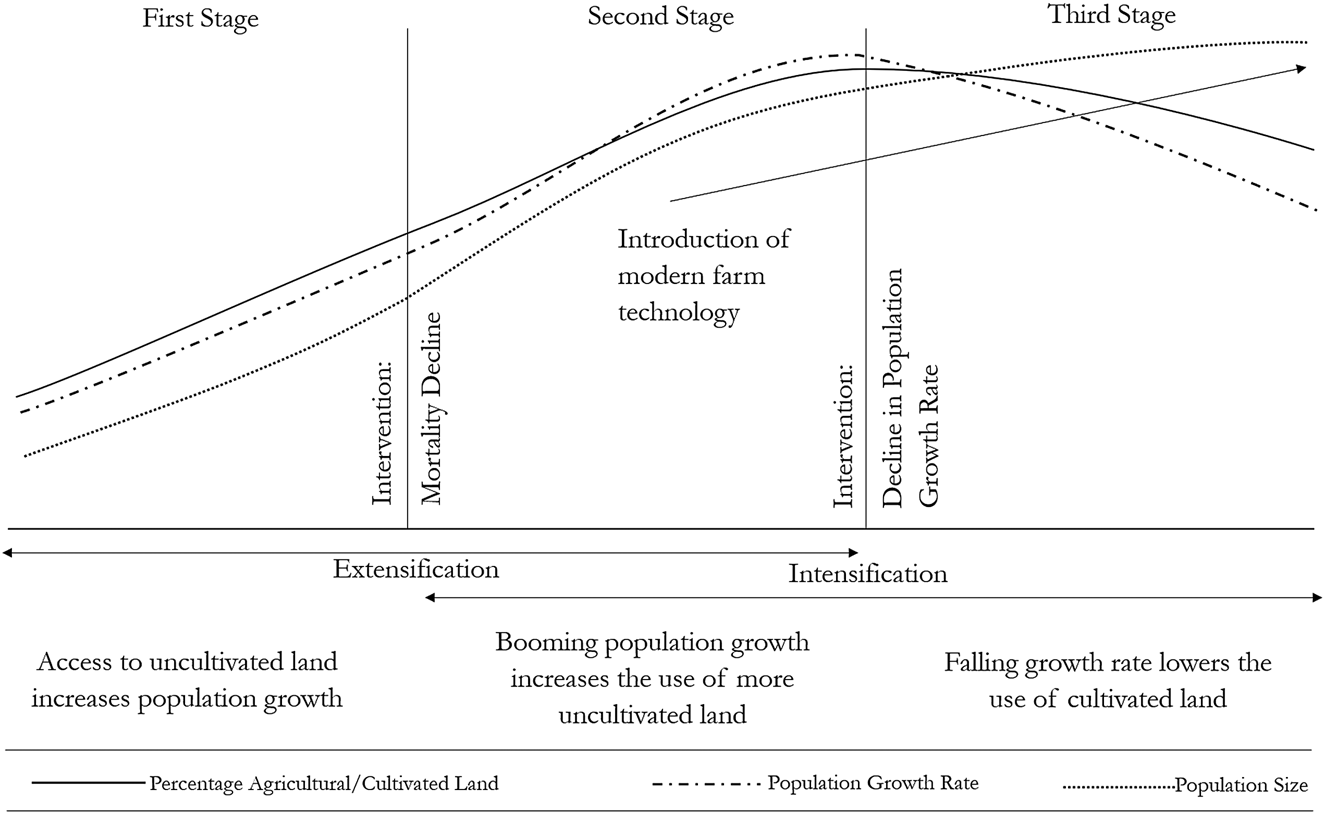
The relationship between land use change and population growth in our theoretical framework forms three stages (Fig. 5). In the first stage, starting with the dawn of civilization, access to unoccupied and unutilized arable land drives population growth. This stage is associated with the first stage of the demographic transition model (Davis, Reference Davis1945; Notestein, Reference Notestein and Schultz1945; Thompson, Reference Thompson1929). Assurance of food necessitates human acquisition of arable land. To secure food for survival and avoid famine, humans accessed additional land, which demanded more labor for farming. This need for labor was fulfilled by increasing household size. However, as mortality had a high prevalence in pre-industrial societies, both population growth and agricultural land expansion were slow. This stage would end with a decrease in mortality and a consequent population boom. This stage also witnessed some expansion in agricultural land due to population pressure. Although a clear distinction from the following stage is difficult, all countries experienced this stage before the 1800s, particularly during the pre-Industrial Revolution period. India experienced this stage before its independence, and the country's mortality rate started steadily declining from the 1940s (Dyson, Reference Dyson2018; Goli & Arokiasamy, Reference Goli and Arokiasamy2013).
Theoretical framework showing co-evolution of agricultural land and population growth transitions.
Source: Authors' construction.

The second stage is more crucial. Due to a reduction in mortality, the population expanded with persistently high fertility, increasing the use of agricultural land. This stage relates to the second stage of demographic transition. With a booming population, the rate of extensification of agricultural land was high. Early population growth following mortality reduction stimulated economic development by increasing labor force participation in agriculture (Coale & Hoover, Reference Coale and Hoover2015; Keyfitz, Reference Keyfitz1992). Land scarcity due to the exponential rate of population growth necessitated agricultural intensification. There were two forms of agricultural intensification: labor-intensive and technology-intensive (Boserup, Reference Boserup1965; Pender, Reference Pender, Birdsall, Kelly and Sinding2001). At this stage, only labor intensification was carried out. India witnessed this period before the 1980s, with very high fertility and low mortality (Dyson, Reference Dyson2018; Goli & Arokiasamy, Reference Goli and Arokiasamy2013). During this period, both agricultural land extensification and intensification coexisted (Bilsborrow, Reference Bilsborrow1987). However, with such a high population growth rate, extensification was widely practiced. In this stage, technology-intensive land intensification was in its initial phase, and with persistent high population growth, intensification methods were insufficient to halt cropland expansion. A decline in the population growth rate toward the end of this stage reduced the pressure on land, leading to a slowdown in cropland expansion.
Finally, in the third stage, which is related to the third stage of the demographic transition model, the population growth rate began to drop due to a fertility decline, combined with socioeconomic development and a reduction in the demand for farm labor, attracting agricultural workers to non-farm sectors. Technological innovation (both in agriculture and family planning techniques) helped to overcome the issues of limited land and overpopulation. The absolute number of the population still increased due to population momentum (the population growth rate declined but remained positive). At this stage, the rate of agricultural intensification surpassed the rate of population growth. This stage marked a reduction in both agricultural land use (cropland contraction and reforestation) and population growth. The reduction in agricultural land share was slower than the decline in the population growth rate because agricultural production still needed to support the increasing absolute number of people. With further advancements in demographic transition, like stable population growth rates and stationarity in the population, the need for more croplands will be reduced. However, it can be said that to cease the extensification process and further reduce the use of croplands, the population growth rate must decline first, along with the presence of modern intensive agriculture systems, thereby forming an inverted “U-shape” relationship.
In these three broad stages, the relationship between agricultural land and population growth changes from one stage to another. In the first stage, land use impacts the population with a rising positive growth rate, while in the second stage, population growth influences land use with increasing positive growth in both land and population. Lastly, in the third stage, population growth again influences land use change, but with a declining population growth rate. Specifically, the population growth rate declines faster than agricultural land, as intensification and mechanization occur and the demand for agricultural land and labor diminishes.
Due to data limitations, this study only examined the second and third stages highlighted in the theoretical framework (Fig. 5). As a result, for convenience, the “second and third stages” are referred to as the “first and second phases” throughout the text.
5. Empirical approach
5.1 Hypothesis
Hypothesis 1: Changes in population growth rate would change the agricultural land use share.
Hypothesis 2: Population growth and agricultural land use change have a split relationship, and the effect of population growth rate would be higher in the first phase than in the second phase of “the transition in agricultural land and population growth relationship.”
5.2 Data
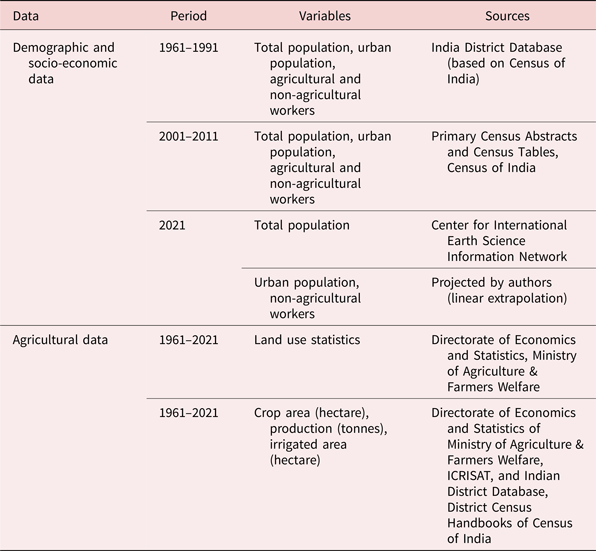
Data for this study have been collected from multiple secondary sources of different time points, which are categorized into two broad sub-sections: socio-economic and demographic data, and agricultural data (Table 1).
Data sources by type of variables

Notes: Reference for data sources are given in section 5.2.
The sources are Primary Census Abstracts and Census Tables of the Census of India (Census of India, 2001, 2011b), India District Database constructed by Vanneman and Barnes (Reference Vanneman and Barnes2000) for district-level socio-economic and demographic data, Gridded Population of the World (GPW) version 4.11 for the year 2020 (Center for International Earth Science Information Network [CIESIN], 2018), Directorate of Economics and Statistics, Ministry of Agriculture & Farmers Welfare (DES, 2023), and District Level Database by ICRISAT (ICRISAT & TCI, Reference ICRISAT2023). Category and period-wise detail data sources are given in Table 1.
5.3 Panel construction
To enhance and establish a relationship among the variables of interest, we have constructed a district-level panel using 267 districts and 7 time points from 1961 to 2021, which accounts for 1869 samples. The base year for the panel data is 1961, the first census year after state (or provincial) boundary reorganization. There were a few changes in district boundaries after 1961, which have been adjusted in the creation of the panel. There were three types of changes in district boundaries: the creation of a new district by merging two or more districts, and also the creation of a new district by bifurcation of an existing district, and the creation of a new district by bifurcation of two or more districts. In the first condition, we used the merged district, and districts before unification were merged to form the panel. We have simply merged the newly created districts with their parent districts for the second condition. In the third situation, we have merged the all-parent districts and the newly created districts altogether to secure the unchanged boundary for this broad merged district.Footnote 4 To do this exercise, we have used the publication by the Census of India (Census of India, 2004, 2011a) and earlier literature (Kumar & Somanathan, Reference Kumar and Somanathan2017; Liu et al., Reference Liu, Shamdasani and Taraz2023). The primary panel consisted of 280 districts with 7 time points. However, in the final analysis, we have considered only major statesFootnote 5 of India, which accounts for 267 consistent districts throughout the panel years from 1961 to 2021.
Census was not conducted in the state of Assam in 1981 and in the state of Jammu & Kashmir in 1991. Values for these two states in particular years are calculated by linear interpolation. For district-level panel data, statistics of the latest available year are considered for 2021. All the data are collected from multiple sources, as mentioned in Table 1.
5.4 Variables
5.4.1 Main variables
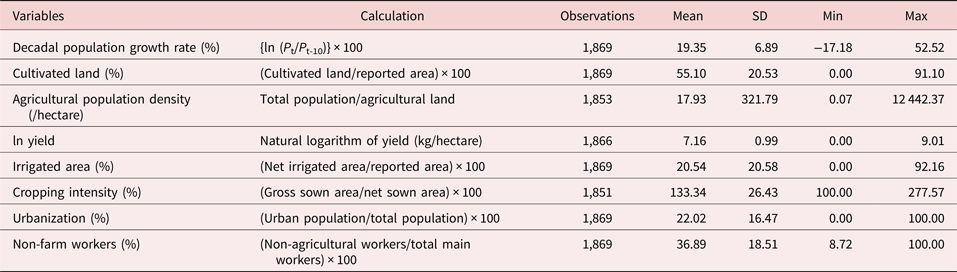
The two key variables of this study are population growth rate (%) and cultivated land (%). The population growth rate is assumed to follow an exponential rate of increase which is why the decadal population growth rate is calculated exponentially.Footnote 6
Land use statistics in India have the 9-fold classification of lands.Footnote 7 We have used cultivated land as one of the major variables. Cultivated land consists of net sown area and current fallow land. The percentage of cultivated land is calculated by dividing the total cultivated land (hectares) by the total reported area (hectares). The reason for selecting cultivated land as the dependent variable is that the area under cultivated land is under continuous use throughout the year, rather than other cultivable areas like “other fallows” (not used for cultivation for 1–5 years) or “culturable waste” (not used for last 5 years or more).
Both population growth rate and cultivated land are alternatively taken as outcome and explanatory variables to understand the bi-directional relationship. But cultivated land as a predictor has no significant results, so we have put the results of models with population growth rate as dependent and cultivated land as independent variables in the appendix section.
5.4.2 Other explanatory variables:
Control variables are the combination of agricultural and socio-economic variables (Table 2), which are the log yield of major crops,Footnote 8 irrigated area out of total reported area (in %), cropping intensity (in %), agricultural population density (persons/hectare of agricultural land), urbanization (in %), and non-farm workers (in %).
Summary statistics of the study variables

Source: Authors' construction.
Notes: ln, natural logarithm; P, population; t, time.
The percentage of agricultural land used is directly influenced by the yield, irrigated area, and cropping intensity within a given district. An increase in irrigation facilities would eventually lead to an expansion of cultivated land. On the other hand, an increase in cropping intensity will increase productivity. As productivity can be affected by other factors (fertilizer, use of tractors, etc.) that are not available at the district level, we directly take the production yield to control those factors as well.
Population density accounts for the pressure of increasing population on land. Agricultural population density has been specifically chosen as this will control for the pressure of population on cultivable areas. Urbanization plays an important role in the development of a country. Urbanization acts as a pull factor for agricultural laborers who would move to urban areas for better job opportunities. The advent of modern agricultural technology leads to job losses among agricultural laborers, compelling them to seek better employment opportunities in urban regions (Boserup, Reference Boserup1965; Coale & Hoover, Reference Coale and Hoover2015; Keyfitz, Reference Keyfitz1992). Additionally, as population growth and land use have a relationship of rural population with land, the variable urbanization will also account for the ruralness of the district. Similarly, the proportion of non-farm workers also reflects the level of reduction in labor dependency in agriculture of a specific area or district. In the absence of the Census for the last year of the panel (2021), we have linearly extrapolated the census variables (urbanization, non-farm workers).
5.4.3 Summary statistics
Summary statistics are given in Table 2. We have calculated the decadal population growth rate from census data for each district. The exponential growth rate formula was implemented to calculate the population growth rate. The mean decadal growth of the population is 19.4% from 1961 to 2021. A few districts also experienced negative growth rates. Cultivated land is the percentage of cultivated area out of the total reported area. The mean area cultivated per district for the study period is 55.1%, with the minimum cultivated area in a district being 0 (especially fully urban districts) to a maximum of 91.1%. The average agricultural population density of Indian districts in the study period is 17.9 persons per hectare of agricultural land. The average yield for major crops in India is 1284 kg per hectare.Footnote 9 The minimum and maximum yield values show that there is heterogeneity in agricultural productivity among Indian districts. The yield of crops has been consistently increasing in India (Fig. 4) over the years. In the case of irrigated areas in districts, there is a huge variation in India from 0 to 92.2% with a mean of 20.5%. The mean value is very low compared to the upper range of distribution. This is due to the lack of irrigation facilities in dry areas and high irrigation density in the north-western states of India. Meanwhile, cropping intensity suggests that multi-cropping is practiced in India in limited areas, with a mean value of 133.3% and a range of 100–277.6%. The average urban population and non-farm workers throughout the study period are 22% and 37%, respectively. Urbanization and non-farm workers vary widely in Indian districts, from fully rural districts to fully urban centers and metropolises. Almost all the described variables except population growth rate and yield have a huge variation throughout the country within the study period. For year-wise summary statistics and box plots of the variables, please see Appendix B.
6. Econometric approach
We employed the following strategies to understand and evaluate our hypothesis of population growth and agricultural land use change. We have taken two major approaches, panel data regression and spatial panel data regression models. They are as follows:
6.1 Dynamic panel data regression model
OLS estimation is inconsistent if an explanatory variable is correlated with an unobserved component of the dependent variable. The main variables of the study, population growth rate and percentage cultivated land can be correlated with various unobserved components. Further, because both the variables have a trend and transitioned in different phases in the study period, a serial correlation problem might affect the OLS or other panel models. Finally, our target is to find whether the change in population growth rate can change the percentage of cultivated land use, thus we are inclined toward the first difference approach rather than other models in panel data models. The basic first difference approach also has the limitations of serial correlation and endogeneity. The dynamic panel data model also uses the first difference approach and considers the unobserved component and serial correlation by using a lagged dependent variable as a regressor in the model and also lagged variables as the instrument for all the variables (Cameron & Trivedi, Reference Cameron and Trivedi2005). Thus, it also incorporates the instrumental variable model as well. In this study, we have used the Arellano–Bover/Blundell–Bond linear dynamic panel data model with a two-step estimator to account for the potential endogeneity issues. In this approach, instead of traditional instruments, lagged variables are used as instruments. The model specification is as follows:

where, cl is the cultivated land (%), gr is the population growth rate (%), θ 0 is an intercept, X is a vector of other explanatory variables, t is the time, n is the number of lags, α, γ, and β are the coefficients.
From the time series figures (Fig. 2) we know that there is a structural discontinuity in both population growth rate and percentage of cultivated land. To assess the period-specific effect, we have applied a segmented regression approach within the dynamic panel model. As our theoretical framework suggests that population growth rate is the determinant for the cultivated land use change, we have divided the population growth rate into two periods (before and after the breakpoint of Fig. 2) to separately observe the effect of population growth on cultivated land in two phases and a separate intercept for the later period has also been added to fulfill the segmented regression conditions.
6.2 Spatial dynamic panel Durbin model
To address the spatial heterogeneity of population growth rate and cultivated land use, which has existed in Indian districts throughout the panel years, we have used the spatial dynamic panel Durbin model with spatial fixed effects. The model is a spatially weighted regression model which consists of both spatial lag and error model characteristics for a panel dataset. Moreover, along with addressing the spatial lagged values of dependent and independent variables, it also accounts for the lagged dependent variable as a separate independent variable. In the given sum, the spatial dynamic panel Durbin model incorporates time and space dependency of dependent and independent variables, as well as both spatial lag and error panel models. Thus, the model simultaneously controls for spatial dependency, spatial heterogeneity, and time dependency in our analysis. In this model, both dependent and independent variables are spatially lagged, and as a consequence, no additional endogeneity problem emerges from the estimation point of view (Arbia et al., Reference Arbia, Espa and Giuliani2021; Belotti et al., Reference Belotti, Hughes and Mortari2017). The model is as follows:

where, cl is the cultivated land (%), X is a vector of explanatory variables including population growth rate, W is the spatial matrix for the autoregressive component, D is the spatial matrix for the spatially lagged independent variables, α i is the individual fixed or random effect, γ t is the time effect, μ it is a normally distributed error term, t is time, n is the number of lags, τ, ψ, ρ, β, and θ are the coefficients. For all the econometric analysis STATA version 16 has been used and maps are created using ArcGIS 10.4.
7. Results
7.1 Trends and heterogeneity pattern in population growth and cultivated land among districts
Using maps, Fig. 6 depicts the district-level decadal population growth rate from 1961 to 2021. From 1961 to 1971 and 1981, all districts' population growth rates increased, even though population growth rates varied by region. Eastern states (West Bengal and Assam) and western India (with an elongated cluster from north to south) had higher population growth rates than other areas in 1961. Population growth rates in all districts were much greater in 1971, 1981, and 1991 as compared to other periods. This surge in population growth was aided by lower mortality in all regions of India following independence. Southern and eastern coastal states began to slow their population growth rate in 1991, with a major decrease in population growth rate beginning in 2001. The population growth rate of Indian districts began to decline from the southernmost states, which were later joined by the eastern coastline states and other southern states, while higher population growth rate regions were pushed toward the north.
District-wise decadal population growth rate, 1961–2021.
Source: Authors' construction.
Note: Maps are not to scale.

Figure 7 depicts maps of the percentage of cultivated land in Indian districts that vary in spatial terms. A substantial proportion (>65% out of the total reported area of the district) of cultivated land in India is concentrated in a few areas, namely the Ganga plain regions, central Maharashtra and northern Karnataka, north-eastern Rajasthan, and Gujarat plains. A moderate proportion of cultivated land (45–65%) is found in southern states, as well as in northern and western Madhya Pradesh. The lowest share of cultivated land within districts are in north and northeastern hilly areas, the central and eastern plateaus, and the western desert areas. The unequal distribution of cultivated land is intricately connected with population density patches in India, and this should have been the primary reason for the early population expansion in highly cultivated areas. The cultivated areas across districts have heterogeneous changes varying over the six decades (1961–2021), ranging from substantial changes in the share of cultivated land area in densely populated districts to negligible changes in sparsely populated districts. However, due to the high spatial variation in cultivated land in Indian districts, it is difficult to depict these changes alongside the spatial variation in these maps. Changes from year to year can be easily captured with a first difference of variables, and the regression results of section 7.3 depict the effect of change in population growth on change in cultivated land use.
District-wise percentage cultivated land, 1961–2021.
Source: Authors' construction.
Note: Maps are not to scale.

7.2 Spatial clustered trends in population growth rate and cultivated land use
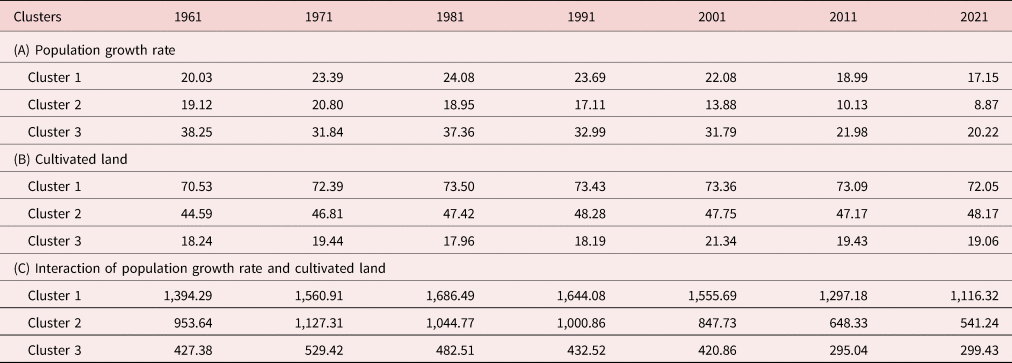
To understand the spatially clustered trends of population growth rate and percentage cultivated land among the districts from 1961 to 2021 we have implemented the K-Means cluster analysis method and classified the population growth rate and cultivated land in three major clusters of districts. We have used GeoDa version 1.2. Table 3 shows the cluster centers for each cluster. All three clusters for each variable can be classified into three categories, i.e., early transition districts, late transition districts, and other extreme value districts. Figure 8 shows the maps for clustered areas for each variable.
Year-wise cluster centers for population growth rate and cultivated land

Source: Authors' construction.
Spatial clusters of population growth rate and percentage cultivated land.
Source: Authors' construction.
Note: Maps are not to scale.

For population growth rate, cluster 1 suggests late transition districts majorly concentrated in India's northern, central, western, and south-central regions (Fig. 8). The population growth rate in these districts increased till 1981 and then fell in 1991 (Table 3). Cluster 2 depicts the early transition districts with growth rates that started declining in 1981, majorly concentrated in India's southern and east coastal states. Cluster 3 of the population growth rate shows districts with a very high rate of growth majorly located in eastern and western borders.
Clusters of percentage cultivated land also show similar trends. Cluster 1 is in India's major agricultural areas, i.e., northern Indo-Gangetic belt, central dry agricultural belt, and western canal irrigation belt (Fig. 8). The region has 70% of land for cultivation on average (Fig. 7). This region's cultivated land percentage increased until 1981, remained unchanged till 1991, and then declined steadily (Table 3, section B). Cluster 2 is concentrated in central and eastern plateau areas and the states of Kerala and Tamil Nadu. Cluster 2 increased until 1991 and then fell since then. Cluster 3 shows the extreme regions with a very low percentage of land for cultivation, mostly located in mountainous and desert areas of the country.
Further, we have used an interacted variable of population growth rate and percentage cultivated land to see the spatial coevolution of these two variables. Cluster 1 depicts the late transition districts, which are majorly concentrated in Indo-Gangetic plains in the north, central dry agricultural areas, and western canal-irrigated agricultural areas. This region has also been documented to have a higher population growth rate. Cluster 2 is concentrated in the southernmost states and eastern and central plateau regions. This region shows early transition districts mostly dominated by population growth rate (Table 3, section A). Cluster 3 is mostly located in mountainous and hilly regions with some scattered areas of plateau regions.
7.3 Dynamic panel regression results
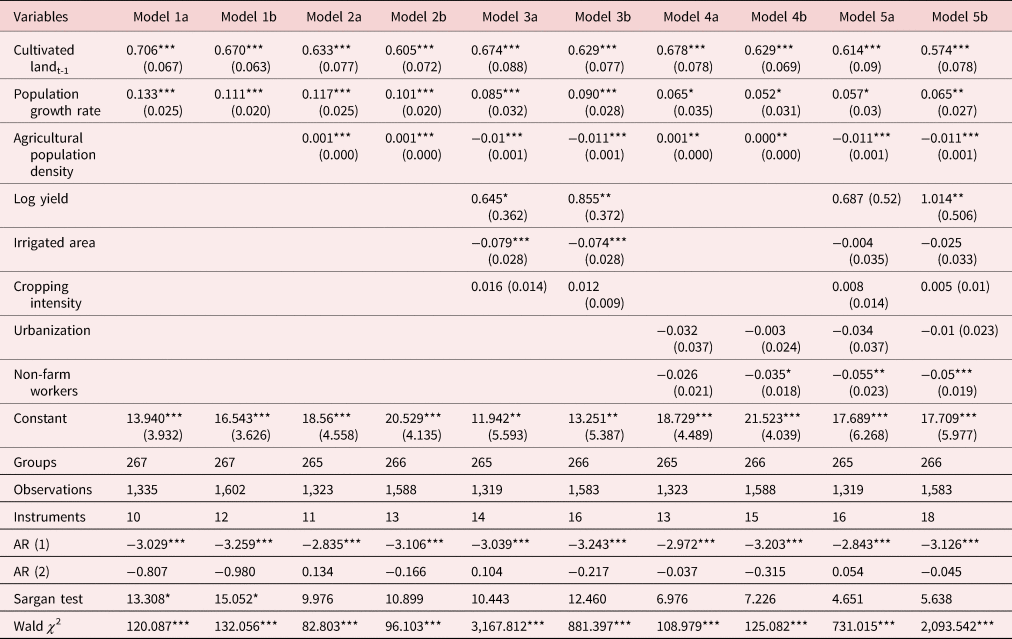
We have applied the Arellano–Bover/Blundell–Bond linear dynamic model with a two-step GMM estimator to our panel data, yielding the results presented in Table 4. The dynamic panel model has the benefit of employing the first differences of variables with lagged dependent variables as an instrument. It operates on the assumption that there is no serial autocorrelation, and it also eliminates the possible endogeneity problem by applying lagged variables as instruments. Considering cultivated land as the dependent variable, Table 4 shows that the increasing population growth rate is significantly affecting the cultivated land even after controlling all other variables. In each of the models from 1 to 6, the “a” indicates panel up to 2011 (which has values based on observed data), and “b” indicates panel up to 2021 (which has two extrapolated variables for 2021). Models are arranged in order of increasing number of explanatory variables to get consistent results.
Results of Arellano–Bover/Blundell–Bond linear dynamic panel regression model showing the effect of population growth rate on cultivated land.

Source: Authors' construction.
Notes: dependent variable: cultivated land (%); ***p < 0.01, **p < 0.05, *p < 0.1; standard errors are in parenthesis.
A lag of the dependent variable has been taken by the models, which find the possible effects of independent variables on the dependent variable after extracting the effects of its own lagged values. In all the models, the population growth rate has significantly affected the cultivated land. In models 1a and 1b, the population growth rate is considered as the sole explanatory variable. From model 2a onwards, we have used the agricultural population density as a covariate which controls for the increasing population pressure on agricultural land. In models 2a and 2b, after controlling for agricultural population density, one unit change in population growth rate would affect the percent cultivated land by 12% and 10%, respectively. After controlling for agricultural variables in models 3a and 3b, one unit change in population growth rate would affect the percent cultivated land by 8.5% and 9%, respectively. Similarly, in models 5a and 5b, after controlling for all variables considered for the study, one unit change in population growth rate would affect cultivated land by 5.7% and 6.5%, respectively. These results signify that an increase in the population growth rate would increase the cultivated land use within a district and vice-versa. As the population growth rate declines in later periods, it has a significant effect on the reduction of cultivated land use. The segmented regression results in the next section more clearly depict this. Apart from population growth, agricultural population density, crop yield, irrigated area, and percentage of non-farm workers are significant determinants of cultivated land use in our models. All the models satisfy the specification tests except for the Sargan test in models 1a and 1b. Both panels “a” and “b” are found similar in most of the models. AR tests show that there is no significant serial correlation in the second order, which is desirable. Sargan test confirms that overidentifying restrictions are valid. We also tested population growth rate as a dependent variable against cultivated land as an explanatory variable to check for a reversal effect but found no evidence of it. These results are included in Appendix C. However, we found that urbanization, education, and log yield are major determinants of the population growth rate in India.
7.4 Dynamic panel regression with segmented regression approach results
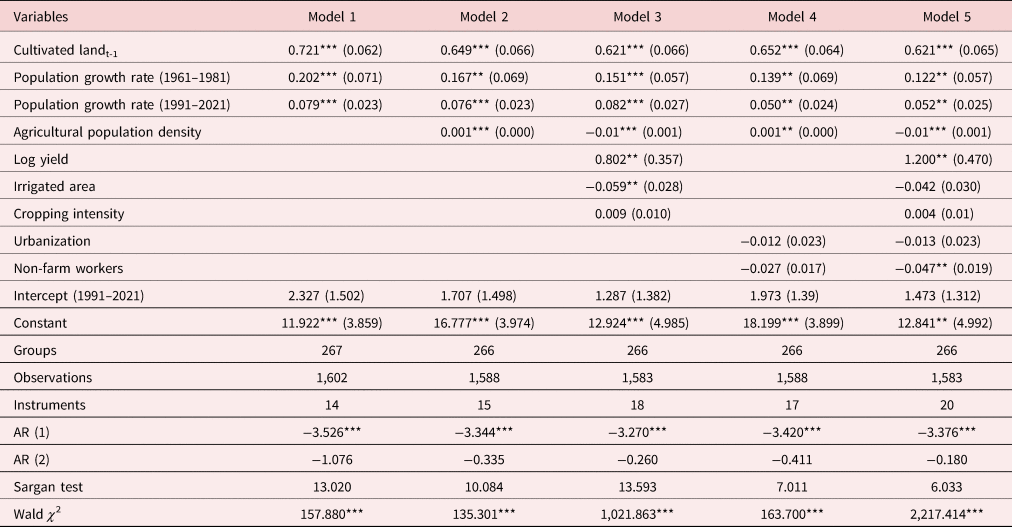
Following the theoretical framework (Fig. 5), the first and second phasesFootnote 10 of the land–population relationship are examined using models 1–5 in Table 5. To get the period-specific effect of the population growth rate on cultivated land, we have used period-specific population growth rates and an additional intercept for the period of 1991–2021Footnote 11 following the segmented regression methods. Here, the population growth rate of the full panel (1961–2021) is segmented into two periods by predicting a breakpoint. The predicted breakpoint was 1981, and two segmented periods are pre-breakpoint (1961–1981) and post-breakpoint (1991–2021). In Table 5, the population growth rate was found to be significantly affecting cultivated land for both periods. In model 1, a unit change in population growth rate would affect the percentage of cultivated land by 20% and 8% for the period 1961–1981 and 1991–2021, respectively. In model 5, after controlling for all the variables, one unit increase in population growth rate would increase the share of cultivated land by 12% between 1961 and 1981, and a unit decline in population growth rate would reduce the percent cultivated land by 5% from 1991 to 2021. AR tests show no second-order correlation and the Sargan test confirms that there is no overidentification by instruments.
Results of split period-wise Arellano–Bover/Blundell–Bond linear dynamic panel regression model showing the effect of population growth rate on cultivated land

Source: Authors' construction.
Notes: dependent variable: cultivated land (%); ***p < 0.01, **p < 0.05, *p < 0.1; standard errors are in parenthesis.
7.5 Robustness checks
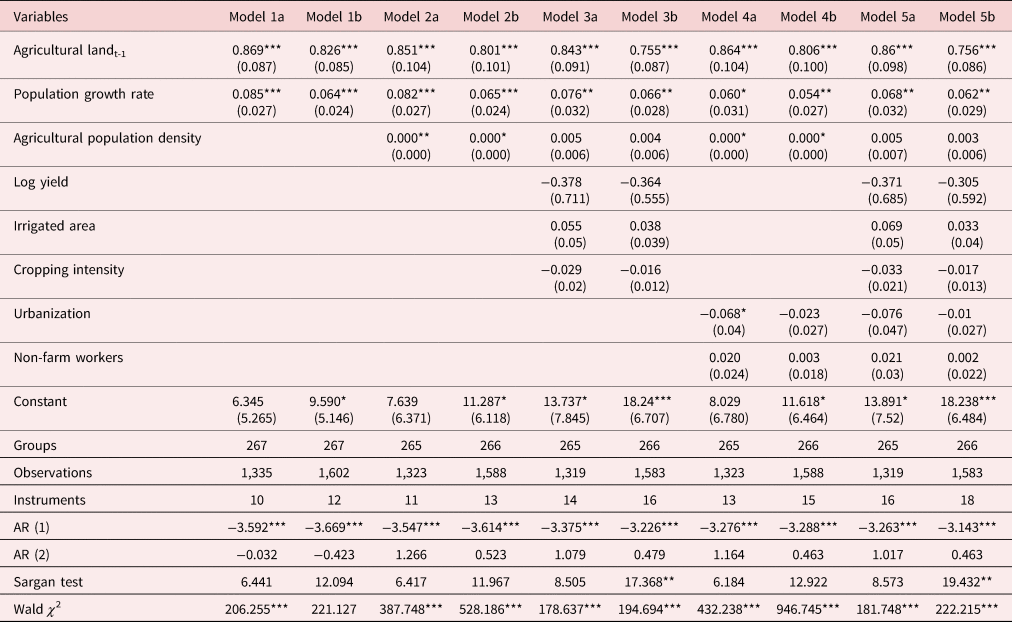
7.5.1 Model estimates with agricultural land as an alternative measure of cultivated land
As an alternative dependent variable for testing robustness, we used the percentage of agricultural land.Footnote 12 In Table 6, models “a” and “b” indicate panels up to 2011 and 2021, respectively. The results indicate that all the models confirm that the population growth rate is significantly affecting the change in the percentage of agricultural land. In final model 5a with panel up to 2011, after controlling all the variables, one-unit shift in population growth rate affects the agricultural land by 7%. All the models have satisfied the AR test specifications and Sargan test validity.
Results of the Arellano–Bover/Blundell–Bond linear dynamic model showing the effect of population growth rate on land using an alternative dependent variable (i.e., agricultural land)

Source: Authors' construction.
Notes: dependent variable: agricultural land (%); ***p < 0.01, **p < 0.05, *p < 0.1; standard errors are in parenthesis.
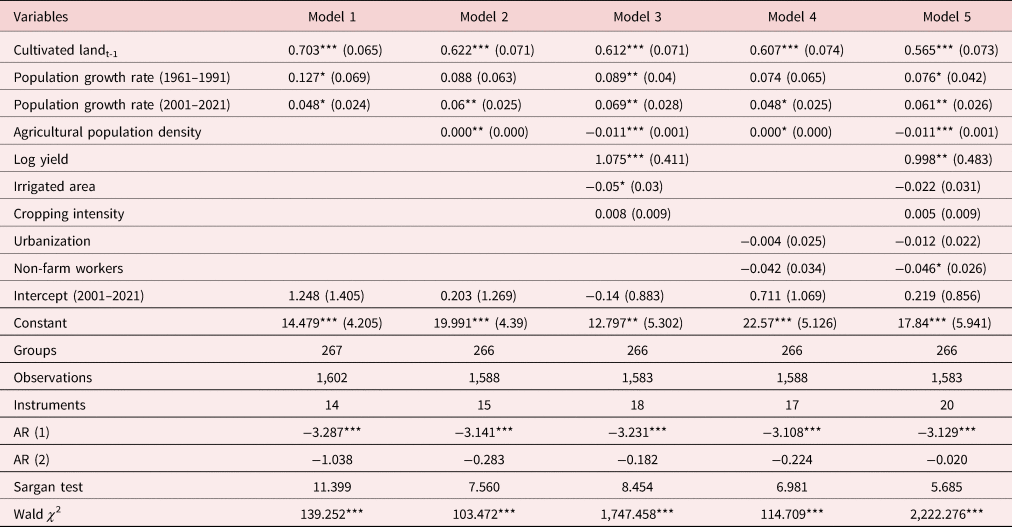
7.5.2 Model estimates with an alternative break point in population growth rates
The trend in cultivated land use reveals that it has been shrinking since 1993 (Fig. 2). To test the validity of our results, we used 1991 as the alternative breakpoint rather than the previously used 1981. In Table 7, the population growth rate has been considered for two separate periods (or phases), i.e., 1961–1991 and 2001–2021. Most of the models of Table 7 show that the population growth rate of both periods is significantly affecting the cultivated land, which is in line with our earlier results. In model 1, one unit change in population growth rate would change the cultivated land by 12.7% and 4.8% for the period 1961–1991 and 2001–2021, respectively. In model 5, after controlling for all the variables, a unit change in population growth rate would affect the cultivated land by 7.6% and 6.1% for the period 1961–1991 and 2001–2021, respectively. It should be noted that the coefficient of the earlier period in Table 7 is lower than the coefficient of the earlier period in Table 5. It is due to spatial heterogeneity in the time of decline in population growth rate. Until 1981 both the population growth rate and cultivated land use increased all over India. However, the decline in population growth rate since 1981 is followed by the decline in cultivated land use since 1991, with a lag of 10 years (see Fig. 2). This lag in decline slightly lowers the coefficient in the earlier phase of Table 7 compared with Table 5. All the models satisfied the specification tests of dynamic panel regressions.
Results of the Arellano–Bover/Blundell–Bond linear dynamic model showing the effect of population growth rate on cultivated land using alternative breakpoints in population growth rate trends

Source: Authors' construction.
Notes: dependent variable: cultivated land (%); ***p < 0.01, **p < 0.05, *p < 0.1; standard errors are in parenthesis.
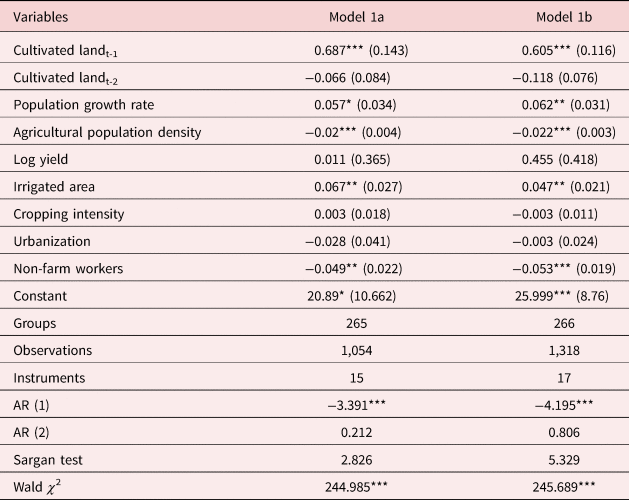
7.5.3 Model estimates with two lags for cultivated land
In Table 8, we used two lags for the dependent variable, i.e., cultivated land, for an additional robustness check of the main results, which used single lag models. The second lag of the dependent variable is not significant here. We have used only the models with all the control variables. In models 1a and 1b, a unit change in population growth rate would affect the cultivated land by 5.7% and 6.2%, respectively.
Results of Arellano–Bover/Blundell–Bond linear dynamic model showing the effect of population growth on cultivated land with two lags of dependent variable

Source: Authors' construction.
Notes: dependent variable: cultivated land (%); ***p < 0.01, **p < 0.05, *p < 0.1; standard errors are in parenthesis.
7.5.4 Spatial dynamic panel Durbin model results
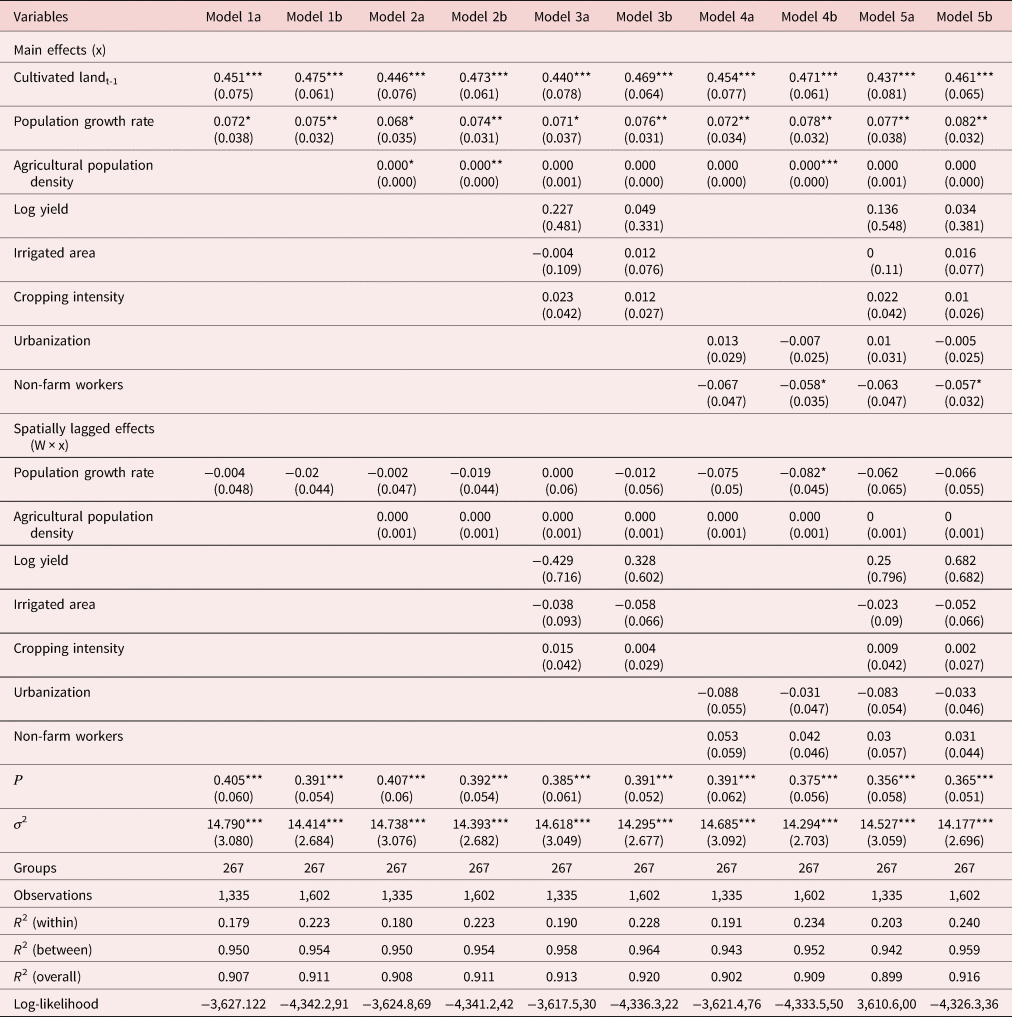
Table 9 depicts the results of the spatial dynamic Durbin model with fixed effects to accommodate both spatially lagged dependency and geographical heterogeneity, along with the possible endogeneity problem in the data. The benefit of employing the spatial dynamic panel Durbin model is it incorporates both spatial and time dependency (lagged values) in the model. The model will help to understand neighborhood effects and district-specific effects (main effect) after controlling for lag values of the dependent variable. In Table 9, “a” indicates panel up to 2011, and “b” indicates panel up to 2021. In models 1a and 1b, one unit change in population growth rate (in main effect) would affect cultivated land by 7.2% and 7.5%, respectively. Similarly, in models 5a and 5b, after controlling for all the variables, a unit change in population growth rate would change the cultivated land (in main effects) by 7.7% and 8.2%, respectively. This indicates that even in the presence of spatial dependency and heterogeneity population growth rate is still influencing the cultivated land use change within any district.
Results of spatial dynamic panel Durbin model showing the effect of population growth rate on cultivated land

Source: Authors' construction.
Notes: dependent variable: cultivated land (%); ρ is coefficients of spatially lagged dependent variables; W is the weight matrix; ***p < 0.01, **p < 0.05, *p < 0.1; robust standard errors are in parenthesis.
7.5.5 Model estimates according to land reform policies of the states
India has observed multiple land reform legislations across states since independence. Land reforms aimed to reallocate the land among different socio-economic groups and enhance the poor's access to land. Situations where cultivators own the land exhibit better performance in terms of agricultural production and investment than conditions where land ownership lies with landlords (Banerjee & Iyer, Reference Banerjee and Iyer2005). Thus, land reform offers ownership of land to more households, thus promoting technological progress in land use as cultivators own and sown the smaller lands which often drive for intensification over extensification. We have used cumulative land reform legislation scores from Besley and Burgess (Reference Besley and Burgess2000) to differentiate land reform states. States that score more than the national score (2.910) are considered land-reformed states and vice versa. Table 10 shows the results of land reform and population growth interactions. In Table 10, “a” indicates panel up to 2011, and “b” indicates panel up to 2021. In both models, irrespective of whether states have experienced “land reforms” or “no land reforms,” the population growth rate significantly influences the percentage of cultivated land. In model 1a, one unit change in population growth rate changed cultivated land by 4.3% and 8.2%, respectively, for states with land reforms and no land reforms. In model 1b, one unit change in population growth rate changed cultivated land by 6.1% and 8.3% for states with land reforms and no land reforms, respectively. Though the effect of the population growth rate for states with no land reforms is slightly higher, in both conditions, it is significantly increasing cultivated land. The AR test and Sargan test show that the models are valid and robust.
Results of the Arellano–Bover/Blundell–Bond linear dynamic model showing the effect of population growth on cultivated land for two groups of states: with land reforms and with no land reforms

Source: Authors' construction.
Notes: dependent variable: cultivated land (%); ***p < 0.01, **p < 0.05, *p < 0.1; standard errors are in parenthesis.
We have also checked the robustness of the results using a full sample with all the districts, which is presented in Appendix D. The results based on the full sample are also in tune with our main findings.
8. Discussion
This study empirically examines the effect of population growth rate on change in cultivated land use by using long-term panel data. The study is both confirmatory as well as exploratory in nature. In particular, this study explored the nature of the relationship between “population and land” at different stages of the demographic and land use transition with our proposed theoretical framework (section 4). The study successfully tested two hypotheses: (1) the increase in population growth leading to expansion of cropland in the absence of agricultural technology and crop intensification, and (2) the relationship between “population growth” and “the size of cropland” pose a split relationship subject to change in agricultural technology and crop intensification. Besides robust econometric approaches such as dynamic panel data regression models, the evidence put out in this study is also validated using the spatial dynamic panel Durbin model, identifying spatial clusters and several robustness checks. The study also tested the heterogeneity of the findings by land policy environment and reforms across the states of India. The discussion of key findings of the study in the context of existing literature is organized as follows:
(a) The rise in population growth rate had a significant effect on the expansion of cultivated land
The first key finding of the study is the expansion of cultivated land was mostly affected by the increase in the pace of population growth. The demography history since Malthusian days has hinted that population growth is the primary reason for expanding cultivation of agricultural land, although Marxian theorists pose population expansion as being a result of the agricultural revolution (Birdsall et al., Reference Birdsall, Kelley and Sinding2001; Boserup, Reference Boserup1965). Although contemporary evidence suggests that under demographic transition, the population growth rate eventually increases and decreases with various behavioral and developmental changes in society, its links with agricultural land are not widely documented (Arizpe et al., Reference Arizpe, Stone, Major and Stone2019; Bongaarts, Reference Bongaarts2023). In this context, this study documents robust empirical evidence on the effect of population growth rate on the expansion of cultivated land. The evidence documented in this study is in line with the limited existing studies in the global and other developing country contexts. Most of the existing studies have fostered that the decrease in population growth rate is attributed to socio-economic development, while the reduction in cultivated land use is contingent upon a prior decline in population growth rate, even in the presence of agricultural technology (Ramankutty et al., Reference Ramankutty, Mehrabi, Waha, Jarvis, Kremen, Herrero and Rieseberg2018).
(b) The population growth rate poses a split association with cultivated land from 1961 to 2021
The second important finding of this study is that the population growth rate poses a split relation with cultivated land from 1961 to 2021. Our segmented regression models provide significant results for both phases: in the first phase, the effect of population growth rate was higher than in the second phase, which supports our second hypothesis, and findings are in tune with previous literature (Bilsborrow & Okoth Ogendo, Reference Bilsborrow and Okoth Ogendo1992; Mishra, Reference Mishra2002). Our results also explain that the declining population growth rate in the second stage also affects cultivated land use positively. This implies that in the initial phase, a rapidly increasing “population growth rate” contributes to the increase in population size (and density), prompting a corresponding expansion in agricultural land utilization and agricultural intensification. However, in the subsequent phase, as the “population growth rate” experiences a gradual decline (while remaining positive), population size and density continue to grow at a slow pace. During this period, the “rate of growth in agricultural intensification” surpasses the “rate of population growth”Footnote 13 which enables agricultural technology to effectively support food security without expanding agricultural land (Ausubel et al., Reference Ausubel, Wernick and Waggoner2013). Consequently, agricultural land expansion ceases and begins to contract with the rise and fall in population growth rates from 1961 to 2021, with a predicted breakpoint in 1981. India's highest recorded population growth rate was in 1971 (2.22% per year), but it remained unchanged until 1981 (2.20% per year), then it began to decline. Following a lag of roughly ten years, the percentage of cultivated land began to decline in the 1990s. Before 1981, the Indian population growth not only increased farmland but also worked as a catalyst for a major shift in agricultural technology via the Green Revolution (Ausubel et al., Reference Ausubel, Wernick and Waggoner2013; Dyson, Reference Dyson2018; Goli & Arokiasamy, Reference Goli and Arokiasamy2013). Even in this phase of agricultural technology development, these findings support the hypothesis that a decrease in the rate of population growth rate precedes and is a necessary condition for a decrease in land used for agriculture. Further, the findings foster an “inverted U-shaped” relationship between population growth rate and agricultural land use in India.
(c) The sustainability of the population and environment is a prerequisite for a decline in population growth and cropland and the rise of ecologically friendly agricultural intensification and productivity
The third key finding is the mediating role of crop intensification and productivity guiding the relationship between population growth rate and cultivated land expansion. The findings assert that the role of population growth weakens on expanding cultivated land with increasing agriculture intensification and rise in productivity. These findings assume importance in the context of existing evidence that any population's food security and sustainability can be achieved by increasing agricultural productivity by using modern green farm technology, rather than expanding land usage (Ausubel et al., Reference Ausubel, Wernick and Waggoner2013; Barretto et al., Reference Barretto, Berndes, Sparovek and Wirsenius2013). This is because the rate of increase in “agricultural intensification or productivity” must be higher than the “rate of population growth” (Appendix E) for population sustainability (Bilsborrow, Reference Bilsborrow, Hunter, Gray and Véron2022; Lam, Reference Lam2011, Reference Lam2023). Thus, we can infer from the findings of the present study that the rise in ecologically friendly agricultural intensification and rise in productivity for population sustainability is the key implication advancing out of this study. Moreover, as the population growth rate in India declines (James & Goli, Reference James and Goli2016), it creates an opportunity for a reduction in cultivated land.
(d) Other findings: expansion of urbanization and non-firm sectors and decline in population growth and cropland
In developed countries where food security is not a major problem, the use of agricultural land is reducing due to an increase in agricultural productivity, conversion of cropland to forest areas, and urbanization (Ewers et al., Reference Ewers, Scharlemann, Balmford and Green2009; Sali, Reference Sali2012). Although the context of a developed country cannot be strictly compared to that of developing countries, these factors are also true for countries that are rapidly developing, such as India. Thus, we are advancing an additional significant finding from this study that the expansion of education and urbanization, which expands the non-farm works, helps in the decline of population growth rate and thereby cultivated land; though urbanization contributes to a significant reduction in croplands (Del Mar López et al., Reference Del Mar López, Aide and Thomlinson2001; Van Vliet et al., Reference Van Vliet, Eitelberg and Verburg2017). Also, with the reduction in agricultural land in the country due to increasing agricultural productivity, forest cover increases by reserving cropland for forest, thus contributing to environmental sustainability (Lambin & Meyfroidt, Reference Lambin and Meyfroidt2011). Furthermore, urbanization, education, and the non-form sector contribute to economic development, thereby helping in controlling population growth as well. The existing evidence also suggests that originally, an expanding population heralded economic development (Coale & Hoover, Reference Coale and Hoover2015), but later stages of this economic development rescued the population from the “Malthusian Catastrophe” by sustaining agricultural productivity as well as lowering population growth rate in India, which in turn lowers the expansion of agricultural land (Ewers et al., Reference Ewers, Scharlemann, Balmford and Green2009; Lambin & Meyfroidt, Reference Lambin and Meyfroidt2011; Liu et al., Reference Liu, Song, Yokogawa and Qu2008; Manoharan & Varkey, Reference Manoharan and Varkey2022; Sali, Reference Sali2012).
(e) Validation of the findings in the context of existing theoretical arguments
The above findings can be placed in the existing classical arguments from Boserup and Malthus. Boserupian perspective is generally concerned with scenarios of expanding population to cause the intensification of agriculture with limited land availability, but in the present study, lowering the population growth rate alleviates population pressure in the long run, which reduces the use of agricultural land. Furthermore, a growth in population density (along with population size) would stimulate more labor-intensive farming practices, and the introduction of new farm technologies might help to support the rising population while also easing the shift of agricultural laborers to other sectors. Labor shifts from agriculture to industries would also aid agriculture by increasing the manufacturing of modern tools for cultivation (Boserup, Reference Boserup1965, Reference Boserup1981). The declining population growth rate, along with access to modern farming technology, increases productivity and crop intensification, thus reducing cultivated land. However, it cannot be concluded that population growth acted as an impetus, as Boserup claimed, even though it is the primary cause of the green revolution.
In this scenario, both Malthusian and Boserupian perspectives acted independently. In the mid-1960s, India experienced severe food shortages due to a series of famine years. Despite this fact, the 1971 Census results show that the famine did not affect population growth (Dyson, Reference Dyson2018). However, it raised the risk of starvation. It should be noted that the origins of the 1960s famines were caused by climatic variations in the country, such as drought, not by population explosion. Yet this raised concerns about probable future famines that would have a serious impact on the population (Dasgupta, Reference Dasgupta1977). This terrifying threat to the population functioned as a Boserupian stimulant, introducing high-yielding seeds from Mexico and necessary changes in infrastructure like irrigation, fertilizer use, agricultural research, etc. Thus, the Malthusian vision of disaster through food scarcity served as a push factor in the Indian setting to develop new farm technology for population sustainability (due to high population expansion), but technological intervention, as viewed by Boserup, did not let the population be starved. Both the Malthusian–Boserupian postulations acted as feedback mechanisms to each other. The modern population and land use debate is beyond their postulations (Bilsborrow, Reference Bilsborrow1987; Codjoe & Bilsborrow, Reference Codjoe and Bilsborrow2011; Turner & Ali, Reference Turner and Ali1996). There are several studies which concluded that intensification did happen in India due to population pressure (Bilsborrow, Reference Bilsborrow, Hunter, Gray and Véron2022; Lam, Reference Lam2011; Mishra, Reference Mishra2002), and our study further extends this debate on how population growth reduction with intensive agricultural practice could reduce the use of croplands.
9. Conclusions and policy implications
In conclusion, we state that using long-term panel data and robust econometric tools the study found population growth was one of the dominant drivers driving the usage of cultivated land throughout the last 70 years of India's demographic and economic history. However, the influence of population growth on cultivated land consumption is not static; in India, two distinct phases of this relationship exist. The phases separated around the 1980s with the onset of a declining population growth rate in the country. In the first phase, a rapidly increasing population growth rate drives the expansion of cultivated land with the least use of agricultural technology and crop intensification, while the declining population growth rate in the second phase insists the use of cultivated land declined, with the help of introduction of modern farm technology, rise in crop intensification and productivity, albeit slowly. It can be argued that while the Malthusian catastrophe arrived indirectly in the mid-1960s in India as a threat of famine and food shortage, these concerns were resolved by technological advancements in agriculture and a rise in productivity, as Boserup perceived. Though there are some intermittent influences, such as a drop in the population growth rate due to socioeconomic development and a rise in the non-farm sector, the population growth rate remains the most important factor influencing changes in cultivated land usage in India.
From a population, agricultural land, and environmental policy point of view, the study advances that the uncontrolled expansion of agricultural land has been putting huge carbon footprints in the country, akin to what has been observed globally. The food-producing industry causes 25% of the greenhouse gas emissions in the world, and out of this, half of food emissions come from land usage and crop production (Ritchie, Reference Ritchie2019). Thus, a reduction in population growth rate in high fertility states, along with the rise in ecologically friendly agricultural intensification and productivity, helps in population and environmental sustainability in the country. The finding assumes more importance in the Indian context, where the country has poor adaptive capacities to environmental hazards. The country is also not at the forefront in terms of adopting green and organic farming technologies and protecting ecological balances. Finally, we advance that population stabilization coupled with a reduction in the expansion of cultivated land and unsustainable agricultural practices contributes to sustainable development in most populous countries of the world.
Supplementary material
The supplementary material for this article can be found at https://doi.org/10.1017/dem.2024.20.
Acknowledgements
We are grateful and indebted to Maggie Liu, Yogita Shamdasani, and Vis Taraz for providing the district-level census data of the earlier censuses with us. We are also grateful to Professor Christophe Z. Guilmoto and Professor K. S. James for sharing their views and insightful comments on this study. We are thankful for the comments received at the European Population Conference 2024 and the Australian Health Economics Society Conference 2024, which helped us to improve our work further. Finally, we also thank two anonymous reviewers and Professor Jeanne Lafortune [the editor, JODE], whose comments helped significantly strengthen the manuscript.
Abbreviations
ICRISAT: International Crops Research Institute for the Semi-Arid Tropics; NAS: National Academy of Sciences; OLS: Ordinary Least Square