

Historical texts recorded on carved stone monuments including stelae, altar stones, and other types of dedicatory objects have played a central role in the study of the ancient Maya. Few studies, however, have incorporated geospatial information and epigraphic datasets to examine patterns in the rise and fall of Classic period (a.d. 250–900) Maya society. This study examines the relationship between the last, or terminal, dates recorded on stone monuments at Classic period Maya sites and their spatial distribution. Building on five previous studies, Geographic Information Systems (GIS) and spatial statistics are used to look for regional patterns in the abandonment of this tradition. Cessation of monument erection and inscription is used as a proxy for the decline of divine kingship and authority, or “collapse,” in the Maya lowlands. The Goodman-Martínez-Thompson (GMT) correlation between the Maya and Gregorian calendar is now confirmed (Kennett et al. Reference Kennett, Hajdas, Culleton, Belmecheri, Martin, Neff, Awe, Graham, Freeman, Newsom, Lentz, Anselmetti, Robinson, Marwan, Southon, Hodell and Haug2013) and we can confidently compare these spatial patterns to independently radiocarbon dated archaeological datasets from the Late and Terminal Classic periods (a.d. 700–900) in areas with observed subregional patterning. These data will help constrain regional models of sociopolitical disintegration in the Maya lowlands and will contribute to an understanding of the ways that societies, including our own, develop and cope in response to changing economic, environmental, and climatic conditions.
Ancient Maya epigraphic inscriptions focus typically on the lives and acts of the Maya elite and have been interpreted as evidence for institutionalized leadership and Classic Maya divine kingship (Martin and Grube Reference Martin and Grube2008). The lowland Maya tradition of dedicating stone monuments associated with elite offices and status began first in the Late Preclassic (Estrada-Belli Reference Estrada-Belli2011; Justeson Reference Justeson1986) as monument production increased dramatically throughout the Classic period (Lowe Reference Lowe1985; Macri and Looper Reference Macri and Looper1991–2014; Martin and Grube Reference Martin and Grube2008). Major advances in our understanding of Maya hieroglyphs over the last 50 years have revealed the political and dynastic histories of the largest Maya centers. These intricate texts include records of births, deaths, marriages, succession, political alliances, and warfare. Martin and Grube (Reference Martin and Grube2008), for example, have reconstructed complex political hierarchies and elite genealogical networks that existed in the lowlands during the Classic period using textual information primarily from carved, dated monuments. The age of many Classic period texts can be determined when long count dedicatory dates were also recorded. Taken together, historical records and accompanying calendar dates on stelae provide one approach for empirically examining spatial and temporal patterns during the development and disintegration of Classic Maya political systems (Mathews Reference Mathews and Culbert1991; Munson and Macri Reference Munson and Macri2009).
The failure of Classic period political systems between a.d. 730 and 900 has been a topic of interest to archaeologists for many years, receiving focused study since the publication of Culbert's (Reference Culbert1973) edited volume The Classic Maya Collapse. Diamond's (Reference Diamond2004) book entitled Collapse: How Societies Choose to Fail or Succeed brought wide public exposure to the ancient Maya, as well as scrutiny from archaeologists for its overly simplified views (McAnany and Yoffee Reference McAnany and Yoffee2009). The complex processes involved in the disintegration of Classic Maya polities were at once social, economic, political, and ideological and are glossed only crudely by the term “collapse.” The topic remains an active area of research and debate (for recent major overviews see Aimers [Reference Aimers2007], Demarest et al. [Reference Demarest, Rice and Rice2004], and Webster [Reference Webster2002]). For the purposes of this paper we define “collapse” as the disintegration of a distinct set of political institutions and economic relationships centered upon divine kings, described in hieroglyphic texts as Ajaw. This form of political leadership is a defining feature of Classic Maya society and is characterized by highly networked lineages of paramount elites who ruled individual polities by self-proclaimed divine authority. Evidence of this form of political organization includes the public display of carved monuments with texts attesting to the exploits and authority of these divine kings and their attendants, construction of monumental ceremonial architecture, and conspicuous consumption of status-enhancing prestige goods (Houston and Stuart Reference Houston and Stuart1996; Martin and Grube Reference Martin and Grube2008). This institutional form of rulership was replicated at over 100 relatively autonomous polities across the southern lowlands (Schele and Freidel Reference Schele and Freidel1990).
The “collapse,” then, is the disintegration of traditions associated with the Ajaw form of rulership as evidenced by the abandonment of public political and ceremonial spaces, disruptions in the trade and consumption of prestige goods, and a cessation in the dedication of stone monuments during the eighth and ninth centuries a.d. This latter feature—the end of dated stela production—gives us an accessible marker for the disintegration of Classic political dynasties at many sites in the lowlands. Accompanying this political disintegration was a decentralization of political and economic systems, abandonment and depopulation of several urban centers, and the disappearance of writing on stone monuments and the media that recorded elite dynastic histories (though written documents persist into the Postclassic period after a.d. 900). The Maya collapse was not a uniform or homogenous event that affected all polities equally, but a complex process that unfolded over generations and resulted in the end of divine kingship at multiple centers in the lowlands between a.d. 750 and 910. Political development of Maya-speaking people was then refocused northward to a small number of centers on the Yucatan peninsula that ultimately declined between a.d. 1000 and 1100 (for example, Chichen Itza [Aimers Reference Aimers2007]). The population history for most of these centers is unclear, but there is evidence for relatively abrupt depopulation of some sites (for example, Uxbenka [Culleton et al. Reference Culleton, Prufer and Kennett2012; Walsh et al. Reference Walsh, Prufer, Culleton and Kennett2014]) and persistence of both elite and commoner groups at others (for example, Copan [Webster et al. Reference Webster, Freter, Storey, Demarest, Rice and Rice2004], the Peten lakes [Rice and Rice Reference Rice, Rice, Demarest, Rice and Rice2004]), at least until a.d. 1000–1100 (Aimers Reference Aimers2007).
The collapse has been variously attributed to climatic perturbations (Beach et al. Reference Beach, Luzzadder-Beach, Dunning, Jones, Lohse, Guderjan, Bozarth, Millspaugh and Bhattacharya2009; Curtis et al. Reference Curtis, Hodell and Brenner1996; Gill Reference Gill2000; Haug et al. Reference Haug, Günther, Peterson, Sigman, Hughen and Aeschlimann2003; Hodell et al. Reference Hodell, Brenner and Curtis2005, Reference Hodell, Brenner and Curtis2007; Iannone Reference Iannone2014; Me-bar and Valdez Reference Me-Bar and Valdez2003; Medina-Elizalde and Rohling Reference Medina-Elizalde and Rohling2012; Rosenmeier et al. Reference Rosenmeier, Hodell, Brenner, Curtis and Guilderson2002; Webster et al. Reference Webster, Brook, Railsback, Cheng, Edwards, Alexander and Reeder2007), warfare (Inomata Reference Inomata1997, Reference Inomata2008; Inomata and Webb Reference Inomata and Webb2003; Webster Reference Webster2000), resource exhaustion (Dunning et al. Reference Dunning, Beach and Rue1997, Reference Dunning, Beach, Farrell and Luzzadder-Beach1998; Oglesby et al. Reference Oglesby, Sever, Saturno, Erickson and Srikishen2010; Shaw Reference Shaw2003; Turner and Sabloff Reference Turner and Sabloff2012), disease (Acuña-Soto et al. Reference Acuña-Soto, Stahle, Therrell, Gómez Chávez and Cleaveland2005), failure of elite governance (Demarest Reference Demarest and Iannone2014; Demarest et al. Reference Demarest, Rice and Rice2004; Hamblin and Pitcher Reference Hamblin and Pitcher1980; Lowe Reference Lowe1982), or some combination of climate change, environmental degradation, warfare, and failed governance (Aimers Reference Aimers2007; Aimers and Iannone Reference Aimers, Iannone and Iannone2014; Demarest et al. Reference Demarest, Rice and Rice2004; Dunning et al. Reference Dunning, Beach and Luzzadder-Beach2012; Iannone Reference Iannone2014; Kennett and Beach Reference Kennett, Hajdas, Culleton, Belmecheri, Martin, Neff, Awe, Graham, Freeman, Newsom, Lentz, Anselmetti, Robinson, Marwan, Southon, Hodell and Haug2013; Kennett et al. Reference Kennett, Breitenbach, Aquino, Asmerom, Awe, Baldini, Bartlein, Culleton, Ebert, Jazwa, Macri, Marwan, Polyak, Prufer, Ridley, Sodemann, Winterhalder and Haug2012; Webster Reference Webster2002). In this paper we do not focus specifically on the cause(s) of collapse. Instead our goal is to look at the spatial and temporal pattern of abandonment of writing on carved monuments as one proxy for exploring the failure of the Ajaw system across the lowlands. These data can be combined with regionally specific archaeological datasets to test more complex models of political, social, economic, and demographic collapse in the Maya lowlands.
Central to this study is constructing an accurate spatial chronology. We consider the final dedicatory dates, or terminal long count dates, on carved monuments as a proxy for the declining influence or possible removal of the divine king at each center. Terminal long count dates refer to the final known date associated with a carved stone monument or other dedicatory object at a site that can be correlated with the Gregorian calendar. We take the cessation of dated monuments to represent an irreversible decline in political and economic networks and a general disintegration of the polity. Given the vagaries of the archaeological record we recognize that these are only approximate end dates and that additional archaeological work combined with decipherment will inevitably lead to more refined local chronologies. Terminal monument dates for centers that have received focused archaeological and epigraphic work (for example, Tikal and Copan) will likely be more accurate compared to centers that have received less attention, have a small number of monuments, or have monuments carved from stone more susceptible to erosion (for example, Calakmul [Martin and Grube Reference Martin and Grube2008]).
Previous efforts to use Maya long count calendar dates to characterize the timing of political collapse concentrated on statistical analyses of dates from epigraphic sources and the search for broad spatial trends (Bove Reference Bove1981; Hamblin and Pitcher Reference Hamblin and Pitcher1980; Kvamme Reference Kvamme1990; Neiman Reference Neiman, Barton and Clark1997; Premo Reference Premo2004; Whitley and Clark Reference Whitley and Clark1985; Williams Reference Williams1993). They suggest that the disintegration of Maya polities occurred either in a southwest-to-northeast trajectory in a relatively abrupt manner (Bove Reference Bove1981; Kvamme Reference Kvamme1990) or outward from core areas in the central Peten region of Guatemala (Neiman Reference Neiman, Barton and Clark1997). We reevaluate these previous studies with a larger updated dataset of 89 terminal monument dates integrated into a GIS database (Figure 1). We address two central questions. First, do terminal long count dates found on inscribed monuments exhibit broad-scale spatiotemporal patterning? Some studies have suggested spatial patterning, but others indicate that no meaningful spatial trends can be identified from terminal long count dates (Premo Reference Premo2004; Whitley and Clark Reference Whitley and Clark1985). The second question is whether regional and sub-regional spatiotemporal patterns indicating polity disintegration can be determined. Archaeologists working in different parts of the Maya lowlands have identified regionally specific differences in warfare, ecological degradation, and depopulation, sometimes in the context of changing environmental and climatic conditions from a.d. 730–910 during the Terminal Classic period (Aimers Reference Aimers2007; Demarest et al. Reference Demarest, Rice and Rice2004; Hodell et al. Reference Hodell, Curtis and Brenner1995; Kennett and Beach Reference Kennett, Hajdas, Culleton, Belmecheri, Martin, Neff, Awe, Graham, Freeman, Newsom, Lentz, Anselmetti, Robinson, Marwan, Southon, Hodell and Haug2013; Webster Reference Webster2000). We compare our analyses to independent, published archaeological data from the Usumacinta-Pasión region, central Peten, and from southern Belize to demonstrate how regionally specific analyses may help clarify the relationships between archaeological and epigraphic observations.
Map of Maya lowlands, with 89 sites used in this study shown. Numbered sites correspond to Table 1.

DISINTIGREATION OF MAYA POLITIES AND SPATIAL ANALYSIS OF DATED MONUMENTS
Mayan speaking peoples (except for Huastec, spoken in San Luis Potosí and northern Veracruz) have traditionally occupied the tropics of Mesoamerica from the highland mountain ranges of southern Chiapas and Guatemala north into the lowland portions of western Honduras, El Salvador, Belize, and the Yucatan Peninsula in modern day Mexico. During the Early and Late Classic periods most urban populations were concentrated in the tropical southern lowlands, though important polities also flourished in the Puuc and Chichen regions of the northern lowlands. Maya households were integrated into communities of various sizes and political influence, many of which were incorporated into larger polities concentrated around civic-ceremonial centers (for example., Tikal, Calakmul, Caracol, and Copan). Many centers were associated with the rule of a k'uhul ajaw, or a dynastic “divine king,” whose network associations and personal achievements were recorded on carved stone monuments. Archaeologists traditionally define the Classic period by the presence of monumental art and architecture, writing, advanced mathematics and calendar systems, all of which were sponsored by the k'uhul ajaw (Marcus Reference Marcus2003). During the end of the Late Classic period, approximately a.d. 790, these traits began to decline and with them the power and authority of the divine kings (Lowe Reference Lowe1985). Starting at a.d. 830, a decrease in the number of dedicated monuments is noted (Lowe Reference Lowe1985; Macri and Looper Reference Macri and Looper1991–2014) which may be associated with the depopulation of major centers in the lowlands. The date a.d. 889 was recorded at only four sites throughout the lowlands. The last long count date in the southern lowlands, a.d. 910 at Itzimte, marks the end of the monument dedication tradition.
Multiple studies have examined the spatial distribution of terminal long count dates and geographic trends in the decrease of monument dedication at Classic period polities. Hamblin and Pitcher (Reference Hamblin and Pitcher1980) first used the presence of monuments with long count dates to quantify the Classic period span of occupation of Maya sites and estimate their collapse. They hypothesized that the disappearance of dated monuments at a site represented a period of class conflict that saw the end of elite rule. A general pattern of decline in the monument dating over time began first on the periphery of the lowlands and developed later in the central areas of the Peten (Hamblin and Pitcher Reference Hamblin and Pitcher1980:257–258). Bove (Reference Bove1981) used spatial analyses to examine terminal dates at 47 sites from the central Peten region. He argued that the spatial distribution of terminal dates shows a southwest-to-northeast trend and that clusters of terminal dates can be identified within the broader study area, though he did not elaborate on this latter finding. Whitley and Clark (Reference Whitley and Clark1985) analyzed the same dataset using global spatial autocorrelation and Moran's I to discern the visual patterns in the dataset. Moran's I measures features and associated attributes to evaluate whether the pattern observed is clustered, dispersed, or random (Moran Reference Moran1950). If the patterning is not random, a positive Moran's I value indicates a tendency toward clustering. A negative Moran's I value indicates a tendency toward dispersion. Finding no recognizable spatial pattern in the data, Whitley and Clark challenged Bove's original conclusions. Kvamme (Reference Kvamme1990) revisited the issue using spatial autocorrelation, this time employing a distance-based version of Moran's I. He suggested that Whitley and Clark's failure to recognize spatial trends was due to limitations of their methodology. Kvamme's (Reference Kvamme1990) spatial autocorrelation statistically supported the interpretation that terminal dates have a strong spatial correlation, and showed that similar dates co-occur and are not randomly distributed.
Two other studies examined spatial distributions of terminal long count dates. Neiman (Reference Neiman, Barton and Clark1997) posited that inscribed monuments functioned as a form of costly signaling among Maya leaders, and that the cessation of production was an indicator of political collapse. Neiman used a global trend surface analysis with local robust regression (loess) for 69 terminal long count dates derived from previous studies augmented with additional data from the Peten region. His analyses assumed that elites were distributed evenly across the Maya lowlands (Neiman Reference Neiman, Barton and Clark1997:272) and he argued that fitted dates estimated using a local regression model provided a reliable estimate of spatial trends. Neiman's results suggested that the latest terminal dates were located in the periphery of the Maya region and that the earliest were located in the central Peten lowlands of Guatemala. In other words, polities did not collapse from southwest to northeast, but crumbled outwards from the core to the periphery (Neiman Reference Neiman, Barton and Clark1997), opposite to the pattern described by Hamblin and Pitcher (Reference Hamblin and Pitcher1980). Neiman argued that ecological disasters, namely drought, led to deteriorating soil conditions, and that this was particularly disastrous in areas accustomed to high rainfall.
Premo (Reference Premo2004) presents the most recent statistical assessment of terminal long count dates as a proxy for political failure across the Maya lowlands during the Terminal Classic period. He suggested that analyses focused on regional trends are better suited to investigate the collapse because individual Maya polities existed in specific biophysical spheres and interacted in regional and subregional sociopolitical systems. He introduced the Getis-Ord G statistic to complement Moran's I in examining spatial trends at a regional scale (Premo Reference Premo2004:857). In his re-evaluation of Bove's (Reference Bove1981) dataset, Premo noted two localized clusters of terminal dates, one in the central Peten and the other in Usumacinta-Pasión region. In his concluding remarks, Premo highlighted the developing potential of GIS or similar types of spatial analyses for interpreting archaeological data. We build upon Premos's work by establishing a more comprehensive GIS database of terminal long count dates in the Maya lowlands and replicating his and other's statistical work within this GIS framework to test hypotheses about spatial trends in the data.
Spatial Analyses: Nearest Neighbor, Local Moran's I and Getis-Ord G Statistic
We adopt Premo's statistical approach and employ spatial autocorrelation, both Moran's I and the localized Getis-Ord G statistic, and couple this with Nearest Neighbor (NN) analyses to reevaluate spatial trends in terminal monument dates within the framework of a GIS. NN resampling is a technique that examines discrete (that is, categorical, in this case temporal) spatial datasets, testing the null hypothesis that, all things being equal, features—in our case terminal monument dates, with each site representing a single terminal date—will be randomly distributed across a two-dimensional surface (Clark and Evans Reference Clark and Evans1954; Dacey Reference Dacey1963; Wilson and Melnick Reference Wilson and Melnick1990). To evaluate this hypothesis, NN measures the distance from the center of a feature, in this case a point representing a site, to the center of its nearest neighbor. The result is expressed as an indexed score, established by measuring the linear distance between every data point and its nearest-neighbor and dividing the mean of observed distances (d obs) by the expected mean distances (d ran) between the same number of randomly distributed points. The value of the d ran is one-half the square root of the study area's size (α), divided by the number of points (n) (Clark and Evans Reference Clark and Evans1954; Diggle Reference Diggle1983; Durand and Pippin Reference Durand and Pippin1992):
 $$NN = \displaystyle{{{d_{obs}}} \over {0.5\sqrt {\alpha /n} }}$$
NN index values of less than 1.00 are designated as clustered, values greater than 1.00 dispersed, and values near 1.00 are considered to have random distributions (Morgan Reference Morgan2009; Wilson and Melnick Reference Wilson and Melnick1990) (see Figure 2). These values can also be displayed visually, illustrating trends in the nearest neighbor averaging. NN averaging is especially useful when examining specific temporal datasets in space because it retains the initial values of data points from the input raster dataset. Archaeologists primarily use this technique to examine changing distributions of sites over time (Fletcher Reference Fletcher2008; Pinder et al. Reference Pinder, Shimada and Gregory1979; Stark and Young Reference Stark and Young1981; Voorrips and O'Shea Reference Voorrips and O'Shea1987).
Average Nearest Neighbor (NN) and Moran's I index of clustering and dispersion.
Spatial patterns in this study were also evaluated using spatial autocorrelation (Cliff and Ord Reference Cliff and Ord1973, Reference Cliff and Ord1981) and specifically Moran's I (Moran Reference Moran1950). Spatial autocorrelation assesses the proximity of different data points on a two-dimensional space. Moran's I measures a set of point features and associated attributes in order to evaluate whether a spatial pattern is clustered, dispersed or random. A positive Moran's I index value indicates a tendency toward clustering while a negative Moran's I index value indicates tendency toward dispersion (Figure 2). Values range from −1 (perfect dispersion) to +1 (perfect correlation or clustering). A zero result in values indicates random spatial patterning. In terms of statistical hypothesis testing, Moran's I values can be evaluated using Z-scores. Values with greater than 1.96 or smaller than −1.96 are significant at the 5% level (Moran Reference Moran1950). Mathematically, Moran's I is defined as:
 $$I = \displaystyle{N \over {\sum\nolimits_{ij} {{w_{ij}}} }}\displaystyle{{\sum\nolimits_{ij} {{w_{ij}}\left({{x_i} - \overline x } \right)\left({{x_j} - \overline x } \right)} } \over {{{\sum\nolimits_i {\left({{x_i} - \overline x } \right)} }^2}}} \qquad \qquad \sum\limits_{i \;=\; 1}^n {i \ne j\sum\limits_{\,j \;=\; 1}^n {} }$$
where N is the number of spatial units indexed by two study units i and j; x is the variable of interest;  $\overline x $ is the mean of x; and w ij is a matrix of spatial weights (Moran Reference Moran1950).
We augment NN and Moran's I with the Getis-Ord G statistic. Given a set of data points with shared attributes (that is, terminal long count dates), the G statistic identifies clusters of points that appear in higher frequencies than expected by random chance (Getis and Ord Reference Getis and Ord1992; Ord and Getis Reference Ord and Getis1995), referred to as neighborhoods by Premo (Reference Premo2004). The statistic considers each feature within the context of neighboring features, making it a powerful tool for examining the spatiotemporal distribution of the shared attributes of interest. The output is a Z-score for each feature, representing the statistical significance of clustering. A high Z-score indicates that a feature's neighbors have high attribute values, in this case the terminal long count date, and vice versa. The higher or lower the Z-score, the stronger the spatial correlation. The G statistic not only tests for clustering, but also tests if above-average or below-average values cluster more strongly (Getis and Ord Reference Getis and Ord1992; Ord and Getis Reference Ord and Getis1995). Here we depart from Premo and use the term “zone” to refer to statistically defined point clusters, as recent use of the term neighborhood suggests a highly localized proximity not considered in the scale of analyses presented here (Arnauld Reference Arnauld, Arnauld, Manzanilla and Smith2012:304).
The Getis-Ord G statistic and local Moran's I complement each other. G is a relative measure of the sum of the values within a given context, but does not explain how similar or dissimilar a feature is to its neighbor. Local Moran's I is a measure of the degree that a feature attribute is similar or dissimilar to its neighbor. Local Moran's I does not provide an estimate of whether the sum of a zone's values is relatively high or relatively low in comparison to those of other zones (Mitchell Reference Mitchell1999). Used in combination, G statistic identifies discrete zones of points and the Moran's I detects outliers within those zones.
Methods
A dataset consisting of Maya sites with terminal long count dates was compiled from the Maya Hieroglyphic Database (MHD) (Macri and Looper Reference Macri and Looper1991–2014) and integrated into a GIS for the Maya lowlands. The MHD includes epigraphic data inscribed on known Maya architecture, artwork, portable objects, and carved stone monuments. The monument database is organized by individual glyph blocks (as of this investigation over 41,000) located on inscribed stone monuments from 240 archaeological sites. The database encodes texts using an array of graphic, linguistic, and historical criteria. The majority of these data come from carved stone monuments.
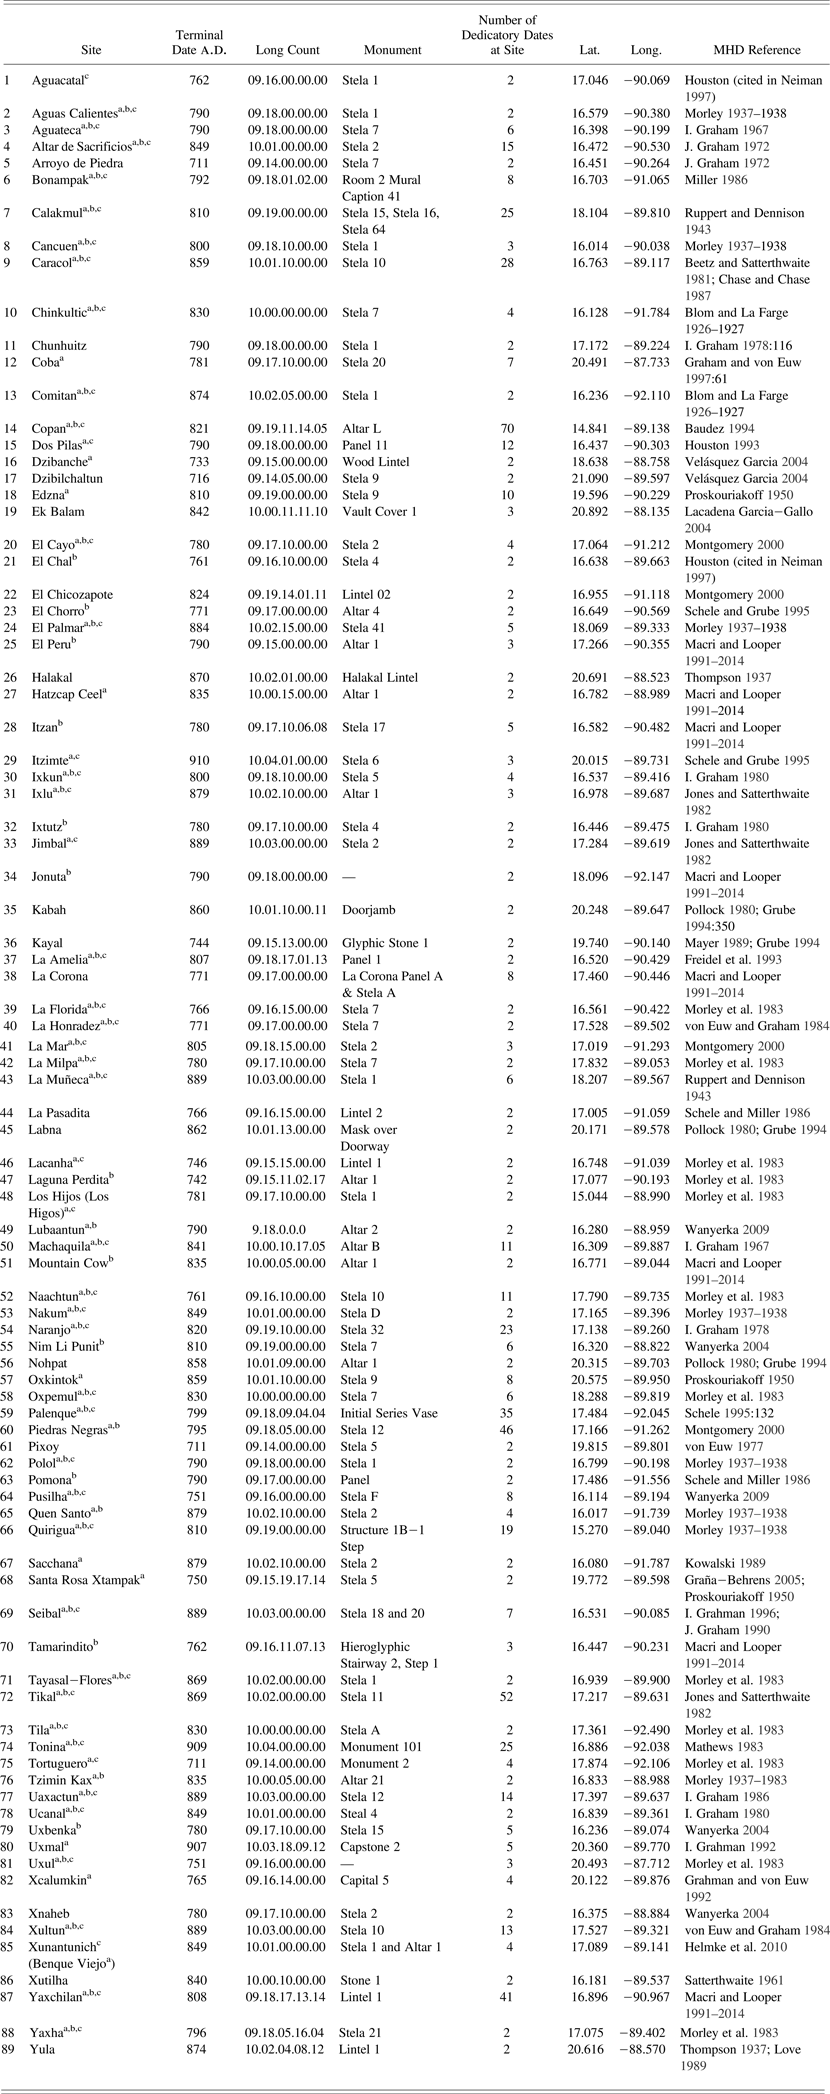
The dataset used in this study consists of 89 sites with Late and Terminal Classic dates from the Maya lowlands ranging from a.d. 711 to a.d. 910 (Table 1). Both Initial Series long count dates and calendar round dates confidently correlated with the long count were considered since they are both believed to be concurrent with the original time of dedication. Dates associated with distance numbers, or the intervals between dates on Maya inscriptions, were not considered. Sites with only one recorded date were excluded from the dataset because a terminal date cannot be determined. Approximately 48% of sites considered only have two recorded dates, so we examined whether the number of dates appearing at a site (see Table 1) correlated with the terminal date. Linear regression produced an R-squared (R2) value of .0201, indicating that only 2.01% of the variation of terminal long count dates in the dataset is explained by the number of dates at each site. Sites with two recorded dates were therefore included.
Terminal monument dates from 89 lowland Maya sites used in these analyses, including data in Gregorian and Maya long count (calculated using GMT correlation)
aSites discussed in Hamblin and Pitcher (Reference Hamblin and Pitcher1980)
bSites discussed in Bove (Reference Bove1981), Whitley and Clark (Reference Whitley and Clark1985), Kvamme (Reference Kvamme1990), and Premo (Reference Premo2004)
cSites discussed in Neiman (Reference Neiman, Barton and Clark1997)
Sixty-six terminal long count dates from previous studies correspond to those used in this study. Three sites from Neiman's study were not included in this study. Comalcalco (coastal Tabasco) and La Lagunita (highland Guatemala) were eliminated because they are located outside the Maya lowlands. Naj Tunich, a cave site, was not included because it was never the center of an independent polity, but perhaps a ritual location associated with the large center of Caracol (Chase and Chase Reference Chase and Chase1994). Mountain Cow, Tzimin Kax, and Hatzcap Ceel considered by some to be part of the same site, were included in the analyses as three sites with three different Universal Traverse Mercador (UTM) coordinates in order to remain consistent with previous studies. The monument dates from the site of Benque Viejo mentioned in previous studies are here associated with the site of Xunantunich, a later name given to the site (Helmke et al. Reference Helmke, Awe, Grube, LeCount and Yaeger2010). Additional sites from previous studies were excluded if they could not be located geographically with confidence, including Morales. Finally, Chichen Itza was not included in this study since it bears only one initial series long count date (a.d. 878) during the interval considered in this study (a.d. 711–910).
A small number (n = 5) of earlier terminal long count dates exist in the Maya lowlands, but a.d. 711 was used as the starting point based on Lowe's (Reference Lowe1985) proposal that the number of dated monuments peaked in a.d. 720. The date a.d. 720 thus represents the apex of the Classic period monument dedication tradition. He argues that the steady decline in monument dedication after this time represented a disintegration of the authority of Maya kings. While more current data suggest that the number of dedicated monuments reached its apex between a.d. 750 and 775 (see histogram in Kennett et al. Reference Kennett, Breitenbach, Aquino, Asmerom, Awe, Baldini, Bartlein, Culleton, Ebert, Jazwa, Macri, Marwan, Polyak, Prufer, Ridley, Sodemann, Winterhalder and Haug2012; also Munson and Macri Reference Munson and Macri2009) we include dates slightly earlier because it allows for an extended view of the relationship between long count dates and the process of political collapse. We aggregated terminal dates into twenty-year increments, known as the katun in the Maya Long Count calendar. The first date (a.d. 721) used in this study falls within the katun that begins in a.d. 711.
Data from the MHD were integrated into a GIS database using ESRI ArcGIS 10.2. UTM coordinates for large sites that could be visually identified from aerial photos were obtained from Google Earth (for example, Tikal, Copan, and Caracol) where possible. These coordinates come from the central plazas at these sites. For other sites not visible on satellite imagery we adopt coordinates provided by the Electronic Atlas of Ancient Maya Sites (Witschey and Brown Reference Witschey and Brown2010) that are based on a variety of published text and cartographic sources. The error associated with these locations does not have a significant effect on our broad scale analysis. For all analyses UTM coordinates were projected using World Geodetic System 1984. Table 1 presents coordinates in latitude and longitude for general reference.
NN and spatial autocorrelation using Moran's I and the Getis-Ord G statistic were applied to the dataset to examine broad-scale trends in terminal long count dates. NN statistics were calculated using the Spatial Statistics Average Nearest Neighbor tool in ArcGIS 10.2. NN statistics generated a raster that visually identified trends in the distribution of terminal long count dates. The raster was categorized into 12 katuns, beginning with the katun period a.d. 711 to a.d. 731 and ending with a.d. 891 to a.d. 911 (Figure 2).
Moran's I and Getis-Ord G calculations were performed using the Spatial Autocorrelation tool in ArcGIS 10.2, with the conceptualization of spatial relationships (that is, determination of spatial zones) determined using a maximum zone search radius of approximately 90 km, which was, in turn, determined by the NN statistics (the average distance between two sites). Getis-Ord values and Z-scores were calculated using the Hot Spot Analysis tool in ArcGIS10.2, with spatial relationships additionally determined by the NN statistics. The same spatial analyses were applied to zones of sites identified in the broad-scale Getis-Ord G statistic analyses to further investigate the existence of sub-regional patterning.
Results
A trend raster of calculated NN analyses (Figure 3) demonstrates no strong directional trends in terminal long count dates on monuments across the Maya lowlands (for example, southwest-to-northeast). Early terminal long count dates are located in isolated pockets in the Puuc region of Yucatan centered on Pixoy, as well as southern Yucatan at Dzibanche, around the site of Tortuguero in Tabasco, and Pusilha in southern Belize, extending northwest into the Peten, and the lower Pasión area in north-central Guatemala. Clusters of sites that have the latest terminal long count dates include zones in the Puuc and Chichen areas around the sites of Uxmal and Itzimte, southern Chiapas at Tonina and Comitan, the northern Peten around La Muñeca, the central Peten in the area around Tikal, Ixlu, and into central Belize along the Belize River valley and the Vaca Plateau, and at Seibal.
Trend raster image of calculated NN analyses showing broad-scale trends in terminal long count dates across the Maya lowlands. Numbers correspond to terminal dates, as defined in the text.
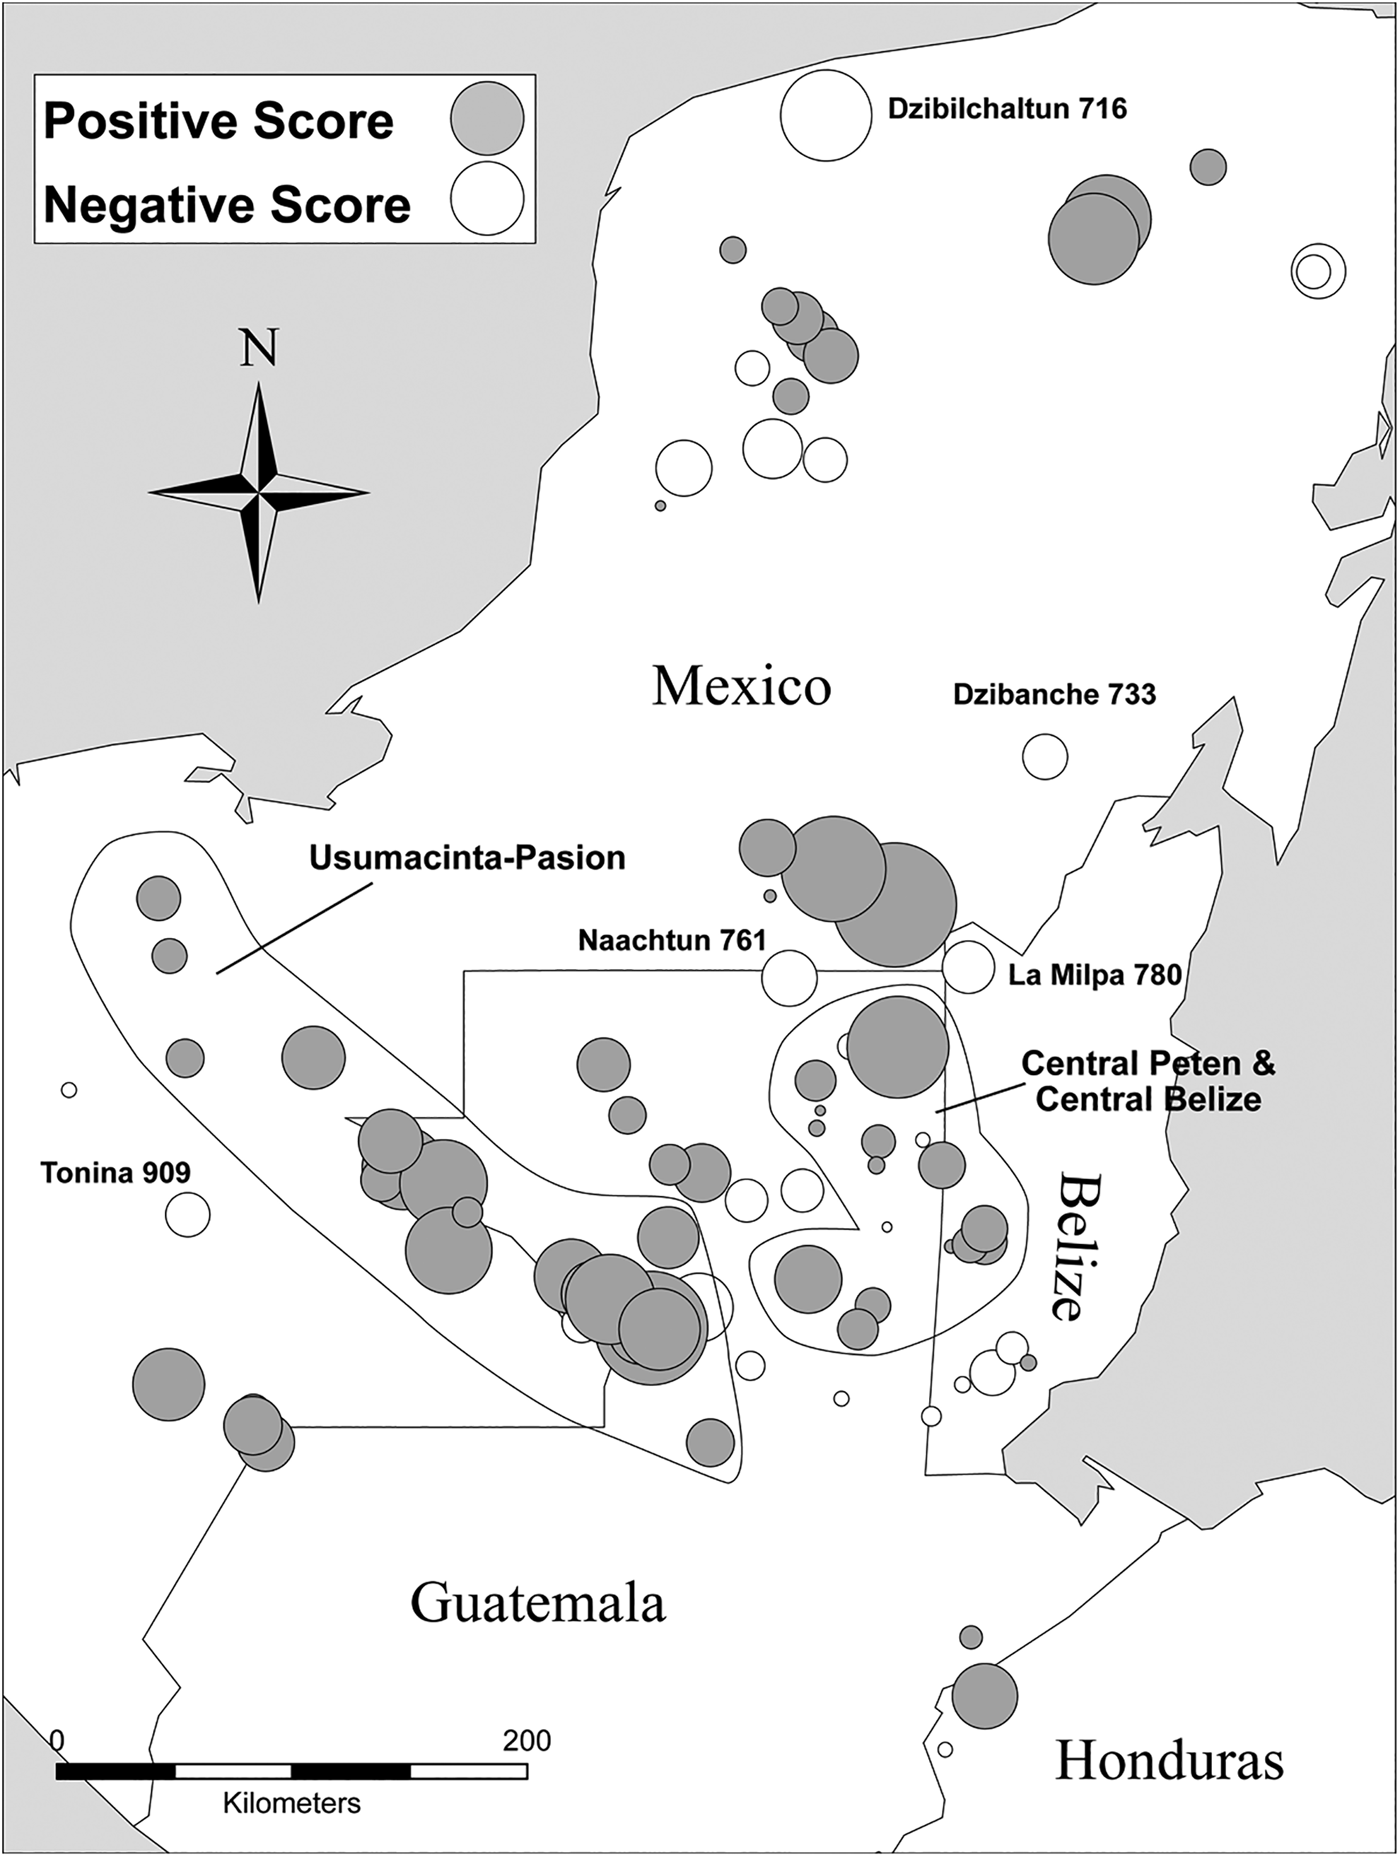
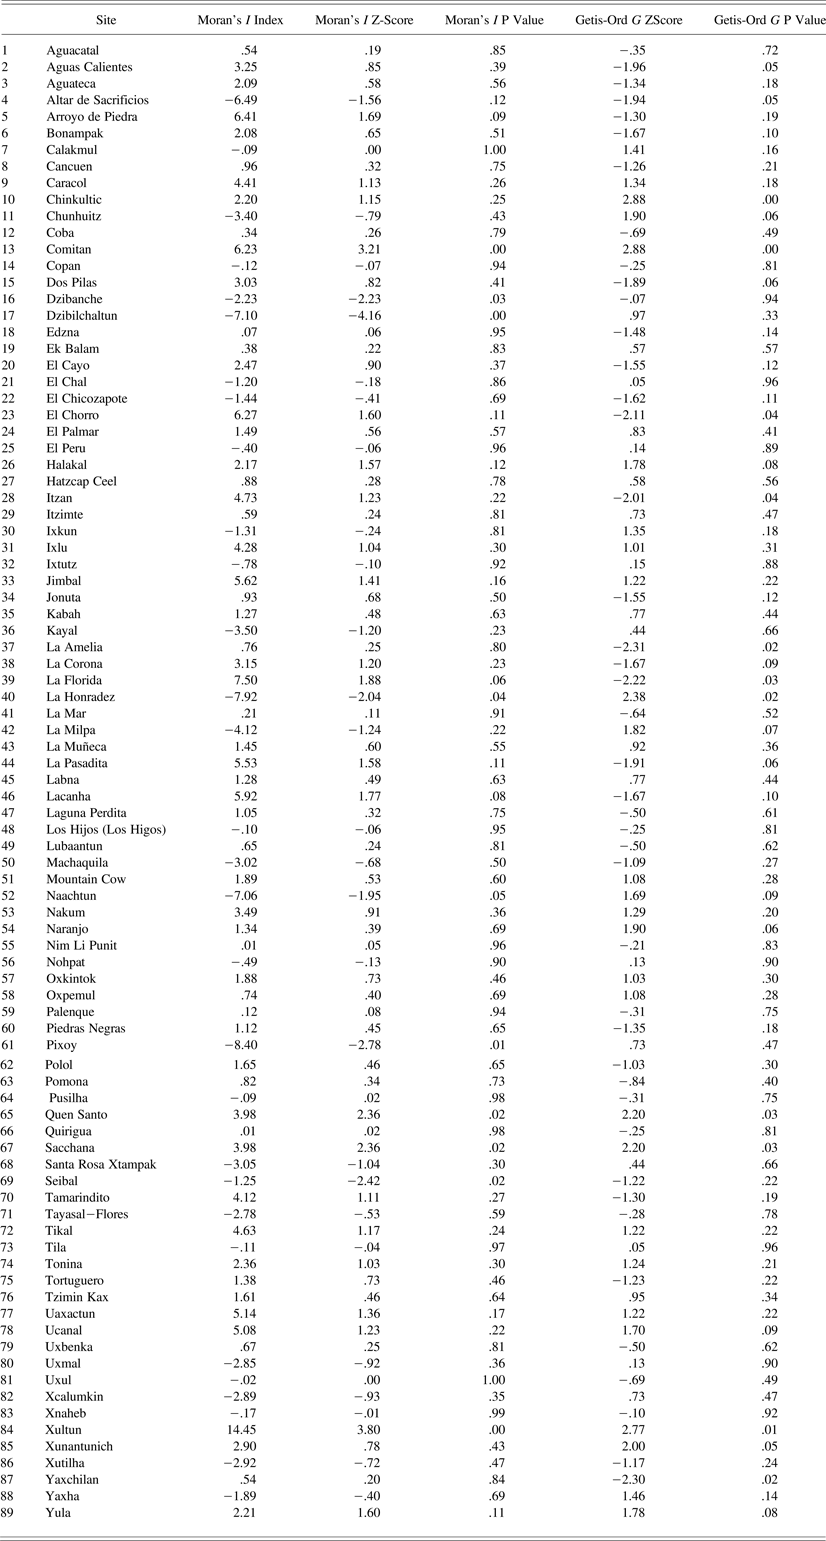
Moran's I scores distinguish spatially defined concentrations of comparable terminal long count dates (Table 2). Large and positive scores represent sites that have comparable terminal dates to those around them (Figure 4). Sites with negative scores have terminal dates that are dissimilar to their neighbors. The Moran's I value is 0.0567 with an average Z-score of 1.99 standard deviations, suggesting that there is less than a 5% likelihood that this clustered pattern is the result of random chance. Concentrations of similar dates are located in the Usumacinta-Pasión region, in the central Peten and in central Belize. Sites that have dissimilar dates from their neighbors include Dzibanche, Naachtun, La Milpa, Seibal, Tonina, and several sites in the northern lowlands, the most dissimilar of which is Dzibilchaltun.
Bubble graph of Moran's I scores. Shaded bubbles represent positive I scores (clustering of similar terminal dates), white bubbles represent negative I scores (dates that are dissimilar to their neighbors). Bubble area is proportional to the absolute value of the score. Contemporary political boundaries appear in the background.
Moran's I and Getis-Ord G values for sites used in this study
The Getis-Ord G statistic groups sites into zones, with more negative Z-scores corresponding to sites with early dates, and more positive values identifying sites with later terminal dates (Table 2). These scores can help to determine degrees of similarity or difference in dates within specific spatial zones. Our results are consistent with Premo's (Reference Premo2004) patterns in the central and southeastern areas of the Peten, where he recognizes two distinct zones of sites. Our analysis, however, extends beyond the Peten, finding regional abandonment of monument carving centered on large, politically powerful sites throughout the Maya lowlands.
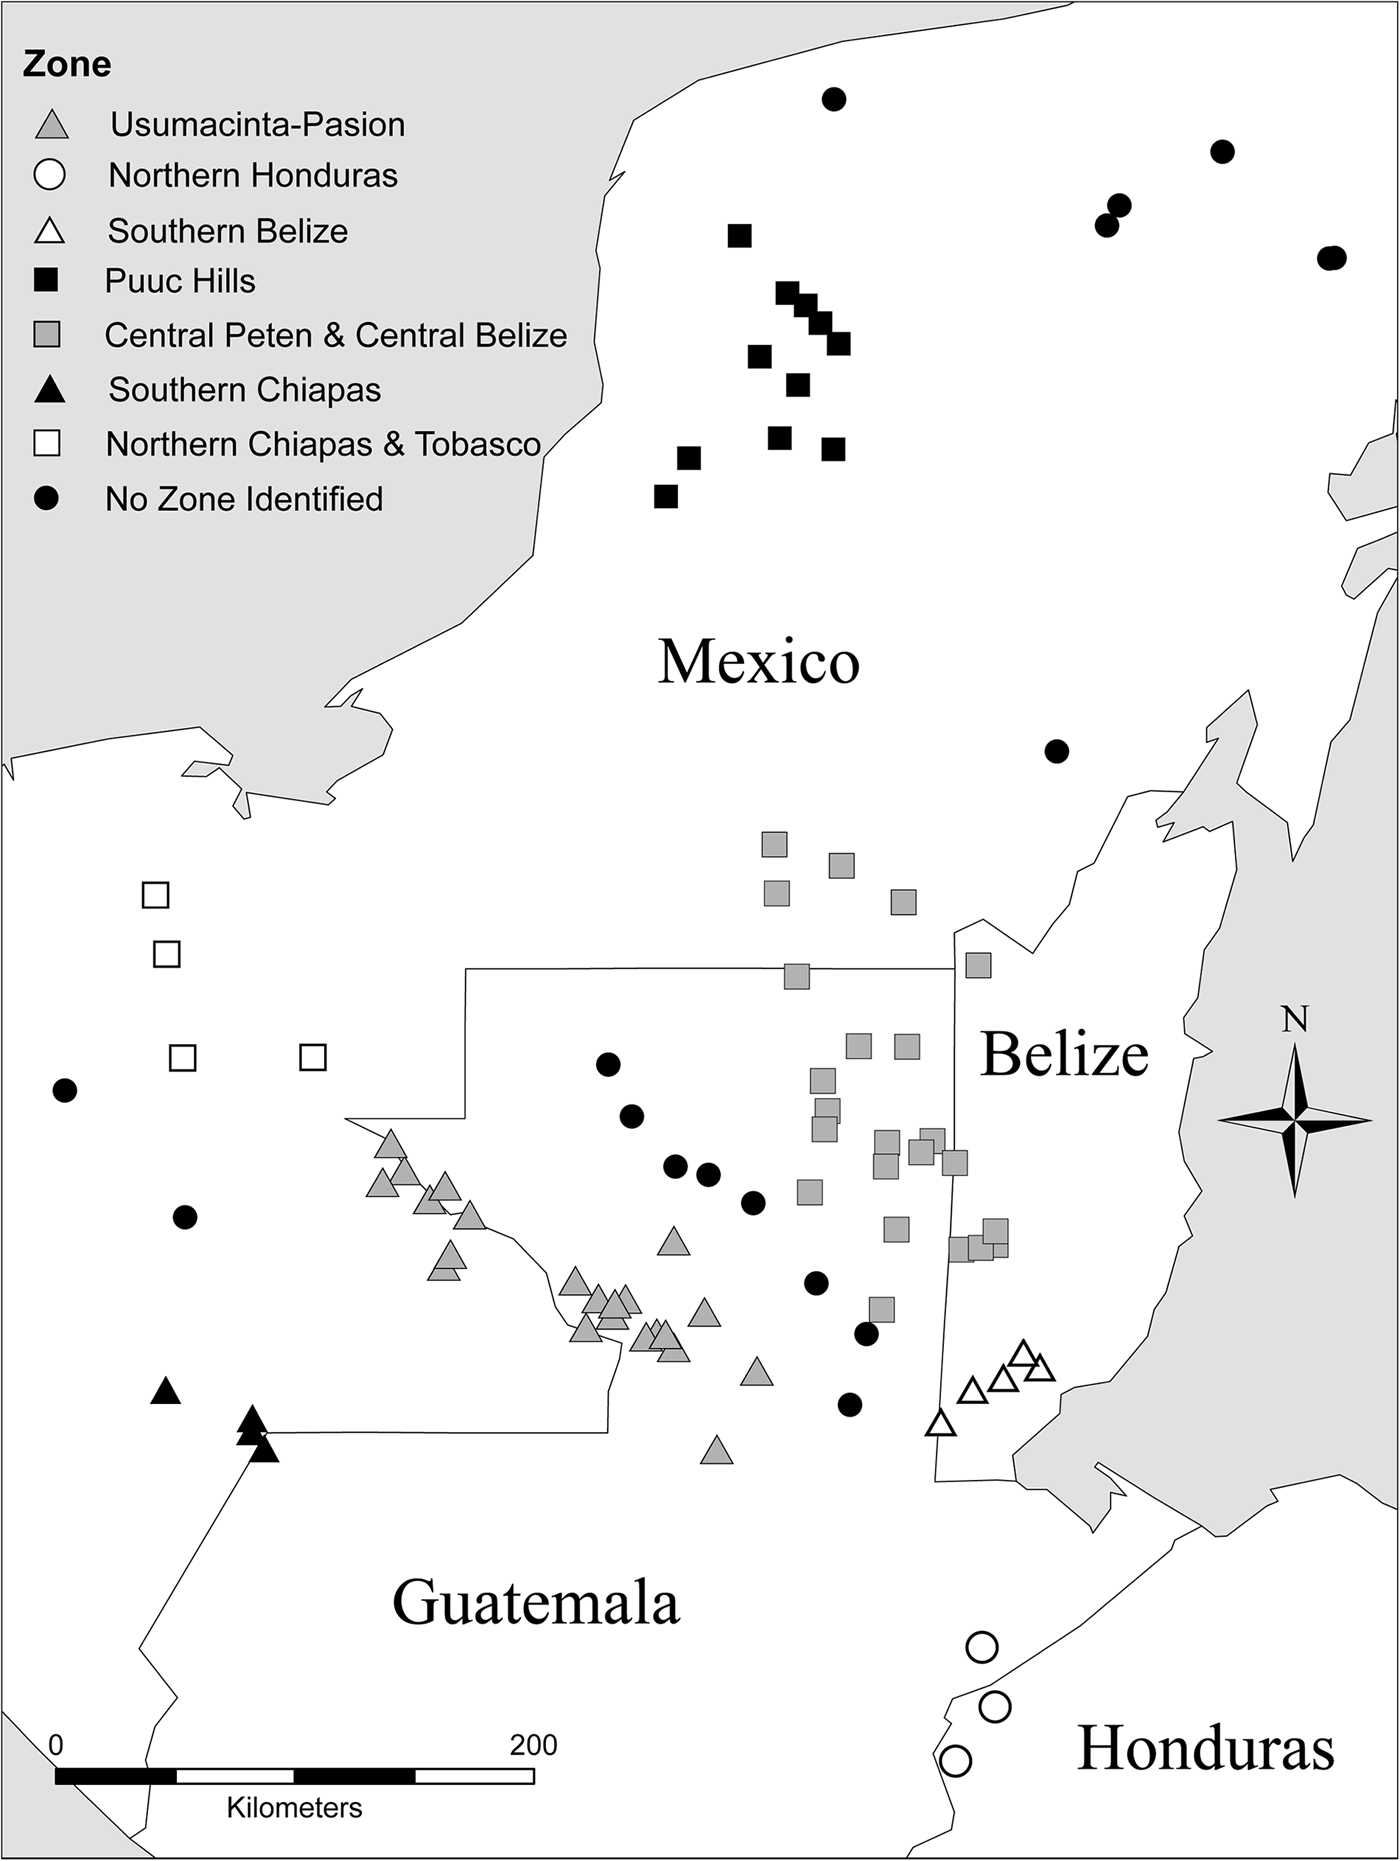
We use the results of the G statistics to define seven zones that represent clusters of sites with similar terminal long count dedicatory dates (Figure 5). These roughly correlate with major geographical regions in the Maya lowlands from which zone names are derived. Clusters of sites include discrete zones in: (1) the Usumacinta-Pasión zone, consisting of sites along the Río Usumacinta from Piedras Negras in the north, down to Altar de Sacrificios, Dos Pilas, and Aguateca in the south; (2) the southern zone of northern Honduras consisting of Copan, Quirigua, and surrounding sites; (3) southern Belize; (4) the Puuc Hills zone; (5) the central Peten zone around Tikal, Uaxactun, and Calakmul, including parts of central Belize centered around Caracol; (6) four sites located in southern Chiapas; and (7) four sites located in northern Chiapas and extending into Tabasco, Mexico, the largest of which is Palenque. The zones defined along the Usumacinta, the central Peten, and southern Belize were also identified by Moran's I as groups of sites that had more similar terminal dates than other regions.
Zones defined by Getis-Ord G statistic, represented as spatially defined clusters of sites with similar terminal long count dates.
All sites do not necessarily fall within a statistically defined zone. For example, a line of sites without a defined zone extends from southwest to northeast between the Usumacinta-Pasión and central Peten zone. This is likely the result of their proximity, being relatively closer to the central Peten zone, and their earlier than average dates. This is also an area that has gaps in archaeological coverage.
Zones and Sub-zones
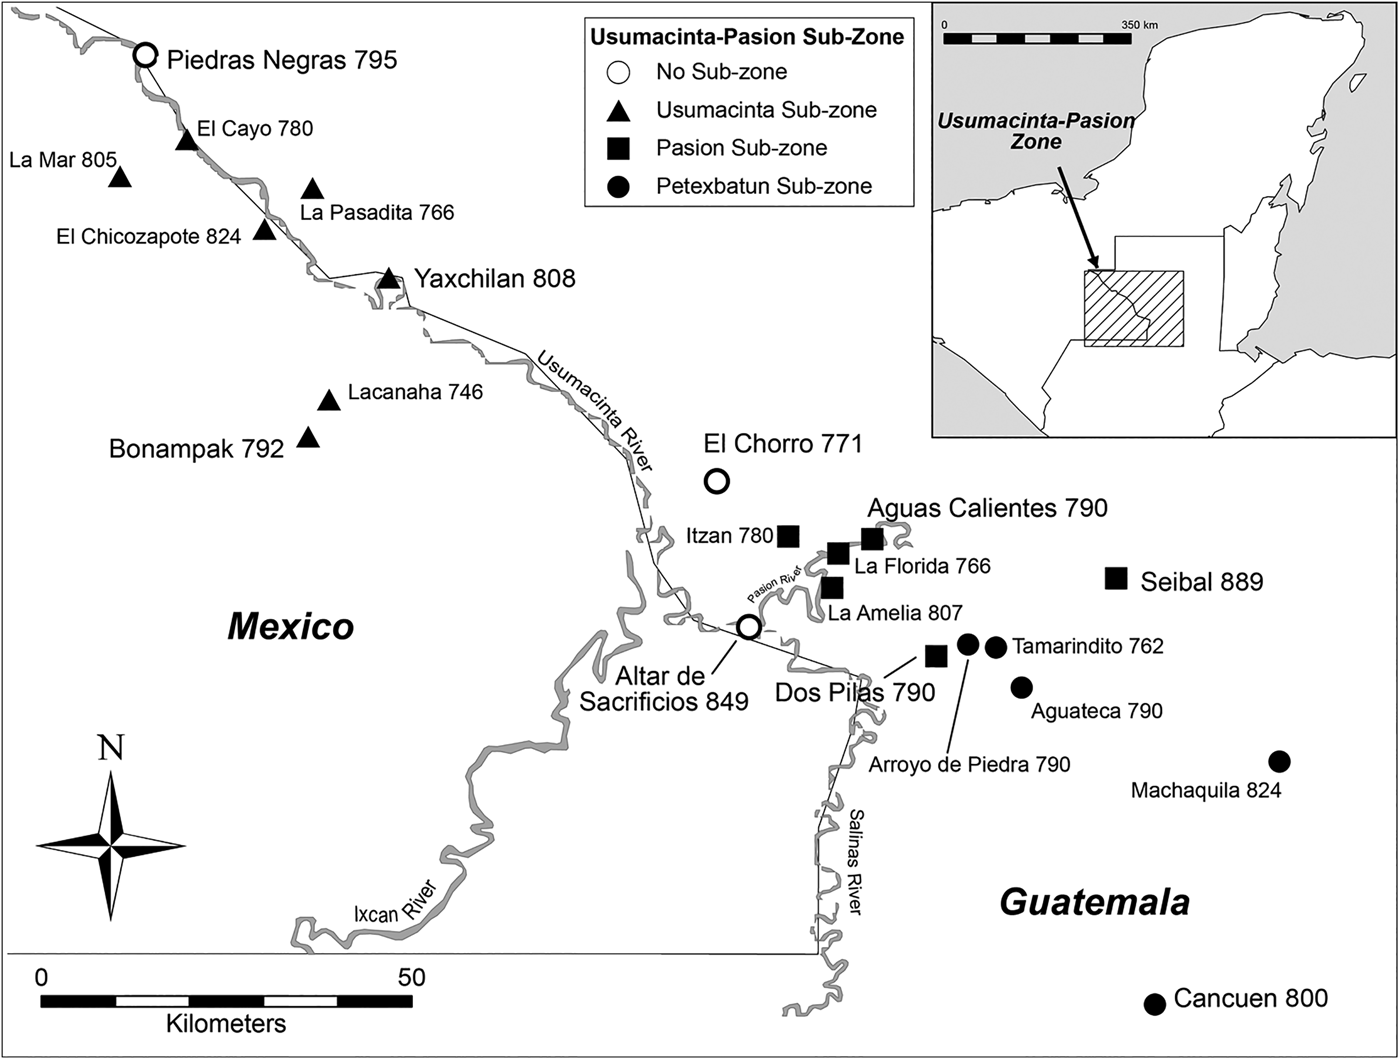
The Usumacinta-Pasión zone is comprised of 22 sites (Figure 6). NN analyses performed within the zone suggest a temporal gradient, from early to late, down the Usumacinta River from north to south, possibly corresponding to trade networks (Foias Reference Foias, Masson and Freidel2002). The sites of Seibal (a.d. 889) and Altar de Sacrificios (a.d. 849) have the latest dates in the area. The Moran's I index score of -0.013 and Z-score of -0.08 indicate that this pattern is dispersed and may be random. Local G statistics performed in this zone identified sub-zones that include:
1. The Usumacinta sub-zone, including the sites of El Cayo, Lacanha, La Pasadita, La Mar, Bonampak, Piedras Negras, Yaxchilan, and El Chicozapote (a.d. 746–824)
2. The Pasión sub-zone, including the sites of La Florida, Itzan, Aguas Calientes, La Amelia, and Altar de Sacrificios (a.d. 766–849)
3. The Petexbatun sub-zone, including the sites of Arroyo de Piedra, Tamarindito, Aguateca, Cancuen, Machaquila, Dos Pilas, and Seibal (a.d. 762–889)
Map of the 22 sites which comprise the Usumacinta-Pasión zone, with three sub-zones shown. Numbers correspond to terminal dates, as defined in the text.
All sites in the Usumacinta-Pasión zone were classified into the three sub-zones except the site of El Chorro. While its terminal date (a.d. 771) falls within the ranges for both the Pasión and Petexbatun sub-zones, its physical location between the two sub-zones is likely the reason behind its unclassified nature.
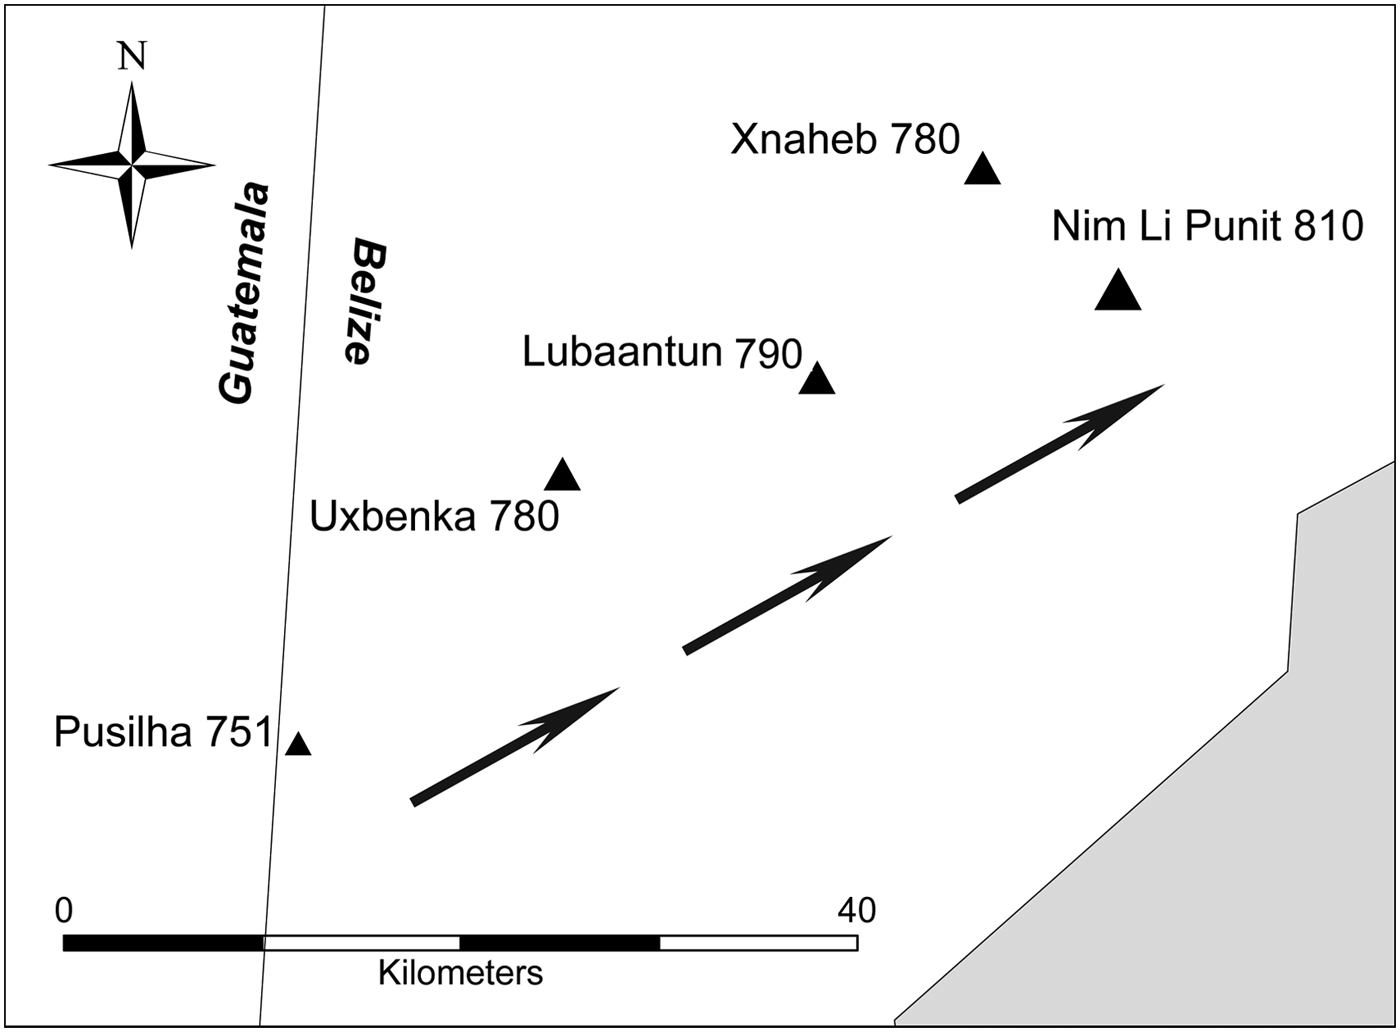
The southern Belize zone consists of five sites (Figure 7). NN analyses indicate a dispersed pattern in which early to late dates extend steadily from Pusilha in the south northeast towards Nim Li Punit. Moran's I and G statistic analyses for the zone do not identify sub-zones. The pattern does not appear to be significantly different from random.
The southern Belize zone, with early to late terminal monument dates extending from Pusilha northeast towards Nim Li Punit. Size of symbol reflects this trend. Numbers correspond to terminal dates, as defined in the text.
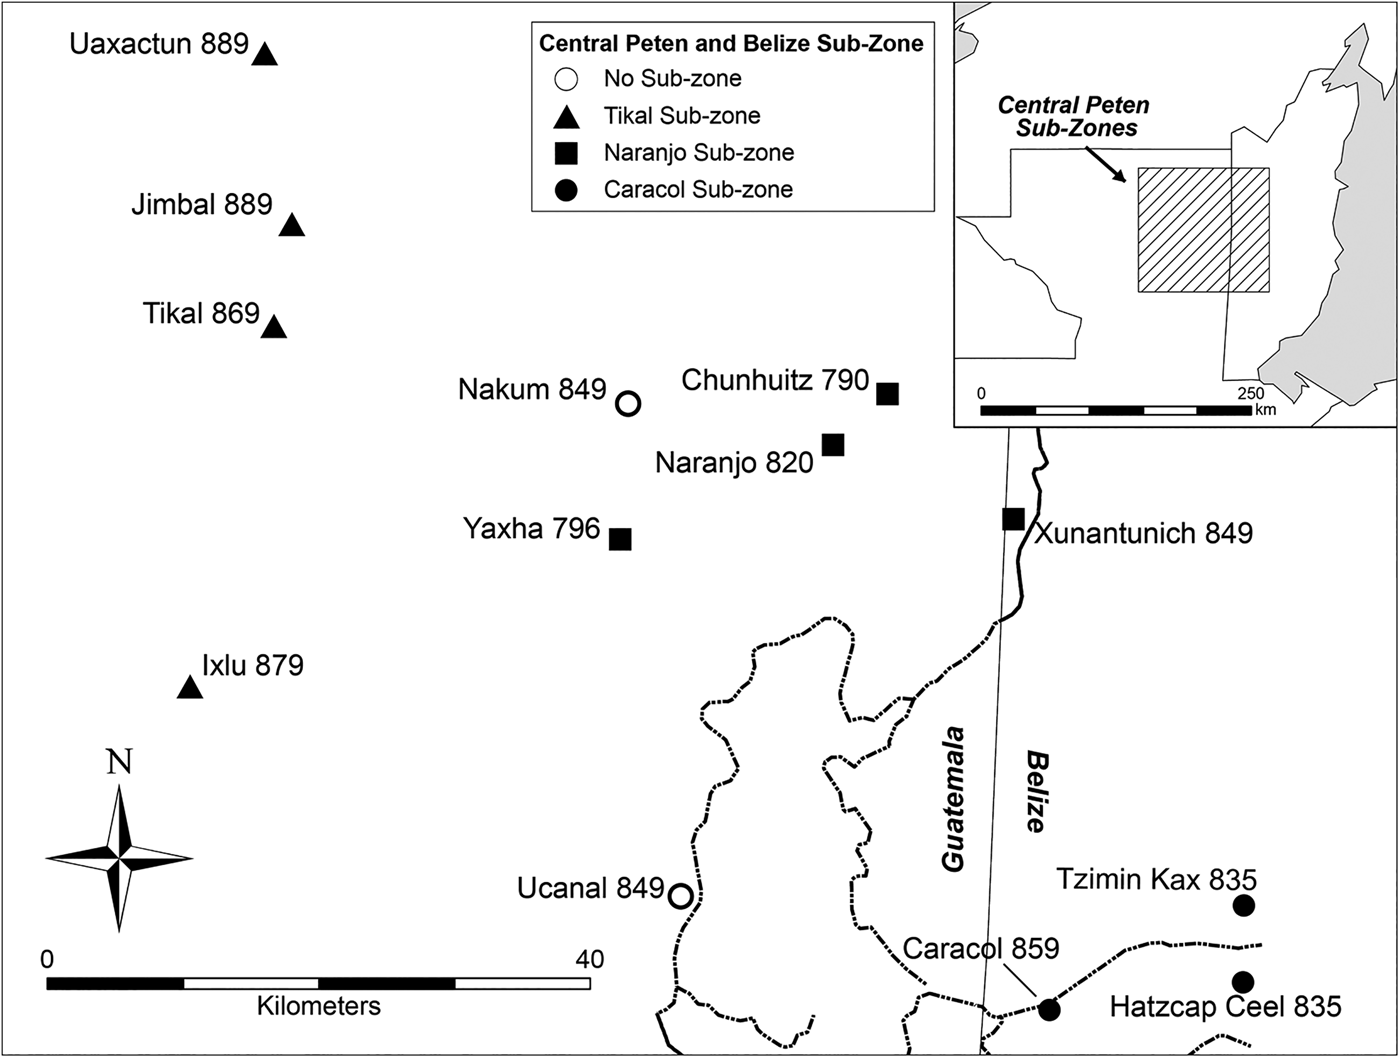
The zone identified for the area encompassing most of the Peten and extending into central Belize consists of 23 sites (Figure 8). The earliest terminal dates in central Belize come from Naachtun (a.d. 761) and La Milpa (a.d. 780). Little spatial patterning is evident in this area. A patchwork of later dates can be found in the northern Peten at Oxpemul, El Palmar, and La Muñeca. In the central Peten, late terminal dates extend from north to south around Uaxactun, Jimbal, Tikal, and Ixlu. Late dates also occur at Xultun. The Peten zone Moran's I index score of 0.03 and Z-score of -0.72 indicate that this zone-wide pattern is neither clustered nor dispersed. This means that most of the dates are similar to each other overall. The G statistic did, however, identify three sub-zones that are restricted in the central Peten (Figure 8). These sub-zones are associated with the largest centers and include:
1. The Tikal sub-zone composed of the sites of Tikal, Uaxactun, Ixlu, Jimbal, and Nakum (a.d. 849–889)
2. The Naranjo sub-zone including the sites of Naranjo, Xunantunich, Chunhuitz, and Ucanal (a.d. 790–849)
3. The Caracol sub-zone in western Belize the Caracol, Tzimin Kax, Hatzcap Ceel, and Mountain Cow (a.d. 835–859)
Three sub-zones in the Peten zone restricted in the central Peten. These sub-zones are associated with the largest centers in the area: Tikal, Naranjo, and Caracol. Numbers correspond to terminal dates, as defined in the text.
All of the sites in the central Peten are classified into the three sub-zones except Yaxha. Yaxha is likely an outlier due to a terminal date (a.d. 796) that is not similar to its closest neighbors, whose terminal dates postdate that of Yaxha by 30 to 50 years.
The zones in northern Honduras (three sites), northern Yucatan (Puuc; nine sites), southern Chiapas (four sites), and northern Chiapas and Tabasco (four sites) show no internal spatial trends in the NN analyses and no statistically significant regional patterns were exhibited in our spatial autocorrelation analyses. Moran's I index scores for all four zones are −.35 ± .06, .04 ± .77, −.64 ± 1.28, and −.59 ± 1.09, respectively, indicating that trends in the data are neither clustered nor dispersed. No sub-zones are apparent in these areas. A larger sample size, however, may demonstrate regional and sub-regional patterning for these zones.
DISCUSSION
Prior work beginning in the 1980s emphasized spatial trends in terminal long count dates over broad areas centered on the central Peten. We expand the dataset to encompass data from throughout known Classic period Maya interaction spheres in the lowlands and, as a consequence, we are able to produce more regionally specific analyses. We do not detect a broad-scale directional trend in terminal long count dedicatory dates across the entire Maya lowlands from Nearest Neighbor and Moran's I analyses (compare with Bove Reference Bove1981). Our results are consistent, however, with some previous studies of more limited datasets. Like Bove (Reference Bove1981), Whitley and Clark (Reference Whitley and Clark1985), and Kvamme (Reference Kvamme1990), we identify regionally specific clusters of terminal dates, sometimes with their own internal spatial patterning. Our analyses indicate a southwest-to-northeast trend in terminal long count dates, specifically within the central Peten zone, as first suggested by Bove and later reaffirmed by Neiman (Reference Neiman, Barton and Clark1997). Zones are often concentrated around specific large sites (for example, Tikal, Naranjo, and Caracol) or groups of large sites, as is the case with the Usumacinta-Pasión zone.
Several interpretations have been put forward to explain the presence of site clusters with similar terminal monument dates. Our regionally specific perspective is in line with Neiman's analysis, which indicate a decline of the largest elite monument-bearing centers before smaller ones. On the other hand, Premo (Reference Premo2004:862) suggested that clusters represent locations where either decentralized elite groups continued erecting monuments, while their neighbors discontinued this cultural practice or, alternately, that clusters represent sites trying to reestablish authority over an area by erecting monuments. Our results neither confirm nor refute Premo's interpretation. Rather, an alternative scenario may be that site clusters were central locations that maintained the ability to carve monuments after others around them had lost their influence. They were, at least for a time, impervious to factors that destabilized their distant neighbors. More regionally specific spatiotemporal studies may help to elucidate the process of decline in different parts of the Maya lowlands by adding specificity and clarity in spatial patterning to zones and sub-zones within those areas.
While results from this study suggest that the collapse had identifiable, regionally specific manifestations, research of this nature has limitations. The known corpus of hieroglyphic texts is not assumed to represent the total body of monuments produced; indeed a complete record of dynastic history is unknowable given the partial nature of the archaeological record. In addition, there was considerable regional and historical variation in the role of Classic period elites. Not all styles of rulership were characterized by the Ajaw tradition (Jackson Reference Jackson2009). Long count dates are associated primarily with the best known form of political organization and collapse. Some extant monuments have eroded over the centuries so that the texts can no longer be read. Others are thought to have been destroyed in prehistory during wars, dynastic regime changes, or they may remain buried within buildings where they were placed during dedication or termination rituals (Martin and Grube Reference Martin and Grube2008). Some parts of the Maya lowlands are poorly studied and there are certainly monuments yet to be discovered and deciphered. The record is imperfect, but our work is a significant expansion on previous research on the spatiotemporal dynamics of political failure, establishing a framework for incorporating additional discoveries or reinterpretations.
Recognizing that monument dedication was relatively coterminous in defined zones demonstrates that local spatial statistics, used within a GIS platform, are able to isolate spatial indicators of processes or behaviors that ultimately led to the reduction in the number of complex polities in the Maya lowlands. The identification of geographically specific zones and sub-zones opens up several avenues for investigation. First, the reduction and ultimate cessation of monument dedications within each zone may have been, or likely was, affected by similar processes (conflict, disruption of economic or sociopolitical networks, natural or anthropogenic environmental change, etc.). This also implies that sites within zones and sub-zones were socially and economically interconnected, at least in part, through their elite populations.
Independent sources of archaeological data also indicate regionally varied sociopolitical contexts throughout the lowlands during the Terminal Classic period, corresponding to sub-zone delineation and spatial patterning in terminal monument dates. The Usumacinta-Pasión zone, possessing the earliest terminal dates, experienced endemic warfare during the eighth century, an observation supported by both archaeological data (Inomata Reference Inomata1997, Reference Inomata2008; O'Mansky Reference O'Mansky and Iannone2014) and textual information (Demarest et al. Reference Demarest, Rice and Rice2004; Webster Reference Webster2000:112). The temporal gradient of terminal monument dates, from early to late down the Usumacinta River from north to south correlates with early events in the Usumacinta sub-zone. A sudden termination of construction followed by rapid depopulation and abrupt changes in material culture early in the eighth century a.d. was likely provoked by a rivalry and warfare between Yaxchilan and Piedras Negras. Similar violent events have been proposed during the Terminal Classic period between centers in the Pasión and Petexbatun sub-zones (O'Mansky Reference O'Mansky and Iannone2014; O'Mansky and Dunning Reference O'Manksy, Dunning, Demarest, Rice and Rice2004). Evidence of a political collapse contrasts with ecological, osteological, and settlement studies for the Pasión and Petexbatun areas that have found stability in Maya land-use practices during the collapse (Dunning et al. Reference Dunning, Beach and Rue1997). There is also little evidence for increasing ecological or nutritional stress (see, for example, Emery et al. Reference Emery, Wright and Schwarcz2000; Emery and Thornton Reference Emery and Thornton2008, Reference Emery, Thornton and Iannone2014; Wright Reference Wright1997). Environmental and ecological stability observed by some researchers may be linked to a longer period of nonelite habitation in the region after the collapse (Hoggarth et al. Reference Hoggarth, Culleton, Awe and Kennett2014; Webster et al. Reference Webster, Freter, Storey, Demarest, Rice and Rice2004). This stands in contrast to the abrupt cessation of elite activities as evidenced by the archaeological record and the length of time between the first and last terminal dates. All three sub-zones in the Usumacinta-Pasión zone, however, seem to have suffered from disruptions of trade networks and indications of environmental degradation. Perhaps a symptom of the tense sociopolitical atmosphere, a shift in settlement has been documented archaeologically to farms located closer to fortified site centers. This population packing likely led to soil exhaustion during the earlier part of the Terminal Classic period and contributed to demographic decline in the area (Dunning et al. Reference Dunning, Beach, Farrell and Luzzadder-Beach1998). A few sites have later terminal monument dates for the zone, including Cancuen (a.d. 800) and Seibal (a.d. 889), but these processes likely affected the region as a whole.
The spatial patterning of terminal monument dates from the central Peten and central Belize zone also corresponds well with what has been archaeologically documented during the Terminal Classic period in the region. The area was marked, like the Usumacinta-Pasión region, by warfare between the rival sites of Tikal, Naranjo, and Caracol (Chase Reference Chase, Brown and Stanton2003; Martin Reference Martin, Grube, Eggebrecht and Seidel2001; Schele and Freidel Reference Schele and Freidel1990). Each of these major sites serves to define a sub-zone in our analysis. Status rivalry has been documented in the central Peten sub-zone during the eighth century, which stimulated competitive architectural programs. The secondary sites of Uaxactun, Ixlu, Jimbal, and Xultun declared their independence from Tikal at the beginning on the ninth century a.d. This pattern has been interpreted as representing shifting seats of ceremonial performances (Rice Reference Rice2004). Tikal may have used this mechanism as a power-sharing arrangement (Rice Reference Rice2007). By a.d. 830, however, populations at Tikal began to decline while secondary sites gained power over their former overlord. Although Tikal's terminal monument date is a.d. 869, most other terminal dates within its sub-zone, with the exception of Nakum, postdate this by 10 to 20 years, a pattern also noted in the Naranjo sub-zone. Like the events that played out in the Usumacinta-Pasión zone, military campaigns preceded the decline and cessation of monument dedication in this region with the final date recorded at Uaxactun (a.d. 889) referring to warfare with its neighbors. Caracol experienced a similar fate to Tikal and Uaxactun with a dramatic reduction in architectural construction around a.d. 895, and evidence of burning and warfare in the site core (Chase and Chase Reference Chase, Chase, Demarest, Rice and Rice2004, Reference Chase, Chase, Varela and Foias2005). The terminal date at Caracol (a.d. 859), however, postdates all others in its sub-zone, perhaps a testament to its influence and the power of the Vaca Plateau.
Archaeological data in southern Belize and adjacent regions suggest a more complex picture of collapse. Some centers experienced a decline in population and monumental constructions where other sites, such as Ixtonton and Ucanal in Guatemala, expanded (LaPorte Reference LaPorte, Demarest, Rice and Rice2004). Terminal long count dates in southern Belize suggest a relatively quick sociopolitical disintegration of major sites extending first from the south at Pusilha (a.d. 731), to the northeast towards Nim Li Punit (a.d. 810), a linear distance of only 30 km. Hieroglyphic texts and excavations at Pusilha suggest that the polity persisted at least through a.d. 790 (Braswell Reference Braswell2001; Braswell and Prufer Reference Braswell and Prufer2009:48). Its decline likely contributed to the failure of other polities in the region. At Lubaantun, a terminal date of a.d. 790 appears to correlate well with other archaeological indicators of site abandonment (Hammond Reference Hammond1975). Uxbenka 14C dates place the bulk of occupation at the Uxbenka site core and surrounding settlements prior to the placement of Stela 15, which bears the terminal monument date of a.d. 780 for the site (Prufer et al. Reference Prufer, Moyes, Culleton, Kindon and Kennett2011). Final construction activities documented for the site date to a.d. 680–870 (Culleton et al. Reference Culleton, Prufer and Kennett2012). While settlements may have persisted for a short time after the Uxbenka dynasty lost control of the polity (Ebert et al. Reference Ebert, Prufer and Kennett2012), paleoenvironmental evidence suggest that slash-and-burn agriculture also tapered off after the political demise of the site (Walsh et al. Reference Walsh, Prufer, Culleton and Kennett2014). The site chronology from Nim Li Punit is based on 26 carved monuments located in the elite core that were erected between a.d. 711 and 830. The relatively short interval between the first and last dated monument indicates a brief dynastic history for the polity and possibly a short occupational span at the site (Grube et al. Reference Grube, McLeod and Wanyerka1999; Hammond et al. Reference Hammond, Howarth and Wilk1999). The overall picture painted through GIS analyses and archaeological exploration for southern Belize supports the abandonment of monument carving by elites followed quickly by the abandonment of large centers in the region between a.d. 730 and 850. A late date of a.d. 909 does appear at the site of Tzimin Che (Wanyerka Reference Wanyerka2004). Large and small polities, including those in the nearby Maya Mountains appear to have been largely depopulated by this time, however (Prufer et al. Reference Prufer, Moyes, Culleton, Kindon and Kennett2011). Yet, coastal sites linked to maritime seafaring and trade continued to be occupied well into the Postclassic period (McKillop Reference McKillop1996, Reference McKillop2005).
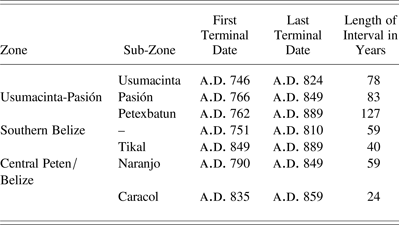
The sequential termination of monument dedication within each of the six zones defined in this study occurs on a continuum from 24 to 127 years (Table 3). The range of dates may be a function of the number of sites in a sub-zone (R2 = .5844), though the sample size of sub-zones constrains this interpretation. Nevertheless, the range of terminal dates suggests variable degrees of synchrony in the cessation of elite activities. Areas in both the central Peten and southern Belize underwent a swift decline and cessation of monument production activities, spanning between one and two generations. In contrast, the southwestern lowlands in the Usumacinta-Pasión area experienced a more prolonged transition from the Terminal Classic to the Postclassic period. The end of the monument tradition at dynastically ruled polities in the southern lowlands was followed by a continued florescence at sites in the Puuc region of northern Yucatan and related zones (Ball Reference Ball and Prem1994; Carmean et al. Reference Carmean, Dunning, Kowalski, Demarest, Rice and Rice2004; Suhler et al. Reference Suhler, Ardren, Freidel, Johnstone, Demarest, Rice and Rice2004). Some of the latest terminal dates come from this region. The resilience of sites in this region, however, was rapidly eclipsed by the ascendance of Chichen Itza, for which we have only one initial series long count date (a.d. 887) from the Temple of the Initial Series before a.d. 910 (see Krochock Reference Krochock, Love, Wren and Schmidt1989:Figure 1). In general, it is thought that Chichen Itza's own decline occurred between a.d. 1000 and 1100 (Cobos Palma Reference Cobos Palma, Demarest, Rice and Rice2004), signaling the final transition from the Classic to the Postclassic period in the Maya lowlands.
Intervals between first and last terminal monument dates for zones and sub-zones
CONCLUSION
In this paper we have reexamined statistical analyses of terminal long count dates in order to characterize the timing and geographical pattern of the political failure of Classic Maya centers. Our larger and updated dataset of 89 terminal long count dates from throughout the Maya lowlands, derived from the MHD, was used to test the hypothesis of a west-to-east collapse of Classic Maya polities. We have examined spatial patterning in terminal long count dates regionally and within smaller subregions (zones and sub-zones). Our results indicate a contraction of Terminal Classic polities around multiple core areas in the Maya lowlands rather than a west-to-east collapse. Seven distinct regions are defined based on their geographic locations and terminal dates. Of the seven core regions identified, the Usumacinta-Pasión region, the southern Belize region, and the Peten region, including sites in central Belize (for example, Caracol and Xunantunich), demonstrate distinct subregional abandonments of monument carving over a period of 24 to 127 years. The timing and length of the collapse in different regions may be related to a shared geography and the nature of social and political processes (for example, warfare, migration, depopulation) within each region.
Archaeological work in the Maya lowlands during the last decade has increasingly focused on understanding the Terminal Classic on the regional scale (for example, Ball and Taschek Reference Ball and Taschek2003; Demarest Reference Demarest and Iannone2014; Demarest et al. Reference Demarest, Rice and Rice2004; Inomata Reference Inomata2008; O'Mansky Reference O'Mansky and Iannone2014; Prufer et al. Reference Prufer, Moyes, Culleton, Kindon and Kennett2011; Rice Reference Rice2007; Scarborough et al. Reference Scarborough, Valdez and Dunning2003), underscoring the importance of social and economic integration and competition between polities. Within a GIS framework we are able to present a geospatial and temporal model of polities and how they group into zones during the Terminal Classic period. We build on previous work by assembling a larger sample of 89 terminal long count dates from across the lowlands. Bove (Reference Bove1981) and subsequent research by others presented the hypothesis that sites with similar terminal long count dates should cluster and correlate with geographic regions, though the information available to them at the time was limited to the Peten region. The expanded dataset presented here includes both the northern and southern Maya lowlands and facilitates spatial studies that can help to define groups of sites that may have experienced similar changes during the final stages of the Classic period.
Establishing spatial and chronological links between sites prior to their political collapse provides another avenue to explore social and ecological bases of cultural change over time. This type of spatially focused research is invaluably aided by GIS technology, which here provides the methodological platform for conducting the spatial statistics on this dataset. Because of its multifaceted modeling capabilities, spatial statistics used within a GIS platform can aid researchers in examinations of complex social changes through time that may be spatially and temporally connected.
The disintegration of Maya polities during the Terminal Classic period was a complex sociopolitical process. Recorded dates on stone monuments provide just one way of examining how these events unfolded. Spatial analyses of the collapse using terminal long count dates provide information about the role of elite interaction networks in processes of decentralization and disintegration. This study is constrained by some of the same problems as previous research. Sample sizes are smaller than would be ideal, written texts provide only part of the story, and they have clear biases. Furthermore, though epigraphic texts are invaluable indicators of elite activities, chronological and spatial dimensions of the collapse do not indicate causation of sociopolitical disruption during the Terminal Classic period.
Some researchers have argued for a more protracted sociopolitical disintegration and persistence of populations long after the dynastic collapse in several regions based on evidence from household contexts (Aimers and Iannone Reference Aimers, Iannone and Iannone2014; Rice Reference Rice, Wilk and Ashmore1988; Stanton and Magnoni Reference Stanton and Magnoni2008; Webster et al. Reference Webster, Freter, Storey, Demarest, Rice and Rice2004). Despite the cessation of monument dating, there is some evidence that more loosely organized polities continued in some zones. At Copan, for example, Webster and colleagues have proposed that after the site's dynastic collapse the authority of non-royal elites held together a patchwork of smaller lineage-based polities for over 300 years. Commoner populations were also in gradual decline through this time (Webster et al. Reference Webster, Freter, Storey, Demarest, Rice and Rice2004). This type of scenario is visible only in the archaeological record and more work comparable to that in the Copan Valley will be required to determine the varying scales and tempos of political and demographic collapse. Our exploration of the spatial dimensions of political collapse inferred from terminal long count dates provides just one of the datasets necessary to determine why so many Maya kings lost political power within a few generations.
RESUMEN
Varios estudios del “colapso” de la civilización maya del periodo clásico se han basado en las fechas de los monumentos terminales del conteo largo para investigar la desintegración sociopolítica del período clásico terminal (730-910 d.C.). Las fechas del conteo largo de este periodo se refieren a la última fecha conocida, que se encuentra tallada o en un monumento de piedra o bien en otro objeto dedicatorio que puede correlacionarse con el calendario gregoriano. Éstos se utilizan como criterio de autoridad para establecer la cesación de las actividades de la élite. Los estudios previos empleaban análisis estadísticos de fuentes epigráficas para establecer el momento del colapso y apuntan a un abandono direccional de los lugares del período clásico que va del sudoeste al noreste.
En nuestro caso, reconsideramos tal hipótesis del colapso oeste-este al analizar un conjunto más amplio y actualizado de 89 fechas terminales de la Base de Datos Jeroglífica Maya (MHD en sus siglas en inglés), usando tanto análisis como estadísticas espaciales del Vecino más Cercano. Postulamos dos preguntas principales. La primera cuestión es si las fechas del conteo largo en monumentos tallados exhiben un patrón temporal de amplia escala. La segunda cuestión es si se pueden determinar los patrones regionales y subregionales que indiquen la desintegración de la organización política. Los arqueólogos que han trabajado en diferentes sectores de las tierras bajas mayas hallaron evidencias regionales del período clásico terminal como consecuencia del incremento de guerras, la degradación ecológica y la despoblación, a veces en el contexto del cambio de condiciones medioambientales y climáticas.
Hemos encontrado que el patrón espacial no es consistente con las hipótesis previas sino que sugiere una reducción de la actividad económica en las organizaciones políticas del período clásico terminal en muchas áreas clave de las tierras bajas mayas. Siete regiones distintas se definen en base a sus fechas terminales, a veces con un patrón subregional.
El final común de las fechas terminales en los monumentos ubicados en regiones específicas abarca un continuo de 24 a 127 años y sugiere grados variables de sincronía en la cesación de las actividades de élite. La regulación y la duración del colapso en distintas regiones puede vincularse con una geografía en común y respuestas sociales diferentes de acuerdo con los cambios en los ambientes sociales. Los modelos regionales de la desintegración sociopolítica contribuirán a entender cómo las sociedades, incluida la nuestra, se desarrollan y salen adelante en respuesta a las condiciones cambiantes de la economía, el medio ambiente y el clima.
ACKNOWLEDGMENTS
We would like to acknowledge Jacob Bartruff for his skills and assistance in organizing the data used in the analyses presented in this article, and Walter Witschey and Clifford Brown for providing access to the detailed and exhaustively researched spatial data in the Atlas of Maya Sites. Without these data, the analyses presented in this paper would not be possible. Thanks are also extended to members of the Human Paleoecology and Isotope Geochemistry Lab at Penn State for their thoughtful input on early drafts of the paper, and to three reviewers who helped to improve the contribution. The Maya Hieroglyphic Database has received major funding from the National Endowment for the Humanities: RT 21365-92, RT 21608-94, PA 22844-96; and the National Science Foundation: SBR-9710961, BCS-9905357, BCS-13289. This analysis is based upon work supported by the National Science Foundation (Ebert 2012–2014: Graduate Research Fellowship DGE-0750757; Kennett 2010–2014: BCS-0940744; Kennett and Prufer 2008–2013: HSD-0827305; Winterhalder 2008–2013: HSD-0827277).