I. INTRODUCTION
Negative stiffness describes a situation in which a reaction force occurs in the same direction as imposed deformation. It is of interest in the context of its role in composites. Classical bounds on the properties of a composite predict they cannot exceed those of the constituents. If the stiffness of a constituent is negative, there is initial stored energy, which violates the assumption of the bounds that each constituent begins at a minimum of stored energy. Bounds can be violated by embedding negative stiffness elements into a positive-stiffness matrix. Negative stiffness is to be distinguished from negative Poisson’s ratio. Poisson’s ratio is defined as the ratio of transverse contraction strain to longitudinal extension strain in a stretched bar. Poisson’s ratio can range from −1 to 0.5 for unconstrained isotropic solids; yet, most solids have a positive Poisson’s ratio ranges between 0.25 and 0.33 since they become thinner when being stretched. Negative Poisson’s ratios are known for (anisotropic) single crystals and also occur in designed foams, via unfolding of the cells.Reference Lakes1 When the Poisson’s ratio is less than −1, the bulk modulus becomes negative provided the shear modulus is positive. This is unstable in an object with free surfaces but can be stabilized by constraint.Reference Drugan2 Negative moduli are allowed in elasticity theory (under constraint) and are anticipated by the Landau theory for ferroelastic transformations. In Landau’s theory, the free energy of the crystal is a function of both strain and temperature. At a high temperature, a single energy well is formed as a function of strain; as the temperature is lowered, the well gradually flattens and develops two minima or potential wells. The flattening of this curve represents the softening of the specific elastic modulus, and the reversed curvature below the transition temperature corresponds to a negative stiffness.
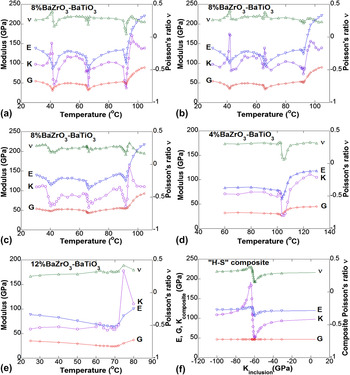
Barium titanate (BaTiO3) is of interest in the context of capacitors and piezoelectric transducers. It undergoes, in cooling, cubic-to-tetragonal, tetragonal-to-orthorhombic, and orthorhombic-to-rhombohedral transformations; above the Curie point, the crystal symmetry becomes insufficient for piezoelectricity. BaTiO3 has lower piezoelectric sensitivity than lead zirconium titanate. However doped BaTiO3 can exhibit competitive piezoelectricity with the benefit of being lead-free. Addition of dopants shifts the phase transformation temperatures; in particular the Curie point is shifted to lower temperature. Although this is a drawback for high temperature applications, the increased ambient temperature properties could be beneficial for applications of piezoelectric materials where the service temperature is moderate. Recently, BaTiO3 has been found to possess negative bulk stiffness during the phase transformation near the Curie point.Reference Jaglinski, Kochmann, Stone and Lakes3, Reference Dong, Stone and Lakes4 Such a property has been utilized to fabricate composite materials with ultrahigh damping and stiffness.Reference Jaglinski, Kochmann, Stone and Lakes3 Yet, applications of such composite materials require the capability to tune the activation temperature (i.e., phase transformation temperatures) for the negative stiffness behavior of the inclusion. Therefore, shifting the Curie point of BaTiO3 via doping shed a light on both electrical and mechanical applications. This article deals with mechanical properties of BaZrO3–BaTiO3 system. In particular, sigmoid anomalies in Poisson’s ratio and bulk modulus were observed in doped materials near transition temperatures. Sigmoid anomaly means “S” shape in which a down peak is adjacent to an up peak [theoretical results shown in Fig. 5(f)]. To the best of our knowledge, such effects are not predicted by standard theories for phase transformations nor have they heretofore been experimentally observed. Negative stiffness microregions close to BaZrO3-rich zones are considered as a cause. Such anomalies may be used in the design of smart composites and are pertinent for conventional applications of doped ferroelectrics in that they may affect the device performance.
II. EXPERIMENTAL PROCEDURE
The ceramic samples were synthesized by conventional solid state reaction method. Precursor powders BaZrO3 (Alfa Aesar, 99% metal basis, 1–2-μm particle size) and BaTiO3 (Alfa Aesar, 99.7% metal basis, <2-μm particle size) powders were wet milled with DuPont™ Vertrel® XF cleaning agent in a silicon nitride vial for 30 min with a high-energy milling machine (SPEX SamplePrep 8000-series Mill/Mixer, Metuchen, NJ). 3644 Ultrabind binder (SPEX CertiPrep PrepAid™, Metuchen, NJ) was then added into the vial and mixed for another 3 min. Binder of 10–15% by weight was typically used, which produced samples with densities about 70–75% theoretical values. High density 8 mol% BaZrO3–BaTiO3 sample (about 92% theoretical value) was obtained by adding only 1% binder by weight. A reduction in binder increases the final density at the expense of a friable green pellet. Powders were pressed into a pellet of ø28.5 × 5 mm under a uniaxial pressure 110 MPa. Solid state reaction was performed in air at 800 °C for 4 h, followed by sintering (at atmospheric pressure) in air for 10 h at 1400 °C. To facilitate composition homogeneity, four extra ball milled sintering steps were performed with the same procedures as the first. A heating rate of 3 °C/min and a cooling rate of 4 °C/min were applied. Samples were kept inside an alumina crucible covered with an alumina lid and buried inside BaTiO3 powder to avoid possible contamination during sintering.
Standard powder x-ray diffraction (XRD) analysis (Scintag PAD V XRD) has been performed to check the phase purity and to determine the lattice parameters for the doped BaTiO3. XRD spectrum of the pure BaTiO3 has been incorporated for comparison. During cooling, the crystalline symmetry decreases and leads to the splitting of degenerate cubic diffraction peaks. For the tetragonal phase, the {100} peaks split into (100) and (001); for the orthorhombic phase, the {100} peaks split into (100), (010), and (001); and for the rhombohedral phase, the {111} peaks split into (111) and  .
Samples for optical micrographs were wet-ground using silica sanding paper, with coarse polishing done using a 1.0-μm diamond paste and fine polishing using a 0.03–0.06-μm colloidal silica solution. 100 ml of 5% HCl with several droplets of 48% hydrofluoric acid (HF) served as the etchant following the method of Kulcsar.Reference Kulcsar5 Reflection optical microscopy observation (Nikon Eclipse 80i light microscope with Nikon DXM1200F digital camera, Tokyo, Japan) has then been performed.
Dielectric measurements were performed to determine transition temperatures with a simple bridge circuit. Unpolarized samples with a typical size of 3 × 2 × 0.8 mmReference Jaglinski, Kochmann, Stone and Lakes3 were coated on two opposite surfaces with conductive electrodes by gold sputtering and connected in series with a capacitor of 1000 pF. A lock-in amplifier (Stanford Research System SR850, Sunnyvale, CA) served as both signal generator and receiver. The samples used for the dielectric measurements are about 70–75% theoretical densities; although the stronger depolarization field in porous ceramic will lower the dielectric constant, the results are comparable to get meaningful information of the BaZrO3 doping effect.
Viscoelastic properties (internal friction, shear, and Young’s moduli) of unpolarized BaZrO3 doped BaTiO3 ceramics were studied via broadband viscoelastic spectroscopy.Reference Lee, Lakes and Lal6 Specimens of 1 × 1.5 × 15 mm3 were cut with a low speed diamond saw. The specimens were sputter-coated with gold. Broadband viscoelastic spectroscopy is capable of studying viscoelastic properties of materials over 11 decades of time and frequency in an isothermal environment or by scanning a single frequency over time while the temperature is varied. One end of the specimen is attached to a massive (25-mm diameter) stainless steel support rod, and the other end of the specimen is connected to a permanent magnet. Torque was applied by driving an AC voltage across the appropriate set of Helmholtz coils using a lock-in amplifier (Stanford Research Systems SR850). This Helmholtz coil imposed a magnetic field on the permanent magnet and transmitted an axial torque on the specimen. The angular displacement of the specimen was measured using a laser light reflected from a mirror mounted on the magnet to a wide angle, 2 axis silicon sensor (DL100-7PCBA; Pacific Silicon Sensor Inc., Westlake, CA) with a detector area of 1 cm2. The detector signal was amplified with a wideband differential amplifier. Torque was inferred from the Helmholtz coil current as follows. Calibration experiments were done using the well-characterized type Al-6061 alloy, which has well-known moduli. Viscoelastic properties of the specimen below resonance were inferred from the amplitude and phase measurements from the lock-in amplifier and were confirmed via phase measurements upon elliptic Lissajous figures of torque signal versus angular displacement signal. Temperature was controlled via electrical input to resistance heaters, which warmed a suitable amount of flowing air directed into the apparatus. The air flow subsequently served to heat up the specimen. Temperature was monitored with a thermocouple (OMEGA L-0044 K type) directly in contact with the specimen surface in both dielectric and viscoelastic measurements. Bulk modulus and Poisson’s ratio are calculated via equations assuming the material is isotropic: ν = E/2G−1 and K = E/3(1−2ν), in which E, G, K, and ν represent Young’s modulus, shear modulus, bulk modulus, and Poisson’s ratio, respectively. Samples for dielectric and viscoelastic measurements have been preaged for 3–4 h at about 50 °C above the Curie point prior to testing so as to eliminate the oxygen vacancy configuration effect on the phase transformations (transition temperatures will be several degrees lower if enough aging is performed above the Curie point).Reference Sun, Ren and Otsuka7
III. RESULTS AND DISCUSSION
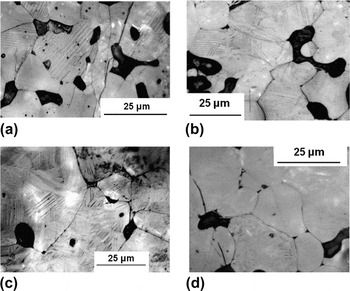
Figure 1 is the optical micrographs of 0 mol%, 4 mol%, 8 mol%, and 12 mol% BaZrO3–BaTiO3 samples showing an average grain size about 25 μm. Much more complex 90° domain structures have been observed in doped BaTiO3 compared with pure material. In these, 0 mol%, 4 mol%, and 12 mol% BaZrO3–BaTiO3 are about 75% theoretical densities, 8 mol% BaZrO3–BaTiO3 is about 92% theoretical density.
Micrographs of (a) 0 mol%, (b) 4 mol%, (c) 8 mol%, and (d) 12 mol% BaZrO3–BaTiO3 specimens prepared in this study. 0 mol%, 4 mol%, and 12 mol% BaZrO3–BaTiO3 samples shown here are about 75% theoretical densities. 8 mol% BaZrO3–BaTiO3 sample shown here is about 92% theoretical density.

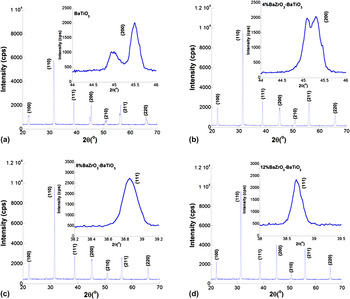
Figure 2 shows the XRD spectra of the doped and pure BaTiO3 at room temperature. The splitting of the {100} (or {200}) peak in the pure BaTiO3 XRD spectrum indicates a tetragonal phase. The splitting of the {100} (or{200}) peak (in tetragonal or orthorhombic phase) or {111} peak (in rhombohedral phase) in the doped BaTiO3 is not easy to be distinguished, but the unsymmetrical characteristic of the {100} (or{200}) or the {111} peaks is detectable, indicating either an orthorhombic or rhombohedral phase. This is not surprising, as Avrahami and TullerReference Avrahami and Tuller8,Reference Avrahami and Tuller9 have found that distortions are rather small to be resolved by XRD. Since the optical microscopy observation reveals the presence of domains, and the dielectric and viscoelastic measurements (will be shown later) reveal the ferroelectric transformations at higher temperatures, it is safe to say that the doped BaTiO3 is in the ferroelectric state at room temperature. Lattice parameters have been calculated as follows according to the methods of Avrahami and TullerReference Avrahami and Tuller9: Lattice parameters: BaTiO3, tetragonal symmetry, a = b = 3.987Å, c = 4.032Å; 4 mol% BaZrO3–BaTiO3, orthorhombic symmetry, a = 3.990Å, b = 4.003Å, c = 4.020Å; 8 mol% BaZrO3–BaTiO3, rhombohedral symmetry, a = b = c = 4.020Å, α = β = γ≥89.99°; 12 mol% BaZrO3–BaTiO3, rhombohedral symmetry, a = b = c = 4.034Å, α = β = γ≥89.99°.
Room temperature (25 °C) x-ray diffraction spectra of (a) 0 mol%, (b) 4 mol%, (c) 8 mol%, and (d) 12 mol% BaZrO3–BaTiO3 ceramics. The insets are zoom in {200} or {111} peaks. 0 mol%, 4 mol%, and 12 mol% BaZrO3–BaTiO3 samples shown here are about 75% theoretical densities. 8 mol% BaZrO3–BaTiO3 sample shown here is about 92% theoretical density.

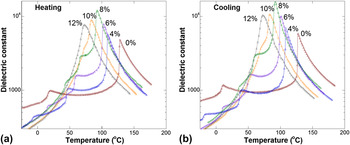
Figure 3 shows the dielectric behavior of BaZrO3–BaTiO3 samples (70–75% theoretical densities) at 10 kHz. Dielectric constant (k) is lower than pure BaTiO3 in the doped material but shows a maximum when the BaZrO3 concentration is 8 mol%. k is much higher near the Curie point in doped materials. This is attributed to the internal stress built up around BaZrO3 unit cells (see Fig. 6). Internal stress will increase 90° domain wall areas and hence increase the dielectric constant as domain wall vibration (i.e., orientational polarization) contributes to dielectric constant.Reference Arlt and Hennings10 The other contributing component to dielectric constant is the lattice vibration (i.e., ionic polarization).Reference Hoshina, Takizawa, Li, Kasama, Kakemoto and Tsurumi11 The cubic-to-rhombohedral transition involves a subtle shear deformation without a strong lattice expansion/shrink involved during the cubic-to-tetragonal transition, ions in the lattice are under more constraint; therefore, k max decreases when BaZrO3 concentration surpasses 8 mol% due to the progressive merging of the three transformations with increasing dopant concentration. The dielectric spectrum indicates that the ceramics prepared in this study are single phase at a macrolevel, as otherwise, a transformation peak will always show up near 130 °C.
Dielectric constants of BaZrO3–BaTiO3 system at 10 kHz in (a) heating and (b) cooling. A thermal rate of 0.03 °C/s was applied. Densities of these samples are about 70–75% theoretical values.

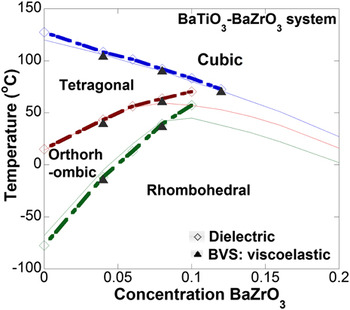
A phase diagram is established based on the present results (Fig. 4). Transition temperatures were determined as the average of peak (dielectric constant and internal friction) temperatures in heating and cooling. Transition temperatures in viscoelastic measurements are lower than dielectric tests as peak temperature in internal friction corresponds to a state with 45 vol% transformed parent phase.Reference Zhang, Fung and Zeng14 Transition temperatures match very well with Kell and Hellicar’sReference Kell and Hellicar13 results at lower BaZrO3 concentration. Phase boundaries differ at higher dopant concentration (>8 mol%). The three transformations merge at a BaZrO3 concentration close to 12 mol% according to our study. Indeed, Kell and HellicarReference Kell and Hellicar13 stated that the phase boundaries should merge together with increasing BaZrO3 concentration. Avrahami and TullerReference Avrahami and Tuller8 gave a schematic phase diagram for BaZrO3–BaTiO3 system, but stated that it was not necessarily drawn to scale.
Phase diagram of BaZrO3–BaTiO3 system (the rhombohedral-to-orthorhombic transition temperature for pure BaTiO3 is obtained from Ref. Reference Kinoshita and Yamaji12). Thin solid lines are after Ref. Reference Kell and Hellicar13. Thick dash lines are obtained from this study. Samples used here are about 70–75% theoretical densities.

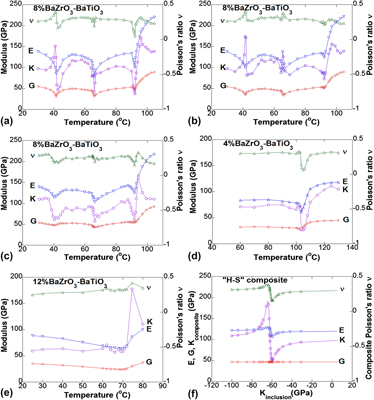
Figure 5 shows the moduli and Poisson’s ratio of BaZrO3–BaTiO3 systems at different strain levels and frequencies: (a) 8 mol% BaZrO3–BaTiO3 at 0.1Hz excitation frequency with maximum surface strain 5 × 10⁻⁶; (b) 8 mol% BaZrO3–BaTiO3 at 0.1 Hz excitation frequency with maximum surface strain 8 × 10⁻⁵; (c) 8 mol% BaZrO3–BaTiO3 at 10 Hz excitation frequency with maximum surface strain 5 × 10⁻⁶; (d) 4 mol% BaZrO3–BaTiO3 at 0.1Hz excitation frequency with maximum surface strain 5 × 10⁻⁶; and (e) 12 mol% BaZrO3–BaTiO3 at 0.1Hz excitation frequency with maximum surface strain 5 × 10⁻⁶. Densities of 4 mol%, 8 mol%, and 12 mol%BaZrO3–BaTiO3 are about 75%, 92%, and 75% theoretical values, respectively. Thermal rate for low density ceramic was about 0.004 °C/s and that for high density ceramic was about 0.01 °C/s. Both Young’s modulus E and shear modulus G in 4 mol% [Fig. 5(d)] and 8 mol% [Figs. 5(a)–5(c)] BaZrO3–BaTiO3 exhibited strong softening as well as sigmoid anomalies in Poisson’s ratio ν and bulk modulus K during transformation(s). Sigmoid anomalies in ν and K were also observed in 12 mol% BaZrO3–BaTiO3, but the softening in E and G are not prominent [Fig. 5(e)]. Stiffening effect in the sigmoid anomaly tends to increase with BaZrO3 concentration, frequency [Fig. 5(c)], and strain level [Fig. 5(b)]. By contrast, softening of bulk modulus and negative Poisson’s ratio were observed in pure BaTiO3 near the Curie point,Reference Dong, Stone and Lakes4 but in pure material, no sigmoid anomalies in K and ν occurred; also shear modulus does not soften much near the Curie point.Reference Dong, Stone and Lakes4 It should be noted here that according to the composite theory, porosity only lowers the modulus magnitude rather than having any effect on the temperature or frequency dependence of the viscoelastic anomaly near the phase transformations. The conclusions are not altered by the presence of porosity.
Modulus and Poisson’s ratio of BaZrO3–BaTiO3 systems at various frequency (f) and maximum surface strain (ε max). (a) 8 mol% BaZrO3–BaTiO3, f = 0.1 Hz, ε max = 5 × 10⁻⁶; (b) 8 mol% BaZrO3–BaTiO3, f = 0.1 Hz, ε max = 8 × 10⁻⁵; (c) 8 mol% BaZrO3–BaTiO3, f = 10 Hz, ε max = 5 × 10⁻⁶; (d) 4 mol% BaZrO3–BaTiO3, f = 0.1 Hz, ε max = 5 × 10⁻⁶; (e) 12 mol% BaZrO3–BaTiO3, f = 0.1 Hz, ε max = 5 × 10⁻⁶. (f) Theoretical composite modulus and Poisson’s ratio versus inclusion bulk modulus in “Hashin-Shtrikman” composite.

The reason for sigmoid anomalies is found in composite analysis originally done for the design of materials with extreme properties.Reference Lakes15 Composite material with negative bulk modulus particulate inclusions can give rise to sigmoid anomalies in composite moduliReference Verbitshais, Zhdanov, Venevtsev and Solsviev16 via analysis using the Hashin–Shtrikman ‘lower’ formulae:


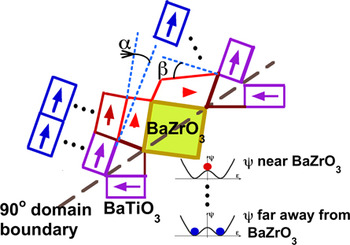
in which 1 represents inclusion, 2 presents matrix, G, K, and V represent shear modulus, bulk modulus, and volume fraction, respectively. Assuming 1 vol% inclusion, G 2 = 46.15 GPa, K 2 = 100 GPa, tanδ2 = 0.03, tanδ1 = 0, G 1 = 50 GPa, the calculated sigmoid anomalies in Poisson’s ratio and bulk modulus are shown in [Fig. 5(f)] and have similar character to experimental results. Negative stiffness can occur in systems with stored elastic energy,Reference Lakes15 including, via Landau theory, materials that undergo phase transformations under constraint. Such effects have been predicted to appear naturally on a fine (nano) scale.Reference Yoshimoto, Jain, Workum, Nealey and de Pablo17 In doped ceramic, negative stiffness heterogeneity can occur according to the following philosophical paradigm. Negative stiffness in the vicinity of phase transformation is due to the reverse curvature in the Landau free energy versus strain profile under constraint. Such a negative curvature in free energy curve can also be achieved if the system has stored elastic energy. BaZrO3 is in the ideal cubic perovskite structure with no structural transformation below its melting point and has a unit cell volume 1.095 times that of tetragonal BaTiO3Reference Goretta, Park, Koritala, Cuber, Pascual, Chen, de Arellano-López and Routbort18 and a stiffness (E) about 2.4 times that of tetragonal BaTiO3. The doping of BaZrO3 will introduce internal stress due to misfit strain, change the BaTiO3 lattice parameters, and hence shift the transformation temperatures. The composite theory assumes a hierarchical morphology of spherical inclusions with identical properties; it approximates composites with a dilute concentration of identical spherical inclusions. In actual materials, the inclusions may not be identical as a result of heterogeneity in local composition. Such heterogeneity can broaden the response versus temperature. The transition temperatures of the ceramic are determined by the majority BaTiO3 unit cells far away from BaZrO3 centers. BaZrO3 is considered to locate at 90° domain boundary as forming 90° domains is the best way to relieve the internal stress, identical to the mechanism to release the transformation stress in pure BaTiO3. Figure 6 gives a schematic configuration inside a BaZrO3 rich region. Formation of such a configuration can be simply regarded as the result of substitution of Ti4+ ions (ionic radius ∼0.605Å) with Zr4+ ions (ionic radius ∼0.72Å). BaTiO3 unit cells in the immediate vicinity of BaZrO3 will be shear deformed (such a lattice deformation configuration has been predicted in fine-grain BaTiO3 near the grain boundary due to the internal stressReference Kinoshita and Yamaji12: crystal symmetry transforms from cubic to pseudocubic to orthorhombic and then to tetragonal from grain boundary deep into the grain center) by an angle α/β with respect to BaTiO3 unit cells far away from BaZrO3, gives rise to stored elastic energy. This will favor a snap-through effect if perturbation is available. “Snap-through” refers to the response of buckled systems through regions of instability. To illustrate snap through, compress a plastic ruler until it buckles to form a curve. Press from the side at the center of the convex surface. The ruler will snap through to a convex shape on the other side. Similar buckling occurs on the interatomic scale in the vicinity of solid to solid phase transformations. The classic Landau energy profiles for phase transformation also describe macroscopic buckled systems. Perturbation due to the lattice reconstruction during phase transformations will alter the free energy of the lattice near BaZrO3 rich regions to move from the potential hill down to the well(s). A negative stiffness effect is entailed during this process. Stiffening effect in sigmoid anomaly is attributed to an adequate negative stiffness value [Fig. 5(f)] at the BaZrO3-rich zones. The stored elastic energy will increase with increasing dopant concentration; this will favor a more negative curvature on the free energy curve with double potential wells, hence a more negative stiffness value at the fine scale. Higher excitation frequency and strain can be regarded as stronger perturbations, which would also favor a steep negative curvature on the free energy curve, and hence a stronger stiffening effect in the sigmoid anomalies.
Schematic of lattice structures near 90° domain wall. One BaZrO3 substituted BaTiO3 at the 90° domain boundary. In the immediate vicinity of regions rich in BaZrO3, BaTiO3 unit cells are shear deformed. Far away from BaZrO3 rich regions, BaTiO3 unit cells are less stressed. The arrows schematically represent the magnitudes and directions of spontaneous polarizations. Free energy profiles in the vicinity and far away from BaZrO3 are illustrated inset. Ball at the top of the potential hill indicates the lattice near BaZrO3 is in metastable condition; whereas the balls at the bottom of potential wells indicate the lattice far away from BaZrO3 is in stable condition. In real condition, a single BaZrO3 unit cell can be replaced by BaZrO3 agglomerates, and the conclusion will not be altered.

IV. CONCLUSIONS
BaZrO3–BaTiO3 ceramics exhibit a shift in transformation temperatures as revealed by dielectric and viscoelastic spectroscopy; a phase diagram has been established. Introduction of BaZrO3 increased dielectric constants near the Curie point and entailed negative stiffness microregions, which in turn gave rise to sigmoid anomalies in Poisson’s ratio and bulk modulus during phase transformations. Such effects are attributed to the internal stress built up near the BaZrO3 centers.
ACKNOWLEDGMENT
Supports by the National Science Foundation-Materials Research Science and Engineering Center (NSF-MRSEC) and by NSF are gratefully acknowledged.