





1. Introduction
Electro-osmosis refers to the induced movement of a liquid through electrically charged porous materials when subjected to an external electric field (Bhattacharyya, Zheng & Conlisk Reference Bhattacharyya, Zheng and Conlisk2005; Squires & Bazant Reference Squires and Bazant2006; Biscombe Reference Biscombe2017). This electrokinetic process results in a net fluid motion, which is commonly known as electro-osmotic flow (EOF; see Gubbiotti et al. Reference Gubbiotti, Baldelli, Di Muccio, Malgaretti, Marbach and Chinappi2022). Over the past decades, extensive scholarly research has been conducted to investigate EOF in microchannels and nanochannels, and has given rise to a diverse range of practical applications such as fluid pumping (Ai et al. Reference Ai, Yalcin, Gu, Baysal, Baumgart, Qian and Beskok2010), underground environmental remediation (Alshawabkeh, Yeung & Bricka Reference Alshawabkeh, Yeung and Bricka1999; Ma et al. Reference Ma, Su, Qian, Wang, Meng, Ge, Ye and Song2020), nanopore sensing (Varongchayakul et al. Reference Varongchayakul, Huttner, Grinstaff and Meller2018), biological delivery (Mondal & Shit Reference Mondal and Shit2017; Xu et al. Reference Xu, Nazeer, Hussain, Khan, Hameed, Shah and Chung2021), blue energy harvesting (Siria, Bocquet & Bocquet Reference Siria, Bocquet and Bocquet2017) and charged species transport across membranes or through porous media (Bondarev, Melnikov & Zabolotskiy Reference Bondarev, Melnikov and Zabolotskiy2023), to name a few.
Since the discovery of EOF in 1807 by Ferdinand Friedrich Reuss, studies have investigated extensively the EOF of simple electrolyte solutions inside micro/nanoscale channels and uncovered its characteristics (Vlassiouk, Smirnov & Siwy Reference Vlassiouk, Smirnov and Siwy2008; Zhao & Yang Reference Zhao and Yang2012; Feng et al. Reference Feng, Huang, Wong and Duan2017; Alizadeh et al. Reference Alizadeh, Hsu, Wang and Daiguji2021). More recently, in the past decade, the EOF of complex liquids has garnered tremendous attention due to its wide use in microfluidic devices that are widely expected to have a revolutionary impact on traditional chemical and biomedical analyses (Das & Chakraborty Reference Das and Chakraborty2006; Tang et al. Reference Tang, Li, He and Tao2009; Zhao & Yang Reference Zhao and Yang2013; Xu et al. Reference Xu, Nazeer, Hussain, Khan, Hameed, Shah and Chung2021). In particular, existing studies of EOF of complex liquids mostly assumed that the liquids obey certain types of non-Newtonian constitutive laws (Tang et al. Reference Tang, Li, He and Tao2009; Zhao & Yang Reference Zhao and Yang2013; Alizadeh et al. Reference Alizadeh, Hsu, Wang and Daiguji2021), such as power law (Das & Chakraborty Reference Das and Chakraborty2006; Zhao et al. Reference Zhao, Zholkovskij, Masliyah and Yang2008; Ng & Qi Reference Ng and Qi2014; Hao et al. Reference Hao, Tang, Peng, Liu, Zhou and Li2024), Carreau law (Ghosh, Chaudhury & Chakraborty Reference Ghosh, Chaudhury and Chakraborty2016; Ko et al. Reference Ko, Li, Malekanfard, Wang, Fu and Xuan2019; Noreen et al. Reference Noreen, Waheed, Hussanan and Lu2019; Ghiya & Tiwari Reference Ghiya and Tiwari2024), Phan–Tien law (Martínez et al. Reference Martínez, Bautista, Escandón and Méndez2016; Karan, Chakraborty & Chakraborty Reference Karan, Chakraborty and Chakraborty2018; Sarma et al. Reference Sarma, Deka, Sarma and Mondal2018; Chen et al. Reference Chen, Li, Chen, Zhang, Zhang and Ma2019), Oldroyd-B law (Aziz, Mukarram & Kashif Reference Aziz, Mukarram and Kashif2020; Panchun, Shaowei & Moli Reference Panchun, Shaowei and Moli2020; Ji, Qian & Liu Reference Ji, Qian and Liu2021) or Casson law (Ng Reference Ng2013; Murtaza et al. Reference Murtaza, Kumam, Ahmad, Sitthithakerngkiet and Ali2022; Srivally & Reza Reference Srivally and Reza2023). These works did not consider the microscopic details of non-Newtonian fluids, and considered that the liquids homogeneously obey the same non-Newtonian constative law in the entire flow domain. These treatments neglect the fact that non-Newtonian liquids are practically formed by dispersing particulate materials in Newtonian base liquids, and potentially become inhomogeneous under confinement (Li & Wu Reference Li and Wu2006; Jiang et al. Reference Jiang, Ginzburg and Wang2018, Reference Jiang, Ginzburg and Wang2019). The inhomogeneity in liquid properties would modify the EOF substantially, and this could be the reason why there is not yet a theoretical study that compares quantitatively well with the existing experiments.
The EOF pertaining to one special type of complex fluid, i.e. polyelectrolyte (PE) solutions, has received growing interest due to the unique properties of PEs (Manning Reference Manning1978; Dobrynin & Rubinstein Reference Dobrynin and Rubinstein2005; Yethiraj Reference Yethiraj2009; Lopez et al. Reference Lopez, Colby, Graham and Cabral2017) as well as their diverse applications, such as colloid stability control, water treatment, biotechnology and energy engineering (Adachi & Xiao Reference Adachi and Xiao2013; vander Straeten et al. Reference vander Straeten, Bratek-Skicki, Germain, D’Haese, Eloy, Fustin and Dupont-Gillain2017; DuChanois et al. Reference DuChanois, Epsztein, Trivedi and Elimelech2019). A large fraction of the studies of PE-related EOF focused on cases in which the microchannel and nanochannel walls are grafted with PEs (Li et al. Reference Li, Jian, Chang, Zhao and Yang2016; Bhattacharyya & Bag Reference Bhattacharyya and Bag2019; Li & Jian Reference Li and Jian2019; Roy, Bhattacharjee & De Reference Roy, Bhattacharjee and De2020; Sivasankar et al. Reference Sivasankar, Etha, Sachar and Das2021; Talebi, Ashrafizadeh & Sadeghi Reference Talebi, Ashrafizadeh and Sadeghi2021), and such treatment leads to modifications of the surface charge density on the channel wall and then the EOF. The flowing media in these studies are still the simple electrolyte solutions.
Another category of EOF involving PEs concerns the use of the aqueous solutions of PEs as the flowing media in microchannels and nanochannels (Olivares, Vera-Candioti & Berli Reference Olivares, Vera-Candioti and Berli2009; Uematsu & Araki Reference Uematsu and Araki2013; Feng & Wong Reference Feng and Wong2019; Bagchi & Olvera de la Cruz Reference Bagchi and Olvera de la Cruz2020). The EOF of PE solutions in microchannels and nanochannels has been relatively underexplored, potentially due to the complex nature and inhomogeneities of PE solutions under extreme confinement. The theoretical modelling of the EOF in these contexts requires the mathematical descriptions of both electric double layer (EDL) and viscous properties of solutions, which are straightforward for simple electrolyte solutions (Alizadeh et al. Reference Alizadeh, Hsu, Wang and Daiguji2021). However, for PE solutions, accurate modelling of the EDL structure and viscous properties becomes challenging. This difficulty arises from the intricate interplay between the conformational and electrostatic properties of the PE solutions, and the significant absorption or depletion characteristics of PEs on channel walls (Uzum, Christau & von Klitzing Reference Üzüm, Christau and von Klitzing2011; Uezuem, Makuska & von Klitzing Reference Üzüm, Makuska and von Klitzing2012). Moreover, unlike simple electrolytes, the application of an electric field has a much more significant impact on polymer solutions, such as the deformation of the depletion or adsorption layer, or the lift effect in the shear flow (Uematsu Reference Uematsu2015; Perez Ocampo et al. Reference Perez Ocampo, Weiss, Jardat, Likos and Dahirel2022), hence making it harder to model the EOF system of PE solutions accurately.
Our comprehensive literature review indicates that characterisation of the EDL characteristics of PE solutions can be achieved via experiments, numerical simulation and theoretical modelling. Small-angle neutron scattering (Nierlich et al. Reference Nierlich, Boue, Lapp and Oberthür1985) and X-ray scattering (Combet, Lorchat & Rawiso Reference Combet, Lorchat and Rawiso2012) have been used to observe the EDL of PE solutions. The characteritics of EDL detected by these techniques are averaged along the EDL thickness direction and cannot capture the inhomogeneous nature of EDL. Monte Carlo simulations (Woodward & Jonsson Reference Woodward and Jonsson1991; Carrillo & Dobrynin Reference Carrillo and Dobrynin2014) and molecular dynamics simulations (Gartner & Jayaraman Reference Gartner and Jayaraman2019; Shen, Fan & Hall Reference Shen, Fan and Hall2021) can reveal the EDL charateristics of PE solutions in extreme detail. However, they require significant computational resources and may be limited by the accuracy of the force fields used to describe the interactions between the components of the system. Theoretical methods such as mean-field theory (Jiao et al. Reference Jiao, Zhang, Chuan, Yan, Zou, Wang, Yang and Zhao2022) and classical density functional theory (Jiang et al. Reference Jiang, Ginzburg and Wang2018, Reference Jiang, Ginzburg and Wang2019) have also been utilised to investigate the EDL structure of PE solutions. In particular, the mean-field theory is the most widely used theoretical approach to model the EDL of PE solutions because of its simplicity in concept and ability to characterise the major details of EDL structure (De Gennes et al. Reference De Gennes, Pincus, Velasco and Brochard1976; De Gennes Reference De Gennes, Pincus, Velasco and Brochard1982; Jiao et al. Reference Jiao, Zhang, Chuan, Yan, Zou, Wang, Yang and Zhao2022).
The viscous properties of PE solutions are complicated by the conformational and electrostatic properties of polymer chains (Dobrynin, Colby & Rubinstein Reference Dobrynin, Colby and Rubinstein1995; Lopez Reference Lopez2019; Dobrynin Reference Dobrynin2020; Matsumoto Reference Matsumoto2022). The studies of the viscous properties of PE solutions in the literature mainly focus on constructing various scaling laws. Fuoss first introduced the famous Fuoss’s law based on a large amount of experimental data to describe the viscous properteis of semi-dilute PE solutions (Fuoss Reference Fuoss1951; De Gennes et al. Reference De Gennes, Pincus, Velasco and Brochard1976). This empirical law features a scaling law
 $\eta \propto n_m^{1/2}$
in a salt-free environment, and a scaling law
 $\eta \propto n_m^{5/4}$
with added salts, where
 $\eta$
represents the viscosity of the PE solution, and
 $n_m$
represents the number of polymer monomers per volume. In addition to these scaling laws, more refined experiments (Lopez et al. Reference Lopez, Rogers, Colby, Graham and Cabral2015, Reference Lopez, Colby, Graham and Cabral2017) found new scaling laws
 $\eta \propto n_m^{0.68}$
and
 $\eta \propto n_m^{0.91}$
. In a more recent theoretical study, the mean-field theory was adopted to formulate a model that is able to recover all of the above empirical scaling laws (Chen, Perazzo & Stone Reference Chen, Perazzo and Stone2020).
Although there have been theoretical models of EDL and viscous properties of PE solutions, the combination of the two to construct a accurate theoretical model of EOF has been absent, as is a theoretical model that quantitatively agrees with existing experiments. Hence in this study, we aim to formulate a theoretical model of EOF of semi-dilute PE solutions in nanochannels by combining the EDL and viscosity models of PE solutions derived from the mean-field approach. We first validate our EOF model by comparing our predictions with the experimental results (Olivares et al. Reference Olivares, Vera-Candioti and Berli2009), then we employ our validated model to perform a comprehensive analysis of EOF of semi-dilute PE solutions in nanochannels, including the discovery of noticeable EOF in uncharged nanochannels, and the elucidation of various wall effects on the EOF characterisitics.
The paper is organised as follows. Section 2 is divided into two parts: the first part depicts the system that we considered and demonstrates the models of PE solutions as well as the SCFT (self consistent field theory) that we utilise in our work; the second part describes the governing equations of EOF in the system, and elaborates the model for describing the viscosity distribution of PE solutions. In § 3, we first validate our model with the experimental results, then demonstrate the generation of the EOF in semi-dilute PE solutions in uncharged nanochannels, and reveal the influence of various parameters on this counterintuitive EOF. Then we discuss various wall effects, including surface charge density, slip length and adsorption length, on the characteristics of EOF. Finally, we summarise the main findings and point out the direction for improving the current model in § 4.
2. Mathematical formulation
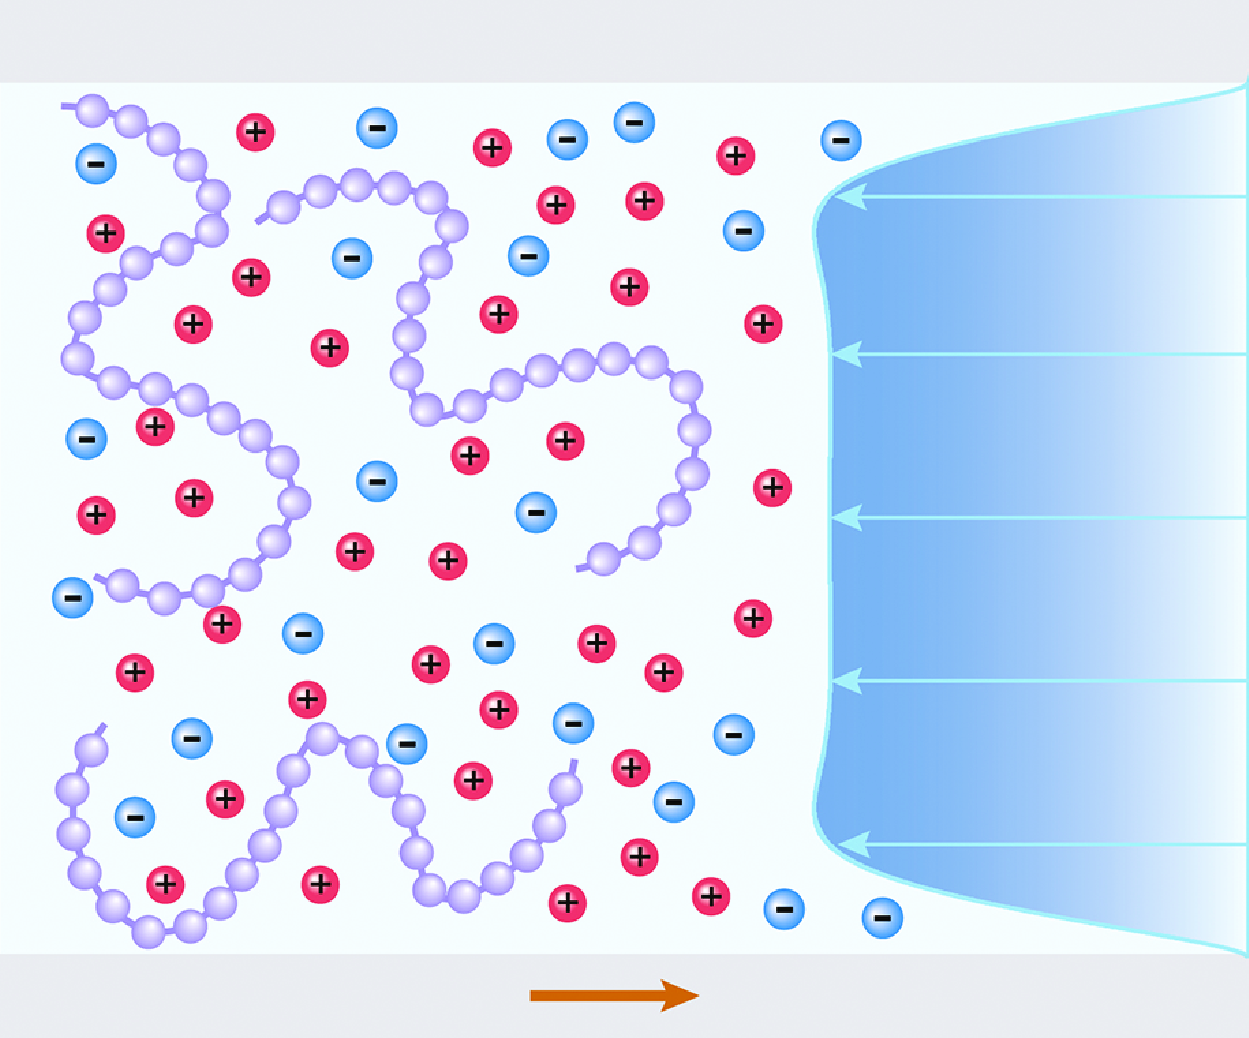
The system that we considered consists of two planar surfaces that form a slit nanochannel with height
 $2H$
and length
 $L$
(here,
 $L/2H\gg 1$
and the end effect can be neglected); see figure 1. The slit nanochannel is filled with a semi-dilute aqueous solution of PE chains with salt added. The PE is negatively charged with a fixed charge fraction of
 $f$
, and the polymerisation degree of each polymer chain is fixed at
 $N_{{p}}$
(where
 $N_{{p}}\gg 1$
). For simplicity, the salts in this work are symmetric
 $1:1$
simple electrolytes with bulk concentration
 $c_{{s}}$
. And the cations are treated as identical to the counterions released by dissolved PEs. The solvent – which refers to water in this work– is treated as a continuum dielectric background with a uniform dielectric constant
 $\epsilon _{{w}}$
. Hence the components in the PE solution in figure 1 can be simply classified into three species, namely dissolved polyanions, small anions and small cations. Due to physicochemical reactions, the two nanochannel walls acquire surface charge density
 $\sigma$
. Although the electrically neutral case (i.e.
 $\sigma =0$
) is considered as the main focus in this study, cases with negatively or positively charged surfaces have also been taken into consideration for comparative studies. In this work, the nanochannel has a sufficiently large length-to-height aspect ratio, namely,
 $L\gg 2H$
. Therefore, the end effects can be neglected, and the original two-dimensional problem can be simplified to a one-dimensional problem along the channel height direction. All variables to be solved vary only along the
 $z$
direction. Hence when an external electric field
 $E$
is applied along the nanochannel surfaces in the
 $x$
direction, an EOF is generated in the system and is governed by a simplified form of the Navier–Stokes equation (Uematsu & Araki Reference Uematsu and Araki2013):
 \begin{equation} \frac {\rm d}{{\rm d} z}\left[\eta (z)\,\frac {{\rm d} v_x(z)}{{\rm d} z}\right]+\rho (z)\, E=0, \end{equation}
where
 $ v_x(z)$
is the
 $x$
component of the EOF field, and varies along the
 $z$
axis only. From (2.1), one can observe that the EOF is jointly controlled by two factors, namely the local space charge density
 $\rho (z)$
, and the local dynamic viscosity
 $\eta (z)$
.
Schematic of a charged slit nanochannel filled with a PE solution. An electrical field
 $E$
is applied along the slit nanochannel walls in the
 $x$
direction. An EOF can occur in the system, with a possible velocity profile
 $v_x$
shown graphically.

2.1. Mean-field theory for EDL structure
To describe the potential EOF in the system shown in figure 1, we should first have a knowledge of the EDL structure in the PE solution. Here, we adopt the mean-field theory to obtain the density profiles of each component in the PE solution system, which is a prerequisite for estimating the net charge density and the electric body force that the fluid experiences.
The essence of the theory is to establish an analytical expression for the total free energy
 ${\mathcal{F}}$
of the whole system. In this work,
 ${\mathcal{F}}$
can be written as the sum of three parts:
 \begin{equation} {\mathcal{F}}={\mathcal{F}}_{p}({\boldsymbol{r}})+{\mathcal{F}}_{i}({\boldsymbol{r}})+{\mathcal{F}}_{c}({\boldsymbol{r}}), \end{equation}
where
 ${\boldsymbol{r}}$
is the position vector in the system.
In (2.2),
 ${\mathcal{F}}_{{p}}({\boldsymbol{r}})$
refers to the free energy contributed by polymer chains, and it can be further written as (Podgornik Reference Podgornik1992; Borukhov, Andelman & Orland Reference Borukhov, Andelman and Orland1998; Shafir, Andelman & Netz Reference Shafir, Andelman and Netz2003)
 \begin{equation} \beta\, {\mathcal{F}}_{{p}}({\boldsymbol{r}})=\int {\rm d}{{\boldsymbol{r}}}\, \dfrac {a^2}{6}|\,\boldsymbol{\nabla} \phi ({\boldsymbol{r}})|^{2}+\int {\rm d}{{\boldsymbol{r}}}\, \dfrac {\nu }{2}\left(\phi ^{4}({\boldsymbol{r}})-\phi _{{b}}^{4}\right)-\beta \int {\rm d}{{\boldsymbol{r}}}\,\mu _{{p}}\left(\phi ^{2}({\boldsymbol{r}})-\phi _{{b}}^{2}\right), \end{equation}
where
 $\beta =1/k_{{B}}T$
represents the inverse of thermal energy, with
 $k_{{B}}$
the Boltzmann constant, and
 $T$
the absolute temperature of the system. Here,
 $a$
is the intrinsic Kuhn length of the polymer chain, which can also be treated as the effective separation length of adjacent monomers;
 $\phi ({\boldsymbol{r}})=\sqrt {c_{{b}}({\boldsymbol{r}})}$
is the order parameter of local monomer concentration
 $c_{{b}}({\boldsymbol{r}})$
, which varies due to nano-confinement;
 $\phi _{{b}}=\sqrt {c_{{b}}}$
, with
 $c_{{b}}$
the monomer bulk concentration;
 $\nu$
is the second-virial coefficient characterising the excluded volume effect of polymer chains;
 $\mu _{{p}}$
is the chemical potential of the polymer. In (2.3), the three terms on the right-hand side come from the elastic energy, the excluded volume effect of the polymer chains, and the coupling with the bulk concentration, respectively.
In (2.2),
 ${\mathcal{F}}_{{i}}({\boldsymbol{r}})$
refers to the free energy of the entropic contribution by small ions and their chemical potentials, which can be further written as (Podgornik Reference Podgornik1992; Borukhov et al. Reference Borukhov, Andelman and Orland1998; Shafir et al. Reference Shafir, Andelman and Netz2003)
 \begin{align} & \beta {\mathcal{F}}_{{i}}({\boldsymbol{r}}) = \! \int\! {\rm d}{{\boldsymbol{r}}}\, [c_{{+}}({\boldsymbol{r}})\,({\ln}(c_{{+}}({\boldsymbol{r}})-1)-c_{{+,b}}({\ln}(c_{{+,b}})-1)]-\beta \! \int\! {\rm d}{{\boldsymbol{r}}}\, \mu _{+}(c_+({{\boldsymbol{r}}})-c_{{+,b}})\nonumber \\ & \quad +\, \! \int\! {\rm d}{{\boldsymbol{r}}} [c_{{-}}({\boldsymbol{r}})\,({\ln}(c_{{-}}({\boldsymbol{r}})-1)-c_{{-,b}}({\ln}(c_{{-,b}})-1)]-\beta \! \int\! {\rm d}{{\boldsymbol{r}}}\, \mu _{-}(c_-({{\boldsymbol{r}}})-c_{{-,b}}), \end{align}
where
 $c_{{+}}({\boldsymbol{r}})$
and
 $c_{{-}}({\boldsymbol{r}})$
represent the local concentrations of small cations and anions, respectively,
 $\mu _{+}$
and
 $\mu _{-}$
are the chemical potentials of small ions, respectively, and
 $c_{{+,b}}$
and
 $c_{{-,b}}$
are the bulk concentrations of small cations and small anions. In this system,
 $c_{{-,b}}=c_{{s}}$
and
 $c_{{+,b}}=fc_{{b}}+c_{{s}}$
.
In (2.2),
 ${\mathcal{F}}_{{c}}({\boldsymbol{r}})$
refers to the electrostatic free energy of the whole system, which can be further written as (Uematsu & Araki Reference Uematsu and Araki2013; Jiao et al. Reference Jiao, Zhang, Chuan, Yan, Zou, Wang, Yang and Zhao2022)
 \begin{equation} \beta\, {\mathcal{F}}_{{c}}({\boldsymbol{r}})=\beta \int {\rm d}{{\boldsymbol{r}}}\, \rho ({\boldsymbol{r}})\,\psi ({\boldsymbol{r}})-\beta \int {\rm d}{{\boldsymbol{r}}}\, \dfrac {\epsilon _0\epsilon }{2}\,|\boldsymbol{\nabla} \psi ({\boldsymbol{r}})|^{2}, \end{equation}
where
 $\rho ({\boldsymbol{r}})=e[c_{{+}}({\boldsymbol{r}})-c_{{-}}({\boldsymbol{r}})-f\,\phi ^{2}({\boldsymbol{r}})]$
is the local net charge density, with
 $e$
the elementary charge. Here,
 $\psi ({\boldsymbol{r}})$
is the local electrostatic potential,
 $\epsilon _0$
is the vacuum permittivity, and
 $\epsilon$
is the relative permittivity of the PE solution. The relative dielectric permittivity of the solution is usually defined as (Nakamura Reference Nakamura2018)
 $\epsilon =\sum \epsilon _i f_{vi}$
, with
 $\epsilon _i$
and
 $f_{vi}$
representing the relative dielectric permittivity and volume fraction of component
 $i$
, respectively. In this study, the volume fraction of water (
 $\epsilon _{{w}}\sim 80$
) is much larger than that of PE (
 $\epsilon _{{p}}\sim O(10)$
). Hence the relative permittivity
 $\epsilon$
of the PE solution in this study is taken as that of water,
 $\epsilon _{{w}}$
, which is also a common practice in many previous theoretical and simulation studies (Carrillo & Dobrynin Reference Carrillo and Dobrynin2011; Gartner & Jayaraman Reference Gartner and Jayaraman2019; Jiang, Ginzburg & Wang Reference Jiang, Ginzburg and Wang2019; Bagchi & Olvera de la Cruz Reference Bagchi and Olvera de la Cruz2020; Jiang Reference Jiang2022).
After establishing the free energy of the system, one can obtain the thermodynamic equilibrium state of the system by minimising the free energy
 ${\mathcal{F}}$
with respect to
 $\phi ({\boldsymbol{r}})$
,
 $c_{{+}}({\boldsymbol{r}})$
,
 $c_{{-}}({\boldsymbol{r}})$
and
 $\psi ({\boldsymbol{r}})$
. Note that in the slit nanochannel depicted in figure 1, all the physical properties can be considered to be variant only in the
 $z$
direction. Hence by applying the variational method to
 ${\mathcal{F}}$
coupled with the neutral charge condition
 $c_{{+,b}}-c_{{-,b}}-f\phi ^{2}_{{b}}=0$
, one can obtain (see Appendix A)
 \begin{equation} \frac {a^2}{6}\frac {{\text{d}}^{2}\phi }{\text{d}z^{2}}=\nu \phi \left(\phi ^{2}-\phi ^{2}_{{b}}\right)-f\phi \beta e \psi, \end{equation}
 \begin{equation} \beta e \frac {{\text{d}}^{2}\psi }{\text{d}z^{2}}=\kappa ^{2}_{{s}}\text{sinh}(\beta e \psi )-\kappa ^{2}_{{p}}\left[\text{exp}(-\beta e \psi )-\frac {\phi ^{2}}{\phi ^{2}_{{b}}}\right], \end{equation}
 \begin{equation} c_{{+}}(z)=\left(f\phi ^{2}_{{b}}+c_{{s}}\right)\exp(-\beta e \psi ), \end{equation}
 \begin{equation} c_{{-}}(z)=c_{{s}}\exp(\beta e \psi ), \end{equation}
where
 $\kappa _{{s}}=\sqrt {2\beta e^{2} c_{{s}}/\epsilon _0\epsilon }$
and
 $\kappa _{{p}}=\sqrt {f\beta e^{2} c_{{b}}/\epsilon _0\epsilon }$
are nominal Debye parameters associated with salt ions and PEs, respectively. Based on (2.6)–(2.9), the local space charge distribution
 $\rho (z)$
in (2.1) can be determined as
 \begin{equation} \rho (z)=ef\phi ^{2}_{{b}}\exp(-\beta e \psi )+2ec_{{s}}\sinh(-\beta e \psi )-ef\phi ^{2}, \end{equation}
which is a function of
 $\psi$
and
 $\phi$
.
Equation (2.6) is the so-called Edward equation, and (2.7) is the modified Poisson–Boltzmann equation. Equations (2.6) and (2.7) jointly characterise the EDL near the surface walls. In this work, each monomer in a PE chain is assumed to uniformly carry
 $-fe$
fractional electric charge. This assumption leads to a simplified treatment of more realistic PE chains with randomly charged monomers (Dobrynin et al. Reference Dobrynin, Colby and Rubinstein1995; Chen et al. Reference Chen, Perazzo and Stone2020, Reference Chen, Perazzo and Stone2021). The rationality of this assumption and the validity of our mean-field EDL model are validated via molecular dynamics simulations (see Appendix B).
2.2. Mean-field theory for viscosity distribution
In slit nanochannels, the viscosity of the PE solution
 $\eta (z)$
exhibits strong heterogeneity, and it is of significance to accurately characterise the distribution of
 $\eta (z)$
for EOF prediction. In this work, the characterisation of
 $\eta (z)$
is based on the model proposed by Chen, Perazzo & Stone (Reference Chen, Perazzo and Stone2021), which employs a mean-field approach to investigate how electrostatics of a semi-dilute PE solution contribute to the viscous properties of the untangled PE chains. As mentioned before, the PE chains are modelled as freely jointed flexible polymer monomers with polymerisation degree
 $N_{{p}}$
. Each PE chain is uniformly charged with charge fraction
 $f$
at equilibrium. On average, each polymer monomer carries charge
 $fe$
, surrounded by small counterions of opposite charge that are packed into a so-called ‘blob’. The concept of ‘blob’ was first introduced by De Gennes (Reference De Gennes, Pincus, Velasco and Brochard1979) and further extended by Chen et al. (Reference Chen, Perazzo and Stone2021). As shown in figure 2, the PE chain is separated into successive blobs of size
 $\varsigma$
. Each blob has monomer concentration
 $c_{{b,m}}$
and salt concentration
 $c_{{b,s}}$
. Hence each blob contains
 $g=c_{{b,m}}\varsigma ^3$
monomers, and can be further divided into
 $g$
closely packed monomers of size
 $a$
. In this work,
 $a$
is taken as the Kuhn length of the polymer chain.
Then the total free energy
 ${\mathcal{F}}_{{blob}}$
of a blob, which comprises an elastic component
 ${\mathcal{F}}_{ {{els}}}$
and an electrostatic component
 ${\mathcal{F}}_{{{elec}}}$
, can be given by (Chen et al. Reference Chen, Perazzo and Stone2020, Reference Chen, Perazzo and Stone2021)
 \begin{equation} \beta {\mathcal{F}}_{{blob}}=\beta ({\mathcal{F}}_{{{els}}}+{\mathcal{F}}_{{{elec}}})=\frac {1}{a^2c_{{b,m}}\varsigma }+\varsigma ^3\, f_{{elec}}(c_{{b,m}},c_{{b,s}},f), \end{equation}
 \begin{equation} \beta {\mathcal{F}}_{{els}}= \frac {1}{a^2c_{{b,m}}\varsigma },\quad\beta {\mathcal{F}}_{elec}=\varsigma ^3\,f_{{elec}}(c_{{b,m}},c_{{b,s}},f), \end{equation}
where
 $f_{{{elec}}}(c_{{b,m}},c_{{b,s}},f)$
represents the non-dimensional electrostatic energy density. Using extremisation of
 ${\mathcal{F}}_{{blob}}$
with respect to
 $\varsigma$
, based on the Zimm–Rouse model (De Gennes et al. Reference De Gennes, Pincus, Velasco and Brochard1976; Dobrynin et al. Reference Dobrynin, Colby and Rubinstein1995; Chen et al. Reference Chen, Perazzo and Stone2020), the relaxation time
 $\tau$
of
 $N_{{p}}/g$
blobs on a PE chain can be given by
 \begin{equation} \tau =\beta \eta _{{s}} N_{{p}}^{2}a^{1.5}c_{{b,m}}^{-1.25}f_{{elec}}^{0.75}, \end{equation}
where
 $\eta _{{s}}$
is the viscosity of the solvent (water in our system). Moreover, the stress relaxation modules
 $G=c_{{b,m}}/(\beta N_{{p}})$
and the viscosity
 $\eta =\tau G$
can be written as (Dobrynin et al. Reference Dobrynin, Colby and Rubinstein1995)
 \begin{equation} \eta =\eta _{{s}} N_{{p}} \big(c_{{b,m}} a^3\big)^{0.5}\left(\frac {f_{{elec}}}{c_{{b,m}}}\right)^{0.75}. \end{equation}
Then by minimising
 $f_{{{elec}}}(c_{{b,m}},c_{{b,s}},f)$
and solving the nonlinear Poisson–Boltzmann equation, the various analytical expressions for
 $\eta$
in different regimes of
 $f$
and
 $c_{{b,m}}/c_{{b,s}}$
can be obtained as a function of
 $c_{{b,m}}$
,
 $c_{{b,s}}$
,
 $f$
,
 $a$
and
 $N_{{p}}$
. The specific derivation is available in Chen et al. (Reference Chen, Perazzo and Stone2021) and will not be reiterated here. It is noted that in our study, (2.13) is applied locally along the channel height, with
 $c_{{b,m}}$
taking the value of
 $\phi ^{2}(z)$
. Since
 $f$
,
 $a$
and
 $N_{{p}}$
are fixed and constant everywhere, the local viscosity distribution
 $\eta (z)$
can also be written as a function of
 $\phi$
and
 $\psi$
, just like
 $\rho (z)$
.
Schematic of the PE chain constructed by closely packed blobs of size
 $\varsigma$
that can be further divided into closed separated cells containing only one monomer of size
 $a$
. Anions and cations exist in the solution to denote salt molecules.

2.3. Solution for EOF velocity distribution
Integrating both sides of (2.1) and noting that the velocity satisfies the symmetric boundary condition on the centre plane (i.e.
 $ \left.({{\rm d} v_x(z)}/{{\rm d}z}) \right|_{z=H}=0$
, we can obtain
 \begin{equation} \eta (z)\frac {{\rm d} v_x(z)}{{\rm d} z}=-\int _{0}^{z}\rho (z')\, E\,{\rm d}z'+\int _{0}^{H}\rho (z')\, {E}\,{\rm d}z'. \end{equation}
Note that the slit nanochannel walls bear a uniform charge density
 $\sigma$
, and the whole system is constrained with an electroneutral condition that indicates
 \begin{equation} \int _{0}^{H}\rho (z')\, {\rm d}z'=-\sigma. \end{equation}
Integrating both sides of (2.14), and taking advantage of the Navier-slip boundary condition (El-Shehawy, El-Dabe & El-Desoky Reference El-Shehawy, El-Dabe and El-Desoky2006; Bhagavatula & Castro Reference Bhagavatula and Castro2007; Ferrás et al. Reference Ferrás, Nóbrega and Pinho2012; Shojaeian & Koşar Reference Shojaeian and Koşar2014; Misra & Sinha Reference Misra and Sinha2015) on the solid–solution interface, we have
 \begin{equation} v_x(0)=L_{{s}}\left.\frac {{\rm d} v_x(z)}{{\rm d}z} \right|_{z=0}, \end{equation}
where
 $L_{{s}}$
is the Navier-slip length, and we can obtain the expression for
 $v_x(z)$
as
 \begin{eqnarray} v_{x}(z)=v_x(0)-E \int _{0}^{z} \frac {\sigma +\int _{0}^{z_{1}} \rho (z_2)\, {\rm d} z_{2}}{\eta \left (z_{1}\right )}\, {\rm d}z_{1}. \end{eqnarray}
Note that when
 $z=0$
, we can obtain from (2.14) and (2.16) that
 \begin{equation} v_x(0)=L_{{s}}\left.\frac {{\rm d} v_x(z)}{{\rm d}z} \right|_{z=0}=-L_{{s}}\frac {E\sigma }{\eta (0)}. \end{equation}
Hence (2.17) can be rewritten as
 \begin{eqnarray} v_{x}(z)=-L_{{s}}\frac {E\sigma }{\eta (0)}-E \int _{0}^{z} \frac {\sigma +\int _{0}^{z_{1}} \rho (z_2)\,{\rm d} z_{2}}{\eta \left (z_{1}\right )} \,{\rm d}z_{1}, \end{eqnarray}
and the electro-osmotic mobility
 $\mu _{{eof}}$
can be calculated as
 \begin{align} \mu _{{eof}}&=\frac {1}{2HE} \int _{0}^{2H} v_{x}(z)\, {\rm d} z\nonumber \\[8pt] &=-\frac {1}{2H} \int _{0}^{2H} \left[L_{{s}}\frac {\sigma }{\eta (0)}+ \int _{0}^{z} \frac {\sigma + \int _{0}^{z_{1}}\left (\rho (z_2)\right )\,{\rm d} z_{2}}{\eta \left (z_{1}\right )}\, {\rm d} z_{1} \right]{\rm d} z. \end{align}
As discussed before,
 $\eta (z)$
and
 $\rho (z)$
are both function of
 $\psi$
and
 $\phi$
, and their distributions can be obtained by numerically solving the coupled equations (2.6) and (2.7) with the boundary conditions
 \begin{equation} \frac {1}{\phi }\frac {{\rm d}\phi }{{\rm d}z}\left|_{z=0}=\frac {1}{2D},\quad\frac {{\rm d}\phi }{{\rm d}z}\right|_{z=H}=0, \end{equation}
 \begin{align} \frac {{\rm d}\psi }{{\rm d}z}\left|_{z=0}=-\frac {\sigma }{\epsilon _0\epsilon },\quad\frac {{\rm d}\psi }{{\rm d}z}\right|_{z=H}=0. \\[6pt] \nonumber \end{align}
Equations (2.21) give the Cahn boundary condition and the symmetric boundary condition in the channel centre. The Cahn boundary condition is first introduced by De Gennes (Reference Shojaeian and Koşar1982), with length
 $D$
measuring the magnitude of the thickness of the adsorption layer. Thus the magnitude of
 $D$
is inversely proportional to the van der Waals interaction between PEs and the surface wall. The surface wall is absorptive to the PEs when
 $D\lt 0$
, and repulsive when
 $D\gt 0$
. Equations (2.22) give the constant surface charge boundary condition at the wall and the symmetric boundary condition in the channel centre.
Applying the Simpson integration method to (2.19) and (2.20) based on the numerical results from (2.6) and (2.7), one can obtain the profile of EOF and all the physical properties that we need.
3. Results and discussion
3.1. Validation of the model with the experiment
We validate our model by comparing it with the experimental data reported by Olivares et al. (Reference Olivares, Vera-Candioti and Berli2009). The samples tested in the experiments are solutions of NaCMC and sodium dihydrogen phosphate (
 $\text{NaH}_{2}\text{PO}_{4}$
). All the parameters are taken from Olivares et al. (Reference Olivares, Vera-Candioti and Berli2009) and Lopez et al. (Reference Lopez, Colby, Graham and Cabral2017), as shown in table 1. It is worth noting that when the sign of
 $D$
is fixed, the specific value of
 $D$
has minimal impact on the results at high
 $\sigma$
, as the van der Waals forces between the PE and the surface become significantly smaller compared to the electrostatic forces. In the solution system under consideration, the PE is strongly charged and satisfies the condition
 $f_{{c}}\lt f\lt a/l_{{B}}$
proposed in Chen et al. (Reference Chen, Perazzo and Stone2021), with
 $f_{{c}}=a/\unicode{x03C0} l_{{B}}$
the critical charge fraction, and
 $l_{{B}}=\beta e^{2}/4\unicode{x03C0} \epsilon _0\epsilon$
the Bjerrum length. Here,
 $l_{{B}}\approx 0.7\,{\text{nm}}$
and
 $f_{{c}}\approx 0.29$
. In our calculations, the local salt concentration is replaced by the local ionic strength
 $I(z)=0.5(c_{+}+c_{-})$
, and
 $\phi ^{2}(z)/I(z)$
satisfies the condition
 $\phi ^{2}(z)/I(z)\ll 2/f$
proposed in Chen et al. (Reference Chen, Perazzo and Stone2021). Under the defined regime of
 $f$
and
 $\phi ^{2}/I$
, expression of local viscosity
 $\eta (z)$
can be given by (Chen et al. Reference Chen, Perazzo and Stone2021)
 \begin{equation} \frac {\eta (z)-\eta _{{s}}}{\eta _{{s}}}= N_{{p}}a^{1.5}\left(\frac {2}{f_{{c}}}\right)^{0.375}\left(\frac {f}{2}\right)^{1.5}\phi (z)^{1.75}\,I(z)^{-0.375}. \end{equation}
Figure 3(a) plots the experimentally measured data of electro-osmotic mobility
 $\mu _{{eof}}$
under various electric field strengths. The purple dashed and solid lines represent the theoretical predictions and experimental results from Olivares et al. (Reference Olivares, Vera-Candioti and Berli2009), respectively. It is noticeable that the theoretical predictions based on the power-law constitutive model with the experimentally determined rheological properties of bulk PE solutions significantly deviate from the experimental data even under micro-confinement (depicted by the purple solid line). This discrepancy implies the breakdown of macroscopic constitutive relations at the microscale and nanoscale. In contrast, our theoretical predictions, depicted by the solid blue line, show a close match to the experimental data with approximately 5 % error. It is also noticed that though demonstrating good accuracy, our model cannot predict the electric-field-strength-dependent characteristics of EOF mobility observed in the experiment. The reason for this could be that the viscosity model used in the current work was derived under the condition of zero shear rate and is shear-independent. Figure 3(b) illustrates the model-predicted velocity profile of the EOF, revealing a plug-like profile extending swiftly from the channel walls to the bulk value in the central channel. Equation (2.1) implies that the EOF is governed jointly by the local charge density
 $\rho (z)$
and the local viscosity
 $\eta (z)$
distribution, which are depicted in figures 3(c) and 3(d), respectively. Cations accumulate near the surface wall due to electrostatic attraction, while anions and monomers are depleted due to electrostatic repulsion and van der Waals forces (figure 3
e), which gives rise to the peak value of net charge density at the surface wall. Moreover, as the local ionic strength
 $I(z)$
diminishes and the PE concentration
 $\phi ^{2}(z)$
rises (figure 3
e),
 $\phi ^{2}(z)/I(z)$
escalates incrementally, prompting a rapid elevation in local viscosity
 $\eta (z)$
(figure 3
d). Notably, our viscosity model is applicable only within the semi-dilute regime and significantly underestimates actual values within the entangled regime. However, this discrepancy does not affect our predictive outcomes since viscosity outside the EDL does not influence the development of EOF and our model is able to effectively capture the physical properties within the double layer. Figure 3(
 $f$
) represents the dimensionless electric potential distribution
 $\beta e \psi$
, and a reversal of
 $\beta e \psi$
is observed at a short distance from the surface wall, which is the so-called overcharging potential.
Values of key parameters in the calculation.

Validation of the EOF model with the experiment by Olivares et al. (Reference Olivares, Vera-Candioti and Berli2009). (a) Comparison of experimental EOF mobility with those predicted by theoretical models. (b) The EOF velocity profile. (c) Space charge density profile. (d) Viscosity distribution profile. (e) Polyanions and small ions density profile normalised by respective bulk value. (f) Electric potential distribution profile.

3.2. EOF in uncharged nanochannels
The reliability of our model has been validated through comparison with experimental data. In this subsection, we use the established model to investigate the EOF behaviour of semi-dilute salt-free PE solutions confined within neutral nanochannels (i.e.
 $\sigma =0$
), and carry out a series of parametric studies. Note that when the PE solution is considered as salt-free, an approximation of
 $\eta (z)$
can be given by (Chen et al. Reference Chen, Perazzo and Stone2021)
 \begin{equation} \frac {\eta (z)-\eta _s}{\eta _s}= N_p(\phi ^{2}(z)\,a^3)^{0.5}\left[f\sinh^{-1}\left(0.5 f\frac {\phi ^{2}( z)}{c_{{s}}( z)}\right)\right]^{{ 0.75}}. \end{equation}
For salt-free cases,
 $c_{{s}}(z)$
can be redefined as
 $c_{{s}}(z)=\alpha\, \phi ^{2}(z)+\lambda$
, where
 $\alpha$
represents the proportion of the residual of salt carried by PEs, and
 $\lambda$
represents the salt left behind from contamination in the solvent. Here, for highly pure PE solutions with no salt added,
 $\alpha$
is fixed at 0.001 and
 $\lambda$
is fixed at
 $10^{-8}\,\rm {M}$
(Chen et al. Reference Chen, Perazzo and Stone2020). After replacing
 $c_{{s}}(z)$
with
 $\alpha\, \phi ^{2}(z)+\lambda$
, (3.2) can be rewritten as
 \begin{equation} \frac {\eta (z)-\eta _s}{\eta _s}= N_p(\phi ^{2}(z)\,a^3)^{0.5}\left[f\sinh^{-1}\left(0.5 f\frac {\phi ^{2}( z)}{\alpha\, \phi ^{2}( z)+\lambda }\right)\right]^{\textrm {0.75}}. \end{equation}
We aim to demonstrate the emergence of an unconventional EOF in uncharged nanochannels under an external electric field
 $E=100\,\rm {V}\,\rm {cm^{-1}}$
. The PE solution has bulk monomer density
 $0.1\,\rm {M}$
, and the polymerisation degree of a polymer chain is
 $N_p=200$
, with charge fraction
 $f=0.5$
. The Kuhn length of the polymer chain is set at
 $a=0.5\,\rm {nm}$
, and the adsorption length is
 $D=0.2\,\rm {nm}$
. The absolute temperature is kept at
 $T=300\ \rm K$
, with
 $\epsilon =80$
. The height of the slit nanochannel is fixed at
 $2H=10\,\rm {nm}$
, and the Navier-slip length is set as
 $L_{{s}}=0$
(i.e. the no-slip boundary condition).
Figure 4(
 $a$
) presents the profile of reduced EOF velocity
 $v_{{x}}(z)/v_{\textit{ref}}$
, with
 $v_{\textit{ref}}=1\ \unicode{x03BC} \text{m}\ \text{s}^{-1}$
the reference velocity, and shows that a considerable EOF is generated in the direction opposite to the
 $x$
axis. As is discussed, the EOF in our system is controlled by
 $\rho (z)$
and
 $\eta (z)$
depicted in figures 4(
 $b$
) and 4(
 $c$
), respectively. From figure 4(d) we can find that the negatively charged monomers are depleted in the near-wall region due to the conformational entropy of the PE chains and the van der Waals repulsion from the surface wall. The counterions (i.e. the small cations) are also depleted in the near-wall region, but to a much less degree (figure 4
e). We can also observe that the concentration of the monomers
 $\phi (z)^{2}$
increases rapidly and reaches an absorption peak larger than its bulk value (i.e.
 $\phi ^{2}_{{b}}$
) before levelling off to the bulk. This can be attributed to the electrostatic attraction from oppositely charged counterions and the constraint of electroneutrality in the entire system. Consequently, the distinct density distributions of polyanions and positively charged counterions result in an EDL structure with a non-zero net space charge density in the near-wall region of the nanochannel, as shown in figure 4(
 $b$
). As expected, net positive charges accumulate near the channel walls (figure 4
b), followed by a sharp transition to net negative charges, reaching a minimum. This behaviour exhibits a pronounced oscillation with a decaying amplitude and alternating signs. With the application of the external electric field, the dramatic fluctuations of
 $\rho (z)$
exert electric body forces, which contribute to the generation of EOF.
The EOF of a PE solution in an uncharged nanochannel. (a) The EOF velocity profile. (b) Space charge density profile. (c) Viscosity distribution profile. (d) Monomer density profile. (e) Counterion density profile. (f) Electric potential distribution profile.

From figure 4(
 $a$
), we can find that the EOF occurs in the opposite
 $x$
direction despite a relatively large positive electric body force acting near the two channel walls, which can be ascribed to the fact that a larger portion of the central nanochannel region bears a negative electric body force and dominates the EOF. This phenomenon aligns with the traditional Helmholtz–Smoluchowski equation (
 $-\epsilon _0\epsilon \psi _{{S}}/\eta _0$
). Despite the zero surface charge density, the charge separation induced by nano-confinement gives rise to a certain positive electrostatic potential on the surface wall (figure 4
f) and results in an EOF in the negative
 $x$
direction. Another intriguing phenomenon is discovered that under this unconventional EOF, the velocity gradient at the wall equals zero (figure 4
a), which implies that the EOF remains independent of the Navier-slip length
 $L_{{s}}$
in (2.16). We can also observe that the magnitude of the EOF velocity surges to a peak, then tardily declines to a constant value slightly lower than the peak (figure 4
a). This unique profile of the EOF is due to the net charge density oscillation induced by ionic layering, along with the competition effect between electric body forces and the hindrance effect from viscosity. From figure 4(
 $c$
), we can observe that the reduced viscosity shares a similar trend with the reduced monomer concentration, which exerts a relatively small obstruction on the flow near the channel wall, and stabilises the EOF in the central region.
So far, we have elucidated the origin of an appreciable EOF of PE solutions in a nanochannel with neutral walls. The following subsubsections investigate the influence of various factors on this unconventional EOF.
Dependence of EOF on bulk monomer density
 $c_{{b}}$
. (a) The EOF velocity profile. (b) Space charge density profile. (c) Viscosity distribution profile. (d) Monomer density profile. (e) Counterion density profile. (f) Electric potential distribution profile. The PE solution consists of only one type of polymer, with
 $N_{{p}} = 200$
,
 $f = 0.5$
,
 $a=1$
nm,
 $H=5$
nm,
 $D=0.2$
nm, and
 $c_{{b}}$
varies among 0.01, 0.05, 0.1, 0.5 and 1.0 M.

3.2.1. Effect of monomer bulk concentration on EOF
We first examine the influence of the monomer bulk concentration
 $c_{{b}}$
on the EOF, by considering a typical strongly charged PE with
 $f=0.5$
at various
 $c_{{b}}$
values. From figure 5(
 $a$
), we can observe that at high
 $c_{{b}}$
, the magnitude of EOF velocity surges to a peak value and displays a plug-like profile. However, this behaviour is delayed at lower
 $c_{{b}}$
values, as the EOF magnitude grows more slowly and the plateau region at the centre of the nanochannel becomes shorter. Furthermore, when the monomer bulk concentration falls below 0.1 M, the plateau almost disappears and the EOF shifts to a parabolic-like shape. It is also observed that the central flow velocity of the EOF undergoes an obvious nonlinear change, initially increasing and then gradually decreasing as
 $c_{{b}}$
increases. This nonlinear variation is attributed to the combined influence of
 $\rho (z)$
and
 $\eta (z)$
as depicted in figures 5(
 $b$
) and 5(
 $c$
), respectively. Figure 5(
 $d$
) illustrates that due to decreased osmotic pressure with the decrease of
 $c_{{b}}$
, polymer monomers are depleted deeper at the surface wall at a broader range with a higher absorption peak. In contrast, counterions are less depleted at low
 $c_{{b}}$
(figure 5
e). Therefore, as PE solutions become more dilute, the oscillation of net charge density gets broader along with a more pronounced magnitude (figure 5
b). This also suggests the expansion of the EDL thickness in the solution, which accounts for the shift of density profile of the EOF when the two EDLs start to overlap. As
 $c_{{b}}$
increases, the alterations in the double layer thickness are also evident in figure 5(
 $f$
). It is noticeable that the induced positive surface zeta potential intensifies at higher
 $c_{{b}}$
and diminishes to zero within a more narrow range.
As
 $c_{{b}}$
rises, the ionic strength of the solution increases, and intensifies the electric field forces acting on the system. However, this amplification is counteracted by the escalating viscosity of the solution. Figure 5(
 $c$
) illustrates that
 $\eta (z)$
increases at higher
 $c_{{b}}$
, hindering the conduction of electric field forces, and further impeding the development of EOF. In this interplay of competing influences, the EOF mobility demonstrates a nonlinear variation, further highlighted in figure 6 with
 $\mu _{{ref}}=10^{-10}\ \text{m}^{2}\ \text{V}^{-1}\ \text{s}^{-1}$
the reference electro-osmotic mobility. As the induced zeta potential continues to increase with rising
 $c_{{b}}$
, the EOF mobility shows a nonlinear trend, reaching an extremum at monomer bulk concentration approximately 0.041 M. This nonlinear variation (figures 5(
 $a$
) and 6) is a consequence of the competitive effect between the electric field forces and viscosity of the PE solution. Moreover, the induced zeta potential
 $ \psi$
is found to increase nonlinearly with
 $c_{{b}}$
(figure 6).
Reduced electro-osmotic mobility and non-dimensional induced zeta potential as a function of monomer bulk concentration
 $c_{{b}}$
.

3.2.2. Effect of polymer charge fraction on EOF
We then investigate the effects of the polymer charge fraction
 $f$
on the reported EOFs. As stated previously, we use a mean-field approach and assume that each monomer carries fractional charge
 $fe$
for a polymer chain with charge fraction
 $f$
at equilibrium. In this subsubsection, the Kuhn length of the polymer chain is fixed at
 $a=1.0 \,\text{nm}$
, hence the critical charge fraction is defined as
 $f_{{c}}\approx 0.45$
(Chen et al. Reference Chen, Perazzo and Stone2020, Reference Chen, Perazzo and Stone2021). In order to provide a more comprehensive assessment, both strongly charged cases (i.e.
 $f\lt f_{{c}}$
) and weakly charged cases (i.e.
 $f\gt f_{{c}}$
) have been taken into consideration.
Dependence of EOF on polymer charge fraction
 $f$
. (a) The EOF velocity profile. (b) Space charge density profile. (c) Viscosity distribution profile. (d) Monomer density profile. (e) Counterion density profile. (f) Electric potential distribution profile. The PE solution consists of only one type of polymer, with
 $N_{{p}} = 200$
,
 $c_{{b}} = 0.1$
M,
 $a=1$
nm,
 $H=5$
nm,
 $D=0.2$
nm, and
 $f$
varies among 0.1, 0.2, 0.4, 0.6, 0.8 and 1.0.

Figure 7(
 $a$
) plots the EOF velocity profiles for various
 $f$
values. It can be observed that as the charge fraction
 $f$
of the polymer chain increases, the PE transitions from a weakly charged state to a strongly charged state, leading to a concurrent weakening of the EOF. Additionally, the EOF gradually shifts from a parabolic-like profile at low
 $f$
to a plug-like profile at high
 $f$
. In particular, the EOF velocity rises more gradually from the surface wall to the channel centre, reaching a lower maximum value within a broader region. This variation of
 $v_x(z)$
is attributed to the combined influence of
 $\rho (z)$
and
 $\eta (z)$
as depicted in figures 7(
 $b$
) and 7(
 $c$
), respectively. Figure 7(
 $d$
) illustrates that with the decrease of
 $f$
, polymer monomers are depleted deeper at the surface wall at a broader range with a higher absorption peak. Counterions are also more depleted at low
 $f$
(figure 7
e). We note that both
 $\phi ^{2}(z)$
and
 $c_{+}(z)$
do not revert to their respective bulk concentration in the centre of the nanochannel. This phenomenon arises when the PE is weakly charged and behaves more like a neutral polymer, which leads to a lower ionic strength within the solution and hence results in an increase in the thickness of the EDL. Under nano-confinement in this study, this change leads to the overlap of the EDLs on both wall surfaces, consequently altering the central region of the channel, which no longer retains the physical properties of the bulk solution. Therefore, as the PE becomes more strongly charged, the oscillation of net charge density
 $\rho$
shrinks along with a less pronounced magnitude (figure 7
b), which accounts for the shift of density profile with varying
 $f$
(figure 7
a). The alteration of EDLs is also reflected in figure 7(
 $f$
): as
 $f$
increases, the induced positive surface zeta potential slightly decreases and diminishes to bulk value within a more narrow range.
At low
 $f$
, the net charge density in the EDL is reduced and leads to the decrease in the electric body forces acting on the PE solution. Nevertheless, the decline in this propelling force is counteracted by the viscous effect. As seen in figure 7(
 $d$
), in most regions of the EDL where the EOF evolves, both
 $\phi ^{2}(z)$
and
 $f$
are relatively low in comparison to values at higher
 $f$
. Consequently, based on (3.3), there is a considerable reduction in local viscosity in the EDL when PEs are weakly charged (figure 7
 $c$
). This diminishing viscosity paradoxically leads to an incremental strengthening of EOF as it predominates over electric body force effect at low
 $f$
(figure 7
 $a$
).
Figure 8 plots how
 $\mu _{{eof}}$
and
 $\psi$
vary with
 $f$
, and is divided into two regions based on the critical charge fraction
 $f_{{c}}$
, with the left-hand side representing the scenario of weakly charged PEs, and the right-hand side depicting the strongly charged ones. We can notice that when
 $f\lt f_{{c}}$
, both
 $\mu _{{eof}}$
and
 $\psi$
exhibit a nonlinear decline with
 $f$
. Conversely, upon
 $f$
surpassing
 $f_{{c}}$
, the EOF mobility and the induced zeta potential tend to decrease consistently with
 $f$
. After fitting the scatter data on a logarithmic scale, two scaling laws,
 $\mu _{{eof}} \propto f^{-0.93}$
and
 $\psi \propto f^{-0.17}$
, are reported. It is noteworthy that the scaling exponent of
 $\mu _{{eof}}$
with respect to
 $f$
is exactly the reciprocal of the scaling exponent of viscosity with respect to
 $f$
in the viscosity model proposed by Chen et al. (Reference Chen, Perazzo and Stone2020). This implies that
 $\mu _{{eof}}$
is significantly influenced by
 $f$
when the polymer chain is strongly charged.
Reduced electro-osmotic mobility and non-dimensional induced zeta potential as functions polymer charge fraction
 $f$
, where the critical charge fraction here is
 $f_{{c}}=0.45$
.

3.2.3. Effect of monomer Kuhn length on EOF
We next investigate the effects of the monomer Kuhn length
 $a$
on the reported EOFs. Equation (2.6) illustrates that
 $a$
reflects the rigidity of a polymer and hence influences the elastic energy of the chain. In this subsubsection, the EOFs of various
 $a$
(
 $a=0.5,0.6,0.7,0.8,0.9,1.0$
nm) are studied. It is noted that PEs are endowed with a fixed charge fraction
 $f=0.5$
, which is larger than the critical charge fraction
 $f_{{c}}=a/\unicode{x03C0} l_{{B}}$
. This means that all PEs are strongly charged.
Figure 9(
 $a$
) plots the EOF velocity profiles for various monomer Kuhn lengths
 $a$
. We can observe that at smaller
 $a$
, the EOF is enhanced, with EOF profile shifting from the plug-like shape to an obvious W-like shape. This variation of
 $v_x(z)$
is attributed to the combined influence of
 $\rho (z)$
and
 $\eta (z)$
as depicted in figures 9(
 $b$
) and 9(
 $c$
), respectively. Figure 9(
 $d$
) illustrates that when
 $a$
increases, polyanions are more depleted at the surface wall due to increasing penalty of conformational entropy. The depletion length of polyanions is also broaden, which is affected by the correlation length of semi-dilute PE solution
 $\xi \sim \textit {O}(a)$
. The augmented
 $\phi ^{2}(z)$
in the vicinity of surface walls leads to the increased concentration of counterions due to electrostatic attraction (figure 9
 $e$
). Interestingly, the variations of
 $\phi ^{2}(z)$
and
 $c_{+}(z)$
share trends similar to those depicted in figures 7(
 $d$
) and 7(
 $e$
). This can be explained by the fact that the variation of
 $a$
implies the alteration of charge fraction
 $f$
. At small
 $a$
, the Kuhn length between PE segments is decreased, thereby lowering the threshold of being strongly charged (i.e.
 $f_{{c}}$
declines). When the polymer chain is endowed with a fixed charge fraction, an increase in Kuhn length reduces the relative electrification; in other words, it decreases the charge fraction
 $f$
. Hence at smaller
 $a$
, a more pronounced oscillation of net charge density
 $\rho$
(figure 7
 $b$
) is observed, which results in the W-like shaped EOF profile (figure 7
 $a$
). For different Kuhn lengths, variations in net charge density
 $\rho$
are minor, hence the magnitude of EOFs is governed primarily by the viscous effects. Figure 7(
 $c$
) illustrates that the viscosity within the EDL increases at larger
 $a$
, thereby impeding the EOF flow. Figure 7(
 $f$
) demonstrates the induced zeta potential at the surface walls, where significant overcharging is observed at large
 $a$
.
Dependence of EOF on polymer Kuhn length
 $a$
. (a) The EOF velocity profile. (b) Space charge density profile. (c) Viscosity distribution profile. (d) Monomer density profile. (e) Counterion density profile. (f) Electric potential distribution profile. The PE solution consists of only one type of polymer, with
 $N_{{p}} = 200$
,
 $c_{{b}} = 0.1$
M,
 $f=0.5$
,
 $H=5$
nm,
 $D=0.2$
nm, and
 $a$
varies among 0.5, 0.6, 0.7, 0.8, 0.9 and 1.0 nm.

Figure 10 plots how
 $\mu _{{eof}}$
and
 $\psi$
vary with
 $a$
. After fitting the scatter data on a logarithmic scale and ensuring that the error between the scatter data and the predicted data is less than 5
 $\%$
, we can notice that both
 $\mu _{{eof}}$
and
 $\psi$
exhibit a power-law relationship with
 $a$
, and two scaling laws,
 $\mu _{{eof}} \propto a^{-0.44}$
and
 $ \psi \propto a^{1.10}$
, are reported. This illustrates that although the zeta potential increases as
 $a$
increases, the actual EOF mobility decreases due to the significant effect on the viscosity brought by
 $a$
, thereby curtailing the velocity.
Reduced electro-osmotic mobility and non-dimensional induced zeta potential as functions of polymer Kuhn length
 $a$
.

3.2.4. Effect of polymer polymerisation degree on EOF
In this subsubsection, we probe into how polymerisation degree of PE chains
 $N_{{p}}$
influences the EOF. It is worth mentioning that in this work, we consider only cases with
 $N_{{p}}\gg 1$
, which means that the translational entropy of the polymers can be neglected (i.e.
 $\int {\rm d}{\boldsymbol{r}}\,({\phi ^{2}}/{N_{{p}}})(\ln \phi ^{2}-1)$
). Hence the polymerisation degree
 $N_{{p}}$
exerts no effect on the EDL structure in our calculations. This approach is rational because the ion concentration in the semi-dilute PE solutions is sufficiently high so that
 $\xi$
is insensitive to the polymer chain length and is determined mainly by electrostatic interactions among ions. From figure 11, we can observe that profiles of
 $\rho (z)$
,
 $\phi ^{2}(z)$
,
 $c_+(z)$
and
 $\psi$
look identical, which is also verified by classical density functional theory (Jiang et al. Reference Jiang, Ginzburg and Wang2019). Hence the EOF (figure 11
 $a$
) is determined by viscosity with varying
 $N_{{p}}$
. When other parameters are fixed, the local viscosity is dependent only on
 $N_{{p}}$
(figure 11
 $c$
), and figure 12 illustrates that the EOF mobility is inversely proportional to the polymerisation degree
 $N_{{p}}$
, which gives
 $\mu _{{eof}}\propto N_{{p}}^{-1}$
.
Dependence of EOF on polymer polymerisation degree
 $N_p$
. (a) The EOF velocity profile. (b) Space charge density profile. (c) Viscosity distribution profile. (d) Monomer density profile. (e) Counterion density profile. (f) Electric potential distribution profile. The PE solution consists of only one type of polymer, with
 $a = 1.0$
nm,
 $c_{{b}} = 0.1$
M,
 $f=0.5$
,
 $H=5$
nm,
 $D=0.2$
nm, and
 $N_{{p}}$
varies among 200, 400, 600 and 800.

Reduced electro-osmotic mobility and non-dimensional induced zeta potential as functions of polymer polymerisation degree
 $N_{{p}}$
.

Dependence of EOF on nanochannel height
 $H$
. (a) The EOF velocity profile. (b) Space charge density profile. (c) Viscosity distribution profile. (d) Monomer density profile. (e) Counterion density profile. (f) Electric potential distribution profile. The PE solution consists of only one type of polymer, with
 $a = 1.0$
nm,
 $c_{{b}} = 0.1\,$
M,
 $f=0.5$
,
 $N_{{p}}=200$
,
 $D=0.2$
nm, and
 $H$
varies among 2, 3, 4, 5, 6 and 7 nm.

3.2.5. Effect of nanochannel height on EOF
We next investigate the effects of nanochannel height
 $2H$
on the reported EOFs. A dimensional parameter
 $2H\kappa$
is utilised to characterise the confinement degree of PE solutions in the slit nanochannel, where
 $\kappa ^{-1}\approx 2\ \text{nm}$
, with other parameters held constant. The degree of confinement weakens as
 $2H\kappa$
increases. As
 $2H\kappa$
approaches 1, the system is considered highly constrained, whereas a
 $2H\kappa$
value exceeding 5 indicates significantly reduced confinement (Alizadeh et al. Reference Alizadeh, Hsu, Wang and Daiguji2021). Here, cases both with and without confinement effect are studied for comprehensive assessment.
Figure 13(
 $a$
) plots the EOF velocity profiles for various
 $2H\kappa$
values. We can observe that the EOF follows a two-stage change. At the first stage, when the confinement effect is pronounced (i.e.
 $2H\kappa \lt 5$
), the EOF exhibits a parabolic-like shape and rises to a higher peak with increasing
 $2H\kappa$
. This peak is maximised at
 $2H\kappa =4$
, and at the second stage, when the confinement effect becomes weaker (
 $2H\kappa \gt 5$
), the EOF shifts to a W-like shape, and the profile becomes gradually independent of
 $2H\kappa$
. This variation of
 $v_x(z)$
is attributed to the combined influence of
 $\rho (z)$
and
 $\eta (z)$
as depicted in figures 13(
 $b$
) and 13(
 $c$
), respectively. From figures 13(
 $d$
) and 13(e), we can observe that at the first stage under extreme confinement (
 $2H\kappa =2$
),
 $\phi ^{2}(z)$
and
 $c_+{(z)}$
exhibits unique profiles. Specifically, polyanions are less depleted, while counterions are more significantly depleted near the surface wall compared to conditions with weaker confinement. Both
 $\phi ^{2}(z)$
and
 $c_+(z)$
rise much more gradually to peak values smaller their respective bulk values at the centre of the nanochannel. As
 $2H\kappa$
increases, the depletion depth of both
 $\phi ^{2}(z)$
and
 $c_+(z)$
remains nearly unchanged, and both
 $\phi ^{2}(z)$
and
 $c_+(z)$
rise to absorption peaks larger than their respective bulk values. In the second stage, the profiles of
 $\phi ^{2}(z)$
and
 $c_+(z)$
become independent of
 $2H\kappa$
when confinement is relatively weak.
Therefore, with the increase of
 $2H\kappa$
, we observe that the profile of net charge density
 $\rho$
and local viscosity
 $\eta (z)$
exhibits a trend similar to that of the monomer concentration
 $\phi ^{2}(z)$
(figure 13
b,c). It is noted that at high
 $2H\kappa$
, when the confinement effect is weak, there exists a minor oscillation of net charge density in the near region of the nanochannel centre, which gives rise to the W-like shape EOF (figure 13
 $a$
). From figure 13(
 $f$
), we can find that as
 $2H\kappa$
increases, the profile of
 $\beta e \psi$
becomes gradually independent, and an overcharging potential is observed under weak confinement.
Figure 14 plots how
 $\mu _{{eof}}$
and
 $\psi$
vary with
 $H\kappa$
. Applying the same processing method to the data as before, we can observe that when the confinement effect is strong (
 $2H\kappa \lt 1.7$
), two scaling laws,
 $\mu _{{eof}} \propto (H\kappa )^{2.45}$
and
 $ \psi \propto (H\kappa )^{-1}$
, are reported. As
 $2H\kappa$
increases further,
 $\mu _{{eof}}$
rises more gradually, and is predicted to converge to its bulk value when
 $2H\kappa\to \infty$
. Additionally,
 $\psi$
first minimises at
 $2H\kappa =2.4$
, and converges to approximately 0.23 when
 $2H\kappa =4$
.
Reduced electro-osmotic mobility and non-dimensional induced zeta potential as a function of nanochannel height
 $H$
.

3.3. The EOF in nanochannels with various wall effects
In this subsection, we investigate the influence of wall effects on EOF through parametric studies. Three types of effects associated with the channel walls have been taken into account, namely the wall adsorption/depletion (characterised by adsorption length
 $D$
), wall charge (characterised by surface charge density
 $\sigma$
) and wall slip (characterised by slip length
 $L_{{s}}$
).
3.3.1. Effect of wall adsorption length on EOF
We first probe into the effect of the van der Waals interactions between PEs and the surface walls on the EOF. As is discussed before,
 $D$
is the adsorption parameter of the PEs and is inversely proportional to the van der Waals interactions. This indicates that when
 $D\gt 0$
, the depletion of PEs near the wall becomes more pronounced as
 $D$
approaches 0. Conversely, when
 $D\lt 0$
, the adsorption of PEs onto the surface wall continues to increase. Notably, as
 $D\to \infty$
, the van der Waals interaction between surface walls and PEs diminishes. In this subsubsection, both absorption (
 $D=0.4,0.6,0.8\,\text{nm}$
) and depletion (
 $D=-0.4,-0.6,-0.8\,\text{nm}$
) cases are considered for comparative study.
Dependence of EOF on absorption length
 $D$
. (a) The EOF velocity profile. (b) Space charge density profile. (c) Viscosity distribution profile. (d) Monomer density profile. (e) Counterion density profile. (f) Electric potential distribution profile. The PE solution consists of only one type of polymer, with
 $a = 0.5$
nm,
 $c_{{b}} = 0.1$
M,
 $f=0.5$
,
 $N_{{p}}=200$
,
 $H=5$
nm, and
 $D$
varies among
 $-0.4$
,
 $-0.6$
,
 $-0.8$
, 0.8, 0.6 and 0.4 nm.

Figure 15 depicts the physical characteristics of the EOF system under various
 $D$
values. An evident influence of
 $D$
can be observed in the absence of electrostatic interactions between the surface walls and the PE solutions (i.e.
 $ \sigma =0$
). When the surface is attractive (
 $D\lt 0$
), an EOF is generated in the positive
 $x$
direction, whereas it flows in the opposite direction when the surface is repulsive (
 $D\gt 0$
; figure 15
 $a$
). Regardless of whether the surface is attractive or repulsive, the EOF exhibits a plug-like profile that becomes more pronounced as van der Waals interactions are strengthened (i.e.
 $|1/D|$
becomes larger). This variation of
 $v_x(z)$
is attributed to the combined influence of
 $\rho (z)$
and
 $\eta (z)$
as depicted in figures 15(
 $b$
) and 15(
 $c$
), respectively.
For attractive cases, due to the absorption force from surface walls, PE monomers tend to accumulate near the surface, and an absorption layer of counterions is also observed owing to the electrostatic attractions from the enriched polyanions (figure 15
d,e). The enrichment layer of PEs is much thicker than that of the counterions, giving rise to a relatively high negative net charge density
 $\rho$
(figure 15
b and an induced negative zeta potential (figure 15
f) at the surface wall. We can also observe that
 $\eta (z)$
shares a profile similar to that of
 $\phi ^{2}(z)$
(figure 15
c). The monomer concentration is much higher than the bulk value, and results in the increased viscosity based on (3.3). Conversely, for repulsive cases, profiles of all physical parameters undergo a reversal trend. Monomers and counterions are depleted to distinct degrees (figure 15
d,e), and a positive net charge density can be observed in the vicinity of the surface wall (figure 15
b). Whether the surface is attractive (
 $D\lt 0$
) or repulsive (
 $D\gt 0$
), a clear oscillation in net charge density
 $\rho$
with a decaying amplitude is observed along the
 $z$
axis. The local viscosity also shares a similar profile with
 $\phi ^{2}(z)$
, and a positive zeta potential is induced at the surface wall when
 $D\gt 0$
(figure 15
c,f). Furthermore, when the van der Waals forces are intensified (i.e.
 $|1/D|$
becomes larger), all the physical quantities tend to deviate more from their respective bulk values. However, the sign of
 $D$
wields a considerable influence on the system, despite its magnitude. It can be observed from figure 15(
 $a$
) that for the same magnitude of
 $D$
, the magnitude of EOF for attractive cases is nearly twice that of repulsive ones. This can be ascribed to the fact that although the viscous effect is more pronounced when
 $D\lt 0$
(figure 15
c), it is compensated by the largely enhanced electric driving force (figure 15
b), and results in the enhanced EOF demonstrated in figure 15(
 $a$
).
Figures 16 and 17 plot how
 $\mu _{{eof}}$
and
 $\psi$
vary with
 $D$
. We can observe that the magnitudes of
 $\mu _{{eof}}$
and
 $\psi$
decline under weakened van der Waals interactions. Applying the same processing method to the data as before, it can be illustrated that when the surface walls are adsorptive of PEs (i.e.
 $D\lt 0$
) and the magnitude of adsorption effect is relatively weak (
 $D\lt -0.45$
nm), two scaling laws,
 $\mu _{{eof}} \propto D^{-1.27}$
and
 $\psi \propto D^{-1.26}$
, are reported. When the surface walls are repulsive of PEs (i.e.
 $D\gt 0$
) and the magnitude of depletion effect is relatively weak (
 $D\gt 0.44$
nm), two scaling laws,
 $\mu _{{eof}} \propto D^{-0.78}$
and
 $\psi \propto D^{-0.77}$
, are reported.
Reduced electro-osmotic mobility and non-dimensional induced zeta potential as functions of adsorption length
 $D$
, when
 $D\lt 0$
.

Reduced electro-osmotic mobility and non-dimensional induced zeta potential as functions of adsorption length
 $D$
, when
 $D\gt 0$
.

3.3.2. Effect of electrostatic force on EOF
Our previous studies have focused primarily on the EOF behaviour of PE solutions in confined nanochannels with uncharged walls (i.e.
 $\sigma =0$
), and systematically investigated the impact of various parameters (e.g.
 $c_{{b}},f,H,D$
). In all the above cases, the surface walls carry no charge and exert no electrostatic force on polyanions and counterions in PE solutions. Hence for comparison and completeness, we examine how surface charge density
 $\sigma$
affects the EOF of salt-free semi-dilute PE solutions. Unlike the van der Waals force, the surface walls can generate electrostatic interactions with charged ions through the Coulomb effect. In this subsubsection, cases when surface walls are both negatively charged (
 $\sigma =-0.1,-1,-10\ \text{mC}\ \text{m}^{-2}$
) and positively charged (
 $\sigma =0.1,1,10\ \text{mC}\ \text{m}{^{-2}}$
) are considered for comprehensive assessment.
Dependence of EOF on surface charge density
 $\sigma$
. (a) The EOF velocity profiles. (b) Space charge density profiles. (c) Viscosity distribution profiles. (d) Monomer density profiles. (e) Counterion density profiles. (f) Electric potential distribution profiles. The PE solution consists of only one type of polymer, with
 $a = 1.0$
nm,
 $c_{{b}} = 0.1$
M,
 $f=0.5$
,
 $N_{{p}}=200$
,
 $H=5$
nm,
 $D=0.2$
nm, and
 $\sigma$
varies among −0.1, −1, −10, 0.1, 1, 10
 $\text{mC}\, \text{m}^{-2}$
.

For positively charged cases, figure 18(
 $a$
) illustrates that EOF is generated in the opposite
 $x$
direction, the same as neutral cases. When the surface charge density is low (
 $\sigma \sim \textit {O}(0.1\,\text{mC}\, \text{m}^{-2})$
), the generated EOF almost overlaps with that of the neutral case, which implies that the EOF is scarcely enhanced. As
 $\sigma$
increases, the EOF becomes noticeably amplified compared to the neutral case. This augmentation intensifies with increasing
 $\sigma$
, and can nearly double at
 $\sigma =10\,\text{mC}\,\text{m}^{-2}$
. This variation of
 $v_x(z)$
is attributed to the combined influence of
 $\rho (z)$
and
 $\eta (z)$
as depicted in figure 18(
 $b$
) and 18(
 $c$
), respectively. As
 $\sigma$
increases, polyanions become less depleted near the surface wall due to the electrostatic attraction from counterions on the slit surface. Consequently,
 $\phi ^{2}(z)$
rises more rapidly, reaching a higher adsorption peak at a closer distance from the wall (figure 18
d). When
 $\sigma =10\,\text{mC}\,\text{m}^{-2}$
, this peak concentration can even reach twice the bulk value. Meanwhile, as the surface wall carries a higher density of positive charge, small counterions of similar charge released from the PEs become more depleted near the surface wall due to electrostatic repulsion (figure 18
e). This variation in the concentration of charged carriers in the PE solution results in changes to the local net charge density
 $\rho (z)$
. It can be observed that as
 $\sigma$
increases, the net positive
 $\rho$
near the surface wall becomes gradually diluted, with a larger portion of the nanochannel dominated by net negative charge (figure 18
b). Specifically, when
 $\sigma$
reaches
 $10\,\text{mC}\, \text{m}^{-2}$
, the EDL is almost occupied by net negative charge and the oscillation of
 $\rho$
nearly vanishes. Hence with the increase of
 $\sigma$
, more negative charges are dominant in the entire nanochannel, providing a stronger negative electric body force. However, this stronger body force is largely balanced by the increasing hindrance from viscosity as we can observe that
 $\eta (z)$
shares a profile similar to that of
 $\phi ^{2}(z)$
(figure 18
c). The competition effect between the driving electric force and the viscous effect gives rise to the nonlinear variation of
 $\mu _{{eof}}$
as depicted in figure 19. We also discover that when the surface walls carry more positive charge, zeta potential at the surface
 $\psi$
exhibits a nonlinear variation with
 $\sigma$
(figure 19) and an obvious overcharging potential is observed at
 $\sigma =10\,\text{mC}\, \text{m}^{-2}$
.
However, things differ when surface walls are negatively charged. For simplicity, the increase of
 $\sigma$
refers to the augmentation of the magnitude of the surface charge density. From figure 18(
 $a$
), we can observe that the EOF initially weakens in the same direction as in the neutral case, and shifts to the positive
 $x$
direction with increasing
 $\sigma$
. At
 $\sigma =-10\,\text{mC}\, \text{m}^{-2}$
, the magnitude of EOF can be intensified to nearly eight times that of the neutral case. More interestingly, we discover that when
 $\sigma$
reaches
 $-1\,\text{mC}\, \text{m}^{-2}$
, flows in the positive and opposite
 $x$
direction coexist in the EOF; the sign of
 $v_x(z)$
reverses at
 $z\approx 2\ \text{nm}$
. This variation of
 $v_x(z)$
is attributed to the combined influence of
 $\rho (z)$
and
 $\eta (z)$
as depicted in figures 18(
 $b$
) and 18(
 $c$
), respectively. Figure 18(
 $d$
) illustrates that when surface walls carry more negative charge, polyanions are more depleted, and
 $\phi ^{2}(z)$
rises more gradually to a decaying absorption peak due to electrostatic repulsion from the slit walls. Notably, the adsorption peak nearly vanishes when the magnitude of
 $\sigma$
is relatively high. In contrast, small counterions are more attracted to the oppositely charged surface wall, and when
 $\sigma$
reaches
 $\sigma =-10\,\text{mC}\,\text{m}^{-2}$
, an enrichment layer forms at the surface (figure 18
e). This variation in the concentration of charged carriers in the EDL leads to a broader distribution of net positive charge within the EDL, resulting in a stronger positive electric body force; an enrichment layer forms at the surface in the EDL (figure 18
b), and accounts for the coexistence of two directions of flow. As surface charge density increases further, the EOF eventually reverses. Simultaneously, as
 $\eta (z)$
declines due to more depleted polyanions (figure 18
c), the EOF is further strengthened, which results in the much more pronounced enhancement compared to positive cases. Figure 18(
 $f$
) demonstrates that the zeta potential at the surface shifts to negative with increasing
 $\sigma$
, and an obvious overcharging potential is observed at
 $\sigma =-10\,\text{mC}\, \text{m}^{-2}$
. Figure 20 illustrates that the magnitude of
 $\mu _{{eof}}$
first declines until it vanishes at
 $\sigma \approx -2\,\text{mC}\,\text{m}^{-2}$
, and then increases rapidly at higher
 $\sigma$
. Also,
 $\psi$
undergoes a nonlinear variation with
 $\sigma$
. Interestingly,
 $\psi$
reverses later than
 $\mu _{{eof}}$
, at
 $\sigma \approx -4\,\text{mC}\, \text{m}^{-2}$
.
Reduced electro-osmotic mobility and non-dimensional zeta potential as functions of surface charge density
 $\sigma$
, when
 $\sigma \gt 0$
.

Reduced electro-osmotic mobility and non-dimensional zeta potential as functions of surface charge density
 $\sigma$
, when
 $\sigma \lt 0$
.

3.3.3. Co-action of wall effects on EOF
Finally, we discuss the coupling effects of various wall interactions on the EOF. Figure 20 shows that for negatively charged walls, there is a specific surface charge density
 $\sigma _{z}$
at which EOF mobility becomes zero. When the surface charge density exceeds this value, the direction of EOF mobility reverses. Here, we further explore the impact of other wall interactions on this intriguing reversal phenomenon, and analyse the coupling effects of these interactions.
Heat map of reduced electro-osmotic mobility as a function of surface charge density
 $\sigma$
and adsorption length
 $D$
, when
 $\sigma \lt 0$
and
 $D\gt 0$
.

First, we take into account the influence of
 $D$
. From our previous discussions about the impact of parameter
 $D$
(i.e. the adsorption length) on EOF, we can see that when the walls are uncharged, the van der Waals forces exerted by the walls on the solution have a significant impact on both the direction and magnitude of EOF. It is noted here that although cases of uncharged adsorptive walls (
 $D\lt 0$
) have also been taken into account, surface walls temd to exhibit a predominantly repulsive interaction with PE solutions (i.e.
 $D\gt 0$
) in reality. Figure 21 illustrates the variation in the EOF mobility under the coupled effect of the wall’s van der Waals repulsion and electrostatic repulsion. It can be observed that when
 $D$
and
 $\sigma$
change simultaneously, as predicted, there exists a distinct boundary line that reduces the EOF mobility (
 $\mu _{{eof}}$
) to zero. This zero line indicates that the critical EOF reversal surface charge density
 $\sigma _{z}$
changes non-monotonically with the depletion length
 $D$
. We can observe that at low
 $D$
when the surface wall exerts a strong van der Waals force on PE solutions,
 $\sigma _z$
increases with
 $D$
and reaches its maximum at approximately
 $D/\xi =0.01$
. Subsequently, as the van der Waals repulsion gradually decreases,
 $\sigma _z$
paradoxically decreases with an increase in
 $D$
. Additionally, figure 21 illustrates that when
 $\mu _{{eof}}$
is negative, the effect of
 $D$
on EOF is much more pronounced, as evidenced by the EOF contour lines. Conversely, when
 $\sigma$
exceeds
 $\sigma _z$
when EOF reverses,
 $D$
gradually has a marginal impact on EOF. Within this range, electrostatic interactions play a dominant role, and we can discover that the EOF mobility rapidly increases with increasing
 $\sigma$
.
Finally, we discuss the impact of wall slip effects. The slip effect is a complex phenomenon that can be viewed as a type of wall interaction. Its physical mechanism is intricate, and may involve various factors, such as wall adhesion, surface roughness and wettability. Here, we do not focus on the underlying physical mechanisms of the slip effect, but instead concentrate on the slip length
 $L_{{s}}$
, which characterises the strength of the slip effect. It is noted that in the nanoslit system that we considered, the magnitude of
 $L_{{s}}$
considered here is constrained to 0.1–10 nm, corresponding to dimensionless magnitude
 $L_{{s}}/2H$
in the range
 $0.01{-}1$
. From figure 22, we can observe that the impact of
 $L_{\text{}}$
on
 $\sigma _z$
is quite significant. As the slip effect becomes more pronounced, the EOF mobility reverses even at very low surface charge densities. Simultaneously, it can be observed that when
 $\sigma$
is fixed, with the increase of slip length, EOF mobility gradually transits from negative to zero, then quickly evolves towards a positive direction.
Heat map of reduced electro-osmotic mobility as a function of surface charge density
 $\sigma$
and slip length
 $L_{{s}}$
, when
 $\sigma \lt 0$
.

4. Conclusions and outlook
In this work, we formulate a theoretical model for the EOF of semi-dilute polyelectrolyte (PE) solutions in slit nanochannels, and systematically investigate how various influencing factors affect the EOF. The theoretical model of EOF combines well-recognised mean-field theories of EDL and viscous properties of PE solutions, and the validity of the model is confirmed with the existing experiments. We find that when confined by the nanochannel, the structure of PE solutions exhibits unique properties due to the complex interplay between electrostatic interactions, excluded volume forces, EDL overlap and wall effects. The unique properties of confined PE solutions give rise to the nature of the EOF being influenced by multiple factors, making the EOF of the PE solution significantly different from that of a simple electrolyte solution.
First, we observe that a considerable EOF of PE solutions can be generated in the uncharged nanochannel due to a non-zero charge density originating from the complex interplay of PE solutions properties as well as multiple interactions. Such an EOF is controlled by both the electric body forces and the non-uniform viscosity distribution. We then conduct a systematic study on the influence of various parameters on this counterintuitive EOF. We reveal that the EOF mobility exhibits a non-monotonic change with monomer bulk concentration due to counteraction between electric body force and viscous hindrance; the charge fraction of the PEs has a complex and nonlinear effect on the EOF mobility in PE solutions; the EOF mobility exhibits a nonlinear decline for small charge fractions and tends to decrease consistently with the charge fraction for strongly charged cases; the EOF mobility exhibits a scaling law relationship with Kuhn length of polymer monomers and the polymerisation degree of a polymer chain and two scaling laws,
 $\mu _{{eof}} \propto a^{-0.44}$
and
 $\mu _{{eof}} \propto N_p^{-1}$
, are reported; as channel height increases, the EOF profile shifts from the parabolic-like shape to W-shape, and eventually converges to the shape under unconfined conditions, where the EDLs do not overlap.
Second, we investigate the influence of three wall effects, namely adsorption length, surface charge density and slip length on the EOF. We discover that when the surface charge is absent, both the magnitude and direction of EOF are significantly influenced by the adsorption length, while the slip length has no effect. When the wall becomes increasingly charged, the influence of the surface charge density and the slip length on the EOF dominates, whereas that of adsorption length becomes marginal. We also reveal that when the surface wall is oppositely charged to polymer monomers, the EOF mobility extends a nonlinear variation with the surface charge density, while a zero net EOF followed by a mobility reversal is discovered when the surface wall is likely charged to polymer monomers. In the end, we demonstrate that the EOF is affected by various wall effects jointly in a complicated manner by analysing the reversal point of EOF mobility.
This study combines a mean-field EDL theory with a mean-field viscosity model of the semi-dilute PE solution to investigate the EOF of the PE solution in slit nanochannels. Our work can provide a useful reference for studying the EOF of complex fluids. However, we acknowledge that our work focused on only the case of one-dimensional channels with walls of idealised properties, and the model of PE viscosity ina nanochannel still requires improvement since we have not taken shear effects into account. Therefore, more efforts are required to investigate the EOF behaviour of PE solutions in more realistic systems with higher accuracy. In future research, we recommend exploring more complex PE solution systems under various confinement conditions, and utilising more advanced EDL models (such as classic DFT (density functional theory)) and viscosity models (shear-rate dependence) to develop more accurate EOF models. Meanwhile, relevant experiments, such as nanoscale particle image velocimetry and state-of-the-art small flow rate measurement, are expected to be carried out to validate the theory and confirm the prediction.
Acknowledgements
We acknowledge fruitful discussion on the EDL with J. Jiang fromthe Institute of Chemistry, Chinese Academy of Sciences, on the rheology properties of PE solutions with G. Chen from Peking Unversity, and on the EOF with Y. Uematsu from Kyushu Institute of Technology.
Funding
This work was supported by the National Natural Science Foundation of China (grant no. 51976157) and the Fundamental Research Funds for Central Universities.
Declaration of interests
The authors report no conflict of interest.
Data availability statement
The data that support the findings of this study are available from the corresponding author upon reasonable request.
Author contributions
C.Z. and X.L. conceived the idea and designed the algorithm; W.Z. provided theoretical supports; X.L. performed calculations and data analysis; X.L and W.Z. performed visualisation; X.L. wrote the manuscript; W.Z. and C.Z. reviewed and polished the manuscript; K.J., Q.W. and C.Z. discussed the results and provided constructive comments on the manuscript.
Appendix A. Derivation of the governing equations with the variational method
First, the variational method is applied to
 ${\mathcal{F}}={\mathcal{F}}_{{p}}(z)+{\mathcal{F}}_{{i}}(z)+{\mathcal{F}}_{{c}}(z)$
with respect to
 $\phi (z)$
. Noting that the chemical potential is taken as
 $\mu _p=\nu \phi _b^{2}/\beta$
(De Gennes Reference De Gennes1982), and
 $\phi (z)$
exists only in the
 ${\mathcal{F}}_{{p}}(z)$
and
 ${\mathcal{F}}_{{c}}(z)$
, we can obtain
 \begin{equation} -\dfrac {a^{2}}{3}\dfrac {{\rm d}^{2}\phi }{\text{d}z^{2}}+2\nu (\phi ^3(z))-2\phi _b^{2}\,\phi (z)-2\beta e f \psi\, \phi ( z)=0. \end{equation}
Then the governing equation for
 $\phi ({z})$
can be derived as
 \begin{equation} \dfrac {a^{2}}{6}\dfrac {{\rm d}^{2}\phi }{\text{d}z^{2}}=\nu \phi \left(\phi ^{2}-\phi ^{2}_{{b}}\right)-f\phi \beta e \psi, \end{equation}
which is the so-called Edward equation (Uematsu & Araki Reference Uematsu and Araki2013).
Similarly, applying the variational method to
 ${\mathcal{F}}={\mathcal{F}}_{{p}}(z)+{\mathcal{F}}_{{i}}(z)+{\mathcal{F}}_{{c}}(z)$
with respect to
 $c_+(z)$
and
 $c_-(z)$
, and noting that the chemical potentials of small ions are taken as
 $\mu _{i=+/-}=\ln c_{i}/\beta$
(Borukhov et al. Reference Borukhov, Andelman and Orland1998), we can obtain
 \begin{equation} \ln(c_+(z)/c_{{+,b}})+\beta e \psi =0, \end{equation}
 \begin{align} \ln(c_-(z)/c_{{-,b}})-\beta e \psi =0, \\[6pt] \nonumber \end{align}
from which we can derive the expressions for
 $c_+(z)/c_{{+,b}}$
and
 $c_-(z)/c_{{-,b}}$
as (2.8) and (2.9).
Finally, the variational method is applied to
 ${\mathcal{F}}={\mathcal{F}}_{{p}}(z)+{\mathcal{F}}_{{i}}(z)+{\mathcal{F}}_{{c}}(z)$
with respect to
 $\psi (z)$
. In the resultant equation, substituting
 $c_+(z)$
and
 $c_-(z)$
with (A3) and (A4) respectively, we can derive the governing equation for
 $\psi (z)$
as (2.7), which is the modified Poisson–Boltzmann equation.
Appendix B. Validation of the mean-field EDL model via molecular dynamics simulation
We also perform a molecular dynamics (MD) simulation of coarse-grained PE solutions confined in neutral nanochannels to validate the mean-field model utilised in this work. The specific settings of the coarse-grained molecular simulation follow previous works (Ghelichi & Eikerling Reference Ghelichi and Eikerling2016; Bagchi & Olvera de la Cruz Reference Bagchi and Olvera de la Cruz2020; Bagchi, Nguyen & Olvera de la Cruz Reference Bagchi, Nguyen and Olvera de la Cruz2020; Radhakrishnan & Singh Reference Radhakrishnan and Singh2021; Liang & de Pablo Reference Liang and de Pablo2022; Yu et al. Reference Yu, Liang, Rumyantsev and de Pablo2022; Zhu, Luo & Paddison Reference Zhu, Luo and Paddison2022) and will not be elaborated here.
Table 2 presents the key parameters and their values in the calculations. Values of the parameters in the MD simulation are set to be the same as those in our mean-field model. For MD simulations, two approaches (illustrated in figure 23
a,b) have been utilised to describe the charge characteristics of the PE chains. In the first approach, each PE monomer on a PE chain (pink beads in figure 23
 $a$
) is uniformly charged with
 $-0.5e$
. In the second approach, one randomly chosen half of the total monomers on a PE chain are charged, with each monomer carrying
 $-e$
(red beads in figure 23
 $b$
). These two approaches lead to a same charge fraction
 $f=0.5$
. The second approach is more like a real PE solution, and the first is a simplified model of the PE solution. The MD with the first approach is denoted as MD-UC (uniformly charged), and the MD with the second approach is denoted as MD-RC (randomly charged).
Values of key parameters used in the comparison.

The concentration distributions of three charged species, i.e. cations, anions and polyions, across the channel EDL predicted with three methods are shown in figure 23(
 $c$
). It is observed that MD-UC and MD-RC show very remarkable agreement, and the mean-field model in this work also agrees with the two MD simulations reasonably well. These results verify the rationality and reliability of the mean-field EDL model adopted in our study. Furthermore, the net charge density distribution across the channel EDL calculated from figure 23(
 $c$
) is also shown in figure 23(
 $d$
). The interaction of the net charge density and the external electric field induces the EOF observed in the current study.
(a) Snapshot of PE solutions during MD simulation with uniform charges on the chains. Pink beads represent polyions, and each carries
 $-0.5e$
charge. Blue beads represent cations, and yellow beads represent anions. (b) Snapshot of PE solutions during MD simulation with random charges on the chains. Red beads represent polyions, and each carries
 $-e$
charge. Grey beads represent neutral monomers and have the same number as red beads, giving rise to charge fraction 0.5. Blue beads represent cations, and yellow beads represent anions. (c) Comparison of the EDL ion concentration distributions (polyions, cations and anions) across the channel obtained from two MD simulations and the mean-field model. (d) The net charge density distributions across the channel EDL calculated from the data in (c).






