I. INTRODUCTION
Photocatalytic water splitting to produce clean energy carrier, H2 has been widely regarded as one of the ideal solar energy conversion methods in view of global energy and environmental issues. Reference Hisatomi, Kubota and Domen1,Reference Fresno, Portela, Suárez and Coronado2 A variety of mixed oxide semiconductors based on tantalates, titanates, nitrides, niobates, sulfides, oxysulfides, oxynitrides etc., have been extensively studied and reviewed in details for photocatalytic hydrogen generation from water under visible light irradiation. Reference Kudo and Miseki3–Reference Ran, Zhang, Yu, Jaroniec and Qiao15 A common structural feature of the mixed metal oxide photocatalysts is the presence of [BO6] (B = Ti, In, Nb, Ta, etc.) octahedral motif in the crystal structure. Indium titanate, In2TiO5 is a novel oxide, belonging to In2VO5 type with a three-dimensional tunneling structure, made up of [InO6] and [TiO6] octahedral moieties. Reference Wang, Huang, Liu, Lin and Shi16 The [InO6] octahedral units share edges to form infinite chains while the [InO6] and [TiO6] octahedral units are corner shared. A comparison of the Ti–O bond distance, bond angle in octahedral [TiO6], the density and crystal packing factor of In2TiO5 and TiO2 reveals that the coordination environment of Ti in In2TiO5 is more open and flexible than that in TiO2 by virtue of the more distorted TiO6 octahedral units and a lesser value of the crystal packing factor. Reference Wang, Huang, Liu, Lin and Shi16 A structure–activity correlation suggests that photocatalysts with more open structures are more catalytically active. Reference Wang, Huang, Liu, Lin and Shi16–Reference Lin, Huang, Wang, Wang, Xia and Shi19 Thus, enhanced photocatalytic activity of indium titanate in comparison with conventional Degussa TiO2 for H2 generation from aqueous methanol has been investigated in our earlier publications. Reference Pai, Singhal, Banerjee, Tiwari, Dey, Tyagi and Bharadwaj20,Reference Pai, Banerjee, Tripathi, Bharadwaj, Banerjee and Tyagi21 In addition to the more favorable characteristics of the TiO6 polyhedra another advantage In2TiO5 possess is the presence of infinite chains of edge shared [InO6] octahedral units. The presence of InO6 polyhedra in the crystal structure of multi metal oxides of Indium like InNbO4, Reference Lee, Chen and Chen22,Reference Zou, Ye and Arakawa23 InTaO4, Reference Zou, Ye and Arakawa23–Reference Chen, Chou, Wu and Lin25 AgInW2O8, Reference Tang, Zou and Ye26 and In6WO12 Reference Zhang, Chen, Li, Liu, Yu and Zou27 were found to impart favorable photocatalytic properties. Facile charge transfer of photogenerated e − and h + from bulk to surface of the photocatalyst is determined by the crystal structure, particle size, and crystallinity of the sample. Such infinite chains formed by edge or corner sharing of polyhedral (InO6) units will facilitate the charge transfer from bulk to the surface of a photocatalyst. It is well reported Reference Chen, Shen, Guo and Mao5,Reference Sato, Saito, Nishiyama and Inoue28 that indates with alkali metal ion, alkaline earth metal, and lanthanide such as RuO2/CaIn2O4, SrIn2O4, Sr0.93Ba0.07In2O4, RuO2/AInO2 (A = Li, Na) and LnInO3 (Ln = La, Nd) possess In3+ ion (d 10 configuration) in octahedrally coordinated InO6 units. The geometric characteristics of the InO6 octahedral units in these indates were compared and found that the presence of distorted InO6 octahedra with dipole moments is responsible for high photoactivity of indates. The dipole moments induce an internal field which promoted the charge separation in the very initial process of photoexcitation. The characteristics of the [InO6] octahedra in In2TiO5 as derived from the Reitveld refinement results i.e., the In–O bond distances/angle are reported in our recent publication Reference Banerjee, Pai, Arya and Bharadwaj29 and also compared with the reported values of some other representative photocatalyst containing the InO6 polyhedra. Even the In–O bond distances suggest the more flexible InO6 geometry in In2TiO5 than InTaO4 or InNbO4.
The crystal structure and luminescent properties of indium titanate oxide, In2TiO5 has been reported by Gaewdang et al. Reference Gaewdang, Chaminade, Gravereau, Garcia, Fouassier, Hagenmuller and Mahiou30 Wang et al. Reference Wang, Huang, Liu, Lin and Shi16 reported that indium titanate could serve as an active photocatalyst for the UV-induced photo-degradation of methyl orange dye. We optimized the crystallinity and surface area of Indium titanate nanoparticles to achieve maximum H2 yield. Reference Pai, Singhal, Banerjee, Tiwari, Dey, Tyagi and Bharadwaj20 Role of A-site substitution by rare earth, Nd ions in inducing visible light activity by modifying the band structure and electronic properties of UV active Indium titanate was investigated and reported by us. Reference Pai, Majeed, Banerjee, Arya, Bhattacharya, Rao and Bharadwaj31 Recently, we have reported density functional theory (DFT+U) calculations combined with experiments to investigate effect of Ni ion substitution at In3+ site in modifying the fundamental key properties such as band gap, electronic transitions, crystal structure, light absorption of In2TiO5. Reference Banerjee, Pai, Arya and Bharadwaj29
These results prompted us to investigate the effect of B-site substitution on photocatalytic properties of indium titanate. In the present study, with an objective to modify the band gap and catalytic properties of UV active In2TiO5 photocatalyst, an aliovalent substitution by Tm3+ cation [Tm = Fe3+ (0.64 Å), Cr3+ (0.63 Å)] at B-site was therefore attempted, incorporating some micro-structural changes in their lattice. It is therefore apparent that the substitution of a smaller lower-valent ion in place of Ti4+ (ionic radius = 0.68 Å) is likely to form an anion deficient solid solution with partial loss of oxygen in the lattice (δ). The reducibility, oxidizability, and stability of these Fe/Cr substituted oxides Reference Pai, Banerjee, Bharadwaj and Kulshreshtha32 and Ni substituted indium titanate, Reference Banerjee, Pai, Jagannath and Bharadwaj33 toward multiple temperature-programmed reduction/oxidation cycles for evaluating their thermal behavior have been earlier reported by us. Transition metal ions may play a role of electron scavengers via M n+ + e cb → M(n−1)+, where M n+ = Cu2+, Mn3+, Fe3+, Cr3+, Ni2+ and thereby facilitates the charge separation, limiting the recombination reaction to improve the photocatalytic activity. Here we report, systematic investigations on the In2Ti1−x Fe x O5−δ, (0.0 ≤ x ≤ 0.2) mixed metal oxide catalysts, synthesized using solid–state reaction, characterized by powder x-ray diffraction (XRD) and vibrational spectroscopy. Dynamic light scattering (DLS) was used for evaluating particle size and distribution as a function of Fe substitution. The oxidation state and sites where Fe is incorporated was explored using Mössbauer spectroscopy. The chemical oxidation states of individual metal ions of Cr substituted multi-component oxides were identified using x-ray photoelectron spectroscopy (XPS). The photocatalytic activity was evaluated for H2 generation from water in presence of methanol as sacrificial agent under solar simulated light. Role of Pt as cocatalyst in enhancing the photocatalytic H2 yield was also monitored.
II. EXPERIMENTAL
Mixed oxides with nominal composition, In2Ti1−x Fe x O5−δ, In2Ti1−x Cr x O5−δ, for 0.0 ≤ x ≤ 0.2, were synthesized through ceramic route by mixing reactant oxides in appropriate stoichiometry as depicted by following equations:
 $${\rm{I}}{{\rm{n}}_2}{{\rm{O}}_3} + \left( {1 - x} \right){\rm{Ti}}{{\rm{O}}_2}{\rm{\ }} + {x \mathord{\left/ {\vphantom {x {2{\rm{F}}{{\rm{e}}_2}{{\rm{O}}_3}}}} \right. \kern-\nulldelimiterspace} {2{\rm{F}}{{\rm{e}}_2}{{\rm{O}}_3}}} <$$><$$>\to {\rm{I}}{{\rm{n}}_2}{\rm{T}}{{\rm{i}}_{1 - x}}{\rm{F}}{{\rm{e}}_x}{{\rm{O}}_{5 - \delta }}\quad ,$$
 $${\rm{I}}{{\rm{n}}_2}{{\rm{O}}_3} + \left( {1 - x} \right){\rm{Ti}}{{\rm{O}}_2}{\rm{\ }} + {x \mathord{\left/ {\vphantom {x {2{\rm{C}}{{\rm{r}}_2}{{\rm{O}}_3}}}} \right. \kern-\nulldelimiterspace} {2{\rm{C}}{{\rm{r}}_2}{{\rm{O}}_3}}} <$$><$$>\to {\rm{I}}{{\rm{n}}_2}{\rm{T}}{{\rm{i}}_{1 - x}}{\rm{C}}{{\rm{r}}_x}{{\rm{O}}_{5 - \delta }}\quad .$$
The pellets of homogeneous mixtures were calcined, first at 600 °C for 120 h and then at 700 °C for 48 h and finally at 1000 °C for 24 h, with intermittent grindings so as to ensure the uniformity and the completion of the reaction similar to our procedure. Reference Pai, Banerjee, Bharadwaj and Kulshreshtha32
To further improve the photocatalytic hydrogen production, Pt as cocatalyst (∼1% by weight) was loaded on the photocatalyst oxide by the photo-deposition method. For this purpose, 0.1 g of the catalyst was mixed with 25 mL of water, 5 mL of ethanol, and 2.5 mL of chloroplatinic acid hexahydrate (H2PtCl6·6H2O, 0.002 M). The resulting reaction mixture was evacuated in a quartz cell and then irradiated under medium-pressure mercury lamp (Hg, Ace Glass Inc., 450 W; Philips India Ltd., Bahadurgarh, India) for about 3 h. After irradiation, the solution was washed with ethanol, filtered and the residue was dried in an oven at 100 °C.
The Powder XRD patterns were recorded on a Philips diffractometer (model PW 1710; Koninklijke Philips N. V., Amsterdam, the Netherlands), equipped with a graphite monochromator and Ni-filtered Cu–Kα radiation. Vibrational spectra of samples were recorded in Fourier Transform Infrared (FTIR) Spectrophotometer, model FTIR-600 (JASCO, Tokyo, Japan). FTIR spectra of all the samples were recorded in the mid IR region (4000 cm−1 –400 cm−1). Dry KBr (∼200mg) was mixed with the sample (∼2.5mg) and ground for homogenization. The mixture was pelletized to a thin wafer-like transparent pellet at ∼5 tons cm−2. These pellets were used for FTIR spectral measurements. N2-Brunauer, Emmett and Teller (N2-BET) surface area was measured with a Sorptomatic 1990 (CE Instruments, Manchester, U.K.) nitrogen as the adsorbing gas.
The particle size distribution was monitored by a DLS using Malvern 4800 Autosizer employing an Ar ion laser (λ = 514.5 nm) and a digital correlator. The scattered light intensity was monitored at a scattering angle of 90° and the intensity correlation function over a time range of 10−6 to 1 s was computed.
Mössbauer spectra at ambient temperature have been obtained using a spectrometer operated in the constant acceleration mode. The source used is 57Co in Rh matrix.
The calibration of the velocity scale is done using iron metal foil.
XPS studies were carried out on electron spectrometer using Mg–Kα x-rays (hν = 1253.6 eV) as the primary source of radiation. The appropriate corrections for charging effect were made with the help of a C 1s signal appearing at 285.1 eV.
The band gap of all semiconductor oxide samples was estimated by recording their diffuse reflectance UV–visible spectra using a spectrophotometer of JASCO model V-670 (Tokyo, Japan), scanned in the range of 200–1000 nm at the scanning speed of 200 nm/min.
Photocatalytic properties of all samples were investigated under UV–visible irradiation. The samples were irradiated under a medium-pressure mercury lamp (Hg, Ace Glass Inc., 450 W; Philips India Ltd.) surrounded with water circulation jacket to absorb IR irradiation. The activity measurements were carried out in typical outer irradiation reaction assembly that is placed horizontally to a water-cooled medium pressure mercury vapor lamp inside a chamber equipped with reflectors. The emission spectrum of lamp in UV–visible wavelengths and reaction assembly are reported in our earlier publication. Reference Pai, Majeed, Banerjee, Arya, Bhattacharya, Rao and Bharadwaj31 Photocatalytic activity was evaluated in a rectangular quartz reactor of dimensions (10 × 2.1 × 2.1 cm3, 81 mL), equipped with a sampling port provided with a septum through which the gas mixture could be removed for analysis and a valve used for evacuation. 0.1 g of catalyst was suspended in water + methanol mixtures (33% v/v, 15 mL). Reaction mixtures were evacuated before irradiation to provide air free conditions as oxygen acts as an electron scavenger. Photocatalysts suspended in water–methanol mixtures were then irradiated under UV–visible light for duration of 4–6 h. The reaction products were analyzed using a gas chromatograph (model Michro-1100, Netel, India) equipped with a thermal conductivity detector, a molecular sieve column with argon as the carrier gas was used in the isothermal temperature mode at 50 °C oven temperature. The flux of medium pressure mercury lamp was measured using a silicon photodiode based light meter. The number of photons falling on the reaction cell or flux of medium pressure mercury lamp was determined to be 19 × 104 Lux or 278.2 W/m2 in horizontal geometry irradiation of UV–visible photoirradiator.
III. RESULTS AND DISCUSSIONS
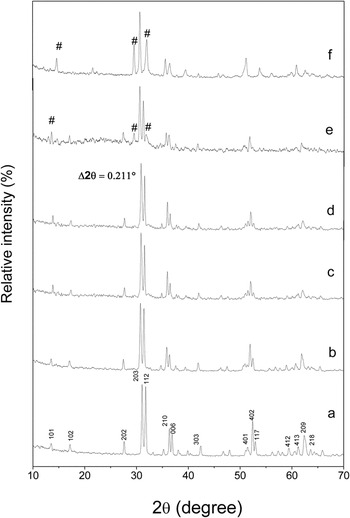
Powder XRD patterns of In2Ti1–x Fe x O5−δ and In2Ti1−x Cr x O5−δ, compositions were recorded and shown in Fig. 1. Solid-state synthesis was complete and no traces of free reactant oxides such as TiO2 and In2O3 were found in the XRD patterns of Fe/Cr substituted or pristine samples shown in Fig. 1. The XRD pattern of x = 0 shown in curve a, matches with that of orthorhombic In2TiO5 (JCPDS card No.30-0640) oxide with a = 7.2412 Å, b = 3.42721 Å, c = 14.8786 Å, cell Volume = 369.244 Å3, and Z = 4. XRD patterns of Fe substituted samples, (0.05 ≤ x ≤ 0.2) reveal that Fe substitution has resulted in single-phase material comprised of In2TiO5 phase as shown in Figs. 1(b)–1(d). A shift of 0.211° toward lower 2θ values with respect to pristine sample was observed in In2Ti0.8Fe0.2O5−δ suggesting solid solution formation with inclusion of Fe3+ ions at Ti4+ site. XRD patterns of Cr-substituted oxides, In2Ti1−x Cr x O5−δ are shown in Figs. 1(e) and 1(f). The XRD powder pattern of Cr substituted sample with nominal composition, In2Ti0.9Cr0.1O5−δ consists of strong peaks due to In2TiO5 phase and in addition weak reflections attributable to Cr0.286Ti0.714O1.857 (JCPDS card No. 30-416) phase were observed and marked as # in curve e. The intensities of XRD lines due to this new phase increased with increase in Cr content as seen in curve f for nominal composition of In2Ti0.8Cr0.2O5−δ. Thus, Fe3+ substitution at B-site resulted in single-phase material isomorphic to In2TiO5 phase. However, Cr substitution up to 20 mol% has resulted in segregation of a secondary phase due to limited solubility of Cr3+ in In2TiO5 lattice.
XRD patterns of unsubstituted In2TiO5 (a), substituted oxides, In2Ti1−x Fe x O5−δ (b-d) and In2Ti1−x Cr x O5−δ (e-f). XRD peak # XRD lines due to Cr0.286Ti0.714O1.857 phase. (a) In2TiO5, (b) x = 0.1 Fe, (c) x = 0.15 Fe, (d) x = 0.2 Fe, (e) x = 0.1 Cr and (f) x = 0.2 Cr.

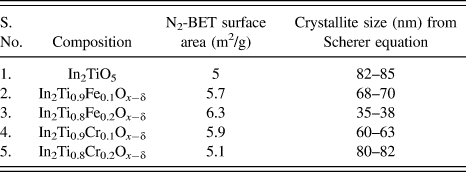
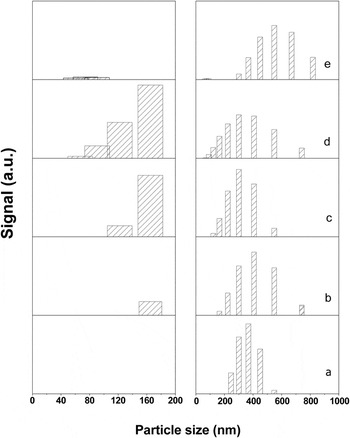
The crystallite size estimated from XRD line width using Scherer equation of different samples as a function of Fe and Cr substitution are listed in Table I. It is clear that Fe substitution has significantly contributed in decreasing the crystallite size. In case of In2Ti1−x Cr x O x−δ samples, however decrease in crystallite size was observed only up to 10% of Cr substitution whereas for biphasic sample i.e., In2Ti0.8Cr0.2O x−δ an increase in crystallite size was observed. Substitution at Ti4+ sites by Fe3+ metal ions induced nonstoichiometry in the In2TiO5 oxide. The generation of nonstoichiometry may have resulted in lowering of crystallite size. Fe substituted nonstoichiometric oxides with decreased crystallite size has been prepared by us in our earlier study also, where La0.8Sr0.2MnO3 (LSM) perovskites were investigated and found that Fe substitution has played a significant role in decreasing the crystallite size. Reference Pai, Wani, Shreedhar, Singh and Gupta34 Similar study on (La1−x Ca x )FeO3 perovskite-type oxides reported that crystallite size decreased with increasing x and such samples with smaller particle size exhibited a higher catalytic activity. Reference Taguchi, Masunaga, Hirota and Yamaguchi35 All samples are highly crystalline with large crystallite size (>50 nm) and very low N2-BET surface area (5–7 m2/g) as mentioned in Table I. Particle size distribution for Fe and Cr substituted oxides was monitored by DLS experiments and is shown in Fig. 2. The distribution is divided in two ranges one is having particles less than 200 nm and other is particles of sizes between 200 and 1000 nm. Pristine In2TiO5 oxide is devoid of particles with size less than 200 nm and consists of large size particles with sizes more than 200 nm as shown in curve a of Fig. 2. However, Fe substitution has shifted the distribution toward smaller particle size (curves b–d) and it was observed that with increase in Fe content, number of particles with size <200 nm increased progressively. Nominal composition, In2Ti0.8Fe0.2O5−δ, has maximum number of small sized particles. This is in agreement with the trend observed in crystallite size (Table I). Cr substitution has slightly induced the decrease in particle size. This difference can be explained by nature of samples, Fe substituted samples are solid solutions with single phase isomorphic to indium titanate, whereas in Cr substituted samples a secondary phase of chromium titanate, Cr0.286Ti0.714O1.857 segregated out in addition to parent indium titanate phase.
N2-BET surface area and crystallite size from Scherer equation using XRD line width for In2Ti1−x Tm x O5−δ (Tm = Fe3+, Cr3+) samples calcined at 1000 °C as a function of x.

Particle size distribution observed by DLS experiments for In2Ti1–x Tm x O5–δ (Tm = Fe3+, Cr3+) oxides for different values of x. (a) In2TiO5, (b) x = 0.05 Fe, (c) x = 0.1 Fe, (d) x = 0.2 Fe and (e) x = 0.1 Cr.

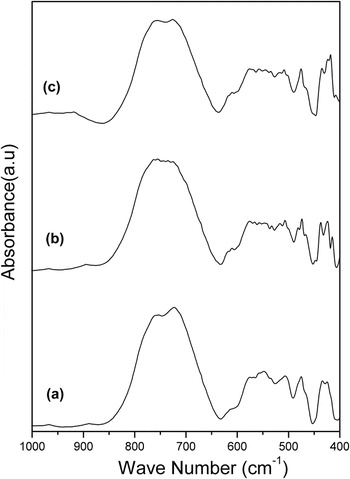
FTIR absorption spectra of In2Ti1−x Fe x O5−δ in the region of 400–900 cm−1 are shown in Fig. 3. The compound In2TiO5 belongs to the space group D 2h which has a center of inversion. Reference Paques-Ledent36 A broad band in range of 650–850 cm−1 is mainly due to the internal vibrations of TiO5. IR spectra of Fe substituted oxides are shown in curves b and c of Fig. 3. There are no additional changes as compared to unsubstituted indium titanate oxide. IR bands due to impurity reactant phases are absent in the Fe substituted samples. The present results corroborate well with that of XRD and confirm that Fe substituted samples are single phased isomorphic to In2TiO5.
FTIR spectra of (a) In2TiO5, (b) In2Ti0.9Fe0.05O5–δ and (c) In2Ti0.85Fe0.15O5–δ.

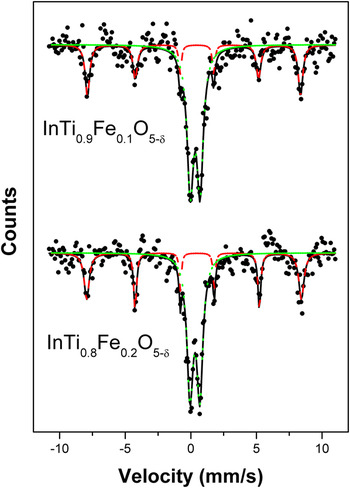
Mössbauer spectra of Fe substituted samples, InTi1−x Fe x O5−δ (x = 0.1 and 0.2) are shown in Fig. 4. Mössbauer spectra at ambient temperature are fitted with one symmetric doublet and one sextet of both the samples. The component spectra are shown by dotted lines. The results of the analysis are given in the Table II. Iron exists in high spin Fe3+ state in both the oxides as confirmed by isomer shift values.
Mössbauer spectra of In2Ti1–x Fe x O5–δ samples under ambient conditions.

Parameters derived from Mössbauer spectra of InTi1−x Fe x O5−δ (x = 0.1 and 0.2) oxides.

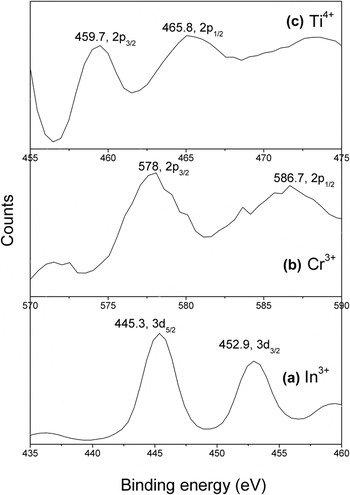
X-ray photoelectron spectra of In2Ti0.8Cr0.2O5−δ sample was recorded to identify the oxidation states of In, Ti and Cr metal ions as shown in Fig. 5. In these spectra, the binding energies at 578.2 and 459.7 eV, respectively, correspond to Cr (2p 3/2) and Ti (2p 3/2), which matches with the reported binding energies for Cr in +3 and Ti in +4 oxidation states. Reference Wagner, Riggs, Davis, Moulder and Muilenberg37 Binding energy at 445.7 eV as observed in the XPS spectra suggested the existence of indium in a +3 oxidation state. A shoulder appears at higher binding energy in the XPS peak due to In3d 5/2, as shown in Fig. 5 for the In2Ti0.8Cr0.2O5−δ oxide. The appearance of a shoulder is attributed to the interaction of In3+ with the other ions present in the compound.
XPS spectra of In2Ti0.8Cr0.2O5–δ photocatalyst (a) In3+, (b) Cr3+ and (c) Ti4+.

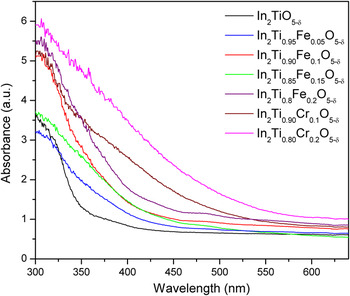
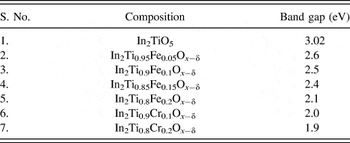
Fig. 6 illustrates the light absorption properties of In2TiO5, In2Ti1−x Fe x O5−δ, and In2Ti1−x Cr x O5−δ samples showing that the visible absorption spectra of these compounds are characteristic of photocatalysts able to respond to visible light. The band gap of these compounds can be estimated from plots of the Kubelka–Munk functions F(R) versus photon energy. Reference Skoog, Holler and Nieman38,Reference Kubelka39 The band gap is likely to occur between the top of the oxygen 2p band and the bottom of the Ti 5d (t 2g) band. The absorption spectrum of indium titanate is shown by black curve with absorption band edge from 300 to 500 nm corresponding to an optical gap of 3.02 eV which is in UV region. The position of the absorption edge has shifted to higher wavelengths for further Fe and Cr substituted samples revealing that the Tm3+ ion substitution has enabled the sample to absorb in visible region. One of the most characteristic features is that the band gap, E g is narrowed with Fe and Cr doping. The band gap is decreased from 3.02 eV (In2TiO5) Reference Wang, Huang, Liu, Lin and Shi16,Reference Banerjee, Pai, Arya and Bharadwaj29–Reference Pai, Majeed, Banerjee, Arya, Bhattacharya, Rao and Bharadwaj31 to 2.1 eV (In2Ti0.8Fe0.2O x−δ) and to 1.9 eV in case of Cr substitution (In2Ti0.8Cr0.2O5−δ). The band gaps of all the oxides measured using diffuse reflectance spectra are listed in Table III. This is considered largely to be a consequence of the Fe 3d or Cr 3d level. Reference Choi, Park and Hoffmann40
Diffuse reflectance UV–Vis spectra of In2Ti1−x Tm x O5−δ (Tm = Fe3+, Cr3+) photocatalysts.

Band gap (E g) measurements using diffuse reflectance spectra of In2Ti1−x Tm x O5−δ (Tm = Fe3+, Cr3+) samples calcined at 1000 °C as a function of x.

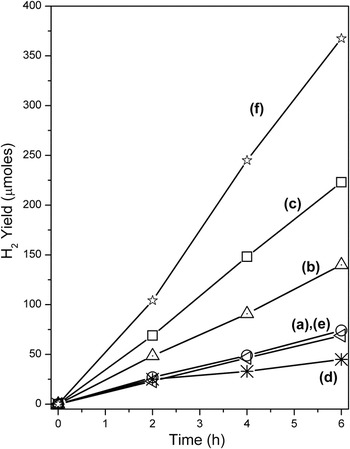
To suppress the recombination reaction, photocatalytic water splitting is performed in presence of a sacrificial agent. Photoactivity in presence of methanol was compared with ethanol and also amount of methanol was optimized. The amount increased further almost five fold with methanol as compared to ethanol. Thus, amount of hydrogen-generated photocatalytically under similar conditions is in following order: H2O + methanol (2:1 v/v) > H2O + methanol (5:1 v/v) > H2O + ethanol (2:1 v/v) > methanol. Photocatalytic activity of mixed metal oxides, In2Ti1−x Tm x O5−δ (Tm = Fe3+ and Cr3+, 0.0 ≤ x ≤ 0.2) was evaluated for H2 evolution from an aqueous methanol solution under UV–visible light irradiation. The photocatalytic H2 yield at regular time periods over different samples is shown in Fig. 7. It is evident that all the Fe3+ and Cr3+substituted and pristine indium titanate oxides are photocatalytically active. Transition metal ion substitution has enhanced the photocatalytic activity of indium titanate. Further, it is observed that photocatalytic H2 yield increased with increase in Fe content. Maximum H2 yield approximately 371.6 (μmol/g)/h was observed over In2Ti0.8Fe0.2O x−δ. Pt (1% w/w) was dispersed as cocatalyst on In2Ti0.8Fe0.2O x−δ catalyst by UV photodeposition method. The loading of cocatalyst further enhanced the H2 yield by 2-fold to 612.5 (μmol/g)/h under identical conditions. The decreasing order of photocatalytic H2 yield over different photocatalysts was Pt–In2Ti0.8Fe0.2O x−δ (1% w/w) > In2Ti0.8Fe0.2O x−δ > In2Ti0.9Fe0.1Ox-d > In2Ti0.8Cr0.2O x−δ ≈ In2TiO5 > In2Ti0.9Cr0.1O x−δ. For comparison, the amount of H2 generated from In2O3 was evaluated and was found to be lesser than the H2 generated from substituted and unsubstituted mixed oxide catalysts. Fe3+ ion substitution is more favorable for photocatalytic properties as compared to Cr3+ ion substitution in In2TiO5 lattice that may be attributed to single phased compositions achieved with former. Formation of defects at grain boundaries in biphased samples are prevented in single phased samples that otherwise would act as recombination centers for photogenerated electrons and holes. Reference Kudo and Miseki3,Reference Chen, Shen, Guo and Mao5 Shaislamov et al. Reference Shaislamov and Yang41 demonstrated that single-crystalline nanotubes showed improved photocatalytic properties compared to polycrystalline nanotubes due to lower rate of recombination reaction. The grain boundaries in the polycrystalline nanotubes act as sites for recombination reaction and therefore are a barrier of the effective carrier pathway. Also, the photocatalytic activities of biphasic compounds would be determined by the activities of individual phases present in solid solutions. In our recent study Reference Banerjee, Pai, Arya and Bharadwaj29 on Ni doped In2TiO5, co-formation of symmetric rhombhohedral ilmenite NiTiO3 phase in In2(1−x)Ni2x TiO5 oxides in addition to flexible orthorhombic indium titanate phase was observed. The deterioration of activity coincided with emergence of this new phase. Therefore, presence of secondary NiTiO3 phase in small amounts was detrimental for the photoactivity of indium titanate samples. The combination of a proper band gap, electronic properties, crystallinity and crystal structures are responsible for highest photocatalytic activity of In2Ti0.8Fe0.2O5−δ among these substituted Fe/Cr semiconductor oxides.
Time courses of photocatalytic H2 generated over undoped In2TiO5 (a), In2Ti1−x Fe x O5−δ as a function of values of x = 0.1 (b), 0.2 (c), and In2Ti1−x Cr x O5−δ, x = 0. 1 (d), 0.2 (e) and in presence of Pt as cocatalyst, Pt−In2Ti0.8Fe0.2O5−δ (1% w/w) (f) Reaction conditions: 0.1 g catalyst, water + methanol (33% v/v), evacuated and irradiated under water cooled medium-pressure mercury light source.

IV. CONCLUSIONS
B-site substitution by a trivalent transition metal cation, Tm3+ (Fe3+ and Cr3+) in indium titanate resulted in the formation of single phased In2Ti1−x Fe x O5−δ and mixed phased In2Ti1−x Cr x O5−δ, compositions. The In2Ti1−x Fe x O5−δ samples were isomorphic with In2TiO5 phase. An impurity phase of Cr0.286Ti0.714O1.857 emerged in Cr substituted samples in addition to parent phase. The cationic substitution by aliovalent Fe3+ ions at Ti4+ sites has resulted in considerable decrease of the particle size of In2Ti1−x Fe x O5−δ compositions (36–38 nm) as compared to parent In2TiO5 oxide (82–85 nm) calcined at 1000 °C. Transition metal ion incorporation decreased the band gap from 3.2 (In2TiO5) to 2.1 eV (In2Ti0.8Fe0.2O x−δ) and to 1.9 eV in case of Cr substitution (In2Ti0.8Cr0.2O5−δ) attributed to participation of Fe 3d/Cr 3d levels. The decreasing order of photocatalytic H2 yield from aqueous methanol over different photocatalysts was Pt–In2Ti0.8Fe0.2O x−δ (1% w/w) > In2Ti0.8Fe0.2O x−δ > In2Ti0.9Fe0.1Ox-d > In2Ti0.8Cr0.2O x−δ ≈ In2TiO5 > In2Ti0.9Cr0.1O x−δ. Above trend implies that Fe3+ ion substitution at B-site is more favorable as compared to Cr ion substitution. The favorable photocatalytic properties of Fe substituted indium titanate over Cr substitution is attributed to modified morphological and bulk properties.
ACKNOWLEDGMENTS
Authors thank Dr. P. A. Hassan, Chemistry Division and Mr. Sher Singh Meena, Solid State Physics Division of BARC for recording dynamic light scattering and Mossbaeur spectra, respectively.