1. INTRODUCTION
In recent years, auto and consumer electronics manufacturers and suppliers have introduced new infotainment devices such as portable media (MP3) players, mobile phones, portable and in-vehicle navigation systems, and rear-seat video systems. The use of these devices has been the subject of considerable recent research (Burnett, Reference Burnet2000; Eby and Molnar, Reference Eby and Molnar2001; May, et al., Reference May, Ross and Bayer2003; Pugliesi, et al, Reference Pugliesi, Decanini and Tachibana2009; Lee, Ma, and Cheng, Reference Lee, Ma and Cheng2010). These devices are widely used by drivers and can increase the mobility and comfort of drivers and passengers. However, tasks associated with operating these devices can distract drivers and may increase the crash risk. Stutts, Reinfurt, Staplin, and Rodgman (Reference Stutts, Reinfurt, Staplin and Rodman2001) reported that tasks such as “adjusting radio, cassette, CD,” “using other device/object brought into vehicle,” “adjusting vehicle/climate controls,” and “using/dialling cellular phone” accounted for 19% of crashes involving distracted drivers, with “adjusting radio, cassette, CD” being ranked second among major causes. Tsimhoni, Smith and Green (Reference Tsimhoni, Smith and Green2002; Reference Tsimhoni, Smith and Green2004) reported distraction associated with navigation system use, especially when entering an address while driving.
The visual-manual tasks associated with operating many of these devices require drivers to look away from the road for some time and crash risk is known to increase with eyes-off-road time. For example, the destination entry task time for a navigation system varies from 40 seconds to 1 minute, depending on the method of input and the specific destination to be entered (Carter and Graham, Reference Carter and Graham2000; Tsimhoni, Reference Tsimhoni, Smith and Green2002, Reference Tsimhoni, Smith and Green2004; Itoh et al., Reference Itoh, Miki, Yoshitsugu, Kubo and Mashimo2004; Minker et al., Reference Minker, Haiber, Heisterkamp and Scheible2004; Forlines et al., Reference Forlines, Schmidt-Nielsen, Raj, Wittenburg and Wolf2005). One potential way to reduce crash risk is to use speech-controlled interfaces instead of visual-manual interfaces.
In the past decade, many projects focused on either the development of speech-controlled interfaces or the comparison of performance of speech-controlled interfaces with visual-manual interfaces. These projects include SYNC developed by Ford and Microsoft (Ford SYNC®); SENECA (speech control modules for entertainment, navigation, and communication equipment in cars) developed by DaimlerChrysler, TEMIC Research, and the University of Ulm (Minker et al., Reference Minker, Haiber, Heisterkamp and Scheible2004); CHAT (Conversational Helper for Automotive Tasks) developed by the Center for the Study of Language and Information at Stanford University (Weng et al., Reference Weng, Varges, Raghunathan, Ratiu, Pon-Barry, Lathrop, Zhang, Scheideck, Bratt, Xu, Purver, Mishra, Raya, Peters, Meng, Cavedon and Shriberg2006; Reference Weng, Yan, Feng and Ratiu2007); and VICO (the Virtual Intelligent Co-Driver) funded by six different partners in Europe (Geutner et al., Reference Geutner, Steffens and Manstetten2002). Common applications include navigation, music selection and cellular phone use. Although system developers claim these systems are human-centred, there is limited research, especially for speech-controlled interfaces, on what users want to do or how these systems are actually used.
A human-centred navigation system should support travel to the most common destinations. One important source of information about these destinations is the National Household Travel Survey (NHTS), a US Department of Transportation (DOT) National Highway Traffic Safety Administration funded periodic study of personal travel in the United States (Hu and Reuscher, Reference Hu and Reuscher2004). Similar studies have been conducted in other countries (e.g., United Kingdom, Denmark) (US DOT, 1994). Common trip purposes in these surveys included “shopping/errands,” “go to school,” and “medical/dental services,” which could be used to define the point of interest (POI) categories for navigation systems. However, estimating the real use of navigation systems from these surveys may be speculative, as one would suspect navigation systems to be used to provide guidance to unfamiliar destinations, not all destinations, and these surveys do not address how destinations are entered into navigation systems. Furthermore, designers, in the absence of information, tend to think of users as being like themselves and, thus, in some instances, may design the systems for themselves. Therefore, data comparing the travel patterns of vehicle designers with the general public is needed.
This information is particularly important for assessing the compliance of navigation systems with existing design guidelines, in particular AAM guideline 2.1a (Alliance of Automobile Manufacturers, 2006) and SAE Recommended Practice J2364 (Society of Automotive Engineers, 2004). These guidelines require that destination retrieval times not exceed specific maxima. However, designers often must compromise to meet these criteria: the goal is to facilitate the use of the most commonly used methods, for which at this point there are no published statistics. Furthermore, most navigation systems provide lists of recently visited destinations and saved favourites, from which users can search. Since there are no published data on the use or content of these lists, populating them requires guesswork, making safety and usability tests potentially unrealistic.
To address these topics, researchers collected two types of data – estimates of use from subject reports (survey data) and actual use (data retrieved from subjects' navigation systems) of typical drivers and automotive experts, mostly engineers. Specifically, nine questions were addressed:
• Reported use from a survey:
1. How many trips occurred per year?
2. What was the purpose of the trips and how far did subjects drive?
3. How necessary was the navigation system for each trip?
4. How often were manual and speech interfaces reportedly used to enter destinations, and how long did subjects estimate it took to enter them?
5. How did the reported methods used to enter destinations vary with trip purposes?
6. When a speech entry error occurred, how did subjects report that they corrected it?
Recovered from subjects' navigation systems:
7. What was the frequency of recent destinations that drivers actually visited using navigation systems?
8. Which methods did drivers actually use to enter destinations?
9. What was the frequency distribution of the point of interest (POI) categories that subjects saved in “Favourite” lists in their navigation systems?
2. METHODS
2.1. Subjects and their navigation systems
Thirty licensed drivers (16 F, 14 M; 28±10 years) from southeast Michigan (typical drivers) who regularly use their navigation systems while driving were recruited via newspaper advertisements, web advertisements, and an email sent to students, faculty, and staff at the University of Michigan, friends of the authors, and members of the community. This sample was chosen largely for the convenience of accessing subjects and their vehicles. More than half (17/30) of the subjects in the group of typical drivers were students from a wide variety of academic disciplines. Only six of the thirty subjects were engineers (five engineering students and one mechanical engineer). Twenty-three of the thirty typical drivers were native English speakers. A second group of eleven licensed drivers (1F, 10 M; 39±10 years) who regularly use their navigation systems while driving was recruited from the Nissan Technical Center in Farmington Hills, Michigan (auto experts). Most of the auto experts were engineers (mechanical, electrical, and project engineers). Ten of the eleven auto experts were native English speakers. All navigation systems were programmed to be operated in English.
The typical drivers drove vehicles from a wide range of manufacturers, with Toyota (7/30) and Ford (6/30) being most common. Vehicles were typically of the 2003 and 2004 model years. All auto experts drove Nissan vehicles (most commonly of the 2007 and 2008 model years), reflecting an employee benefit. Data were collected in 2009.
Typical drivers predominately used portable aftermarket navigation systems made by Garmin (n=14), Tom Tom (n=5), and other manufacturers (n=7), but some used various types of built-in navigation systems (n=4) as well. For the auto experts, ten of the eleven subjects used Nissan built-in navigation systems, and one subject used a portable Garmin unit. The mean years of owning current devices were 3±1·5 years for typical drivers and 2±0·5 years for auto experts.
Omitting one Nissan employee who reported that she drove more than 128,000 miles/year, the typical drivers reported a mean of 10,900 miles/year, whereas the mean was 14,000 miles annually for the auto experts. To provide some context, the most recent population survey data indicated a mean annual mileage of about 14,000 miles in the United States (Hu and Reuscher, Reference Hu and Reuscher2004), but only 3,500 miles in the United Kingdom (Department of Transport 2009), where public transportation is more readily available and gasoline is more expensive. Thus, the typical driver sample here drove somewhat fewer miles than in another larger survey, but the auto experts were quite close to the U.S. survey's mean.
2.2. Questionnaire
A seven-page questionnaire was designed to collect biographic information about the subjects as well as information on their navigation systems and MP3 players. This paper reports results for navigation systems. There were eight questions concerning biographical information, such as name, age, vehicle driven, miles driven per year, as well as information on the frequency of various types of trips. Using a modification of Hu and Reuscher's (Reference Hu and Reuscher2004) scheme, trips were categorized as business, vacation, religious, shopping, or school. There were seven questions concerning each subject's navigation system, such as the manufacturer, familiarity with each destination, percent and time using speech/manual input, the frequency of use of various destination entry methods, and error correction strategies for speech entries. Subject's familiarity with recently visited destinations was categorized as “Capable of getting to location without navigation directions (familiar),” “Capable of getting to location with some navigation directions (somewhat familiar),” and “Incapable of getting to location without navigation directions (unfamiliar).” Error correction strategies modified from Bourguet's (Reference Bourguet2006) scheme were categorized as “repeat exactly the same words,” “rephrase or say it in different words,” “spell the words out,” and “correct by entering in the words manually.”
2.3. Procedures
The typical drivers brought their vehicles and navigation systems to the University of Michigan Transportation Research Institute (UMTRI) in Ann Arbor, Michigan. They were given an overview of the study and signed the consent form that had been approved by the University of Michigan Health and Behavioral Sciences Institutional Review Board (IRB). Next, the previously described questionnaire was completed. While subjects answered the questions, the investigator transcribed and photographed the information stored in the subjects' navigation systems, including the content of their Favourite lists (destinations they entered and saved) and History lists (recent destinations selected). If there were more than nine records saved in their navigation system from either list, only the nine most recent trips and favourites from each list were transcribed for each subject due to time constraints. After the subjects finished the questionnaire, they were asked to confirm the trip purpose and entry method for the destinations stored on their Favourite and History lists. Finally, the typical drivers were paid $20 for their participation in this 40-minute survey.
At Nissan, a recruiting message, a consent form, and the questionnaire were distributed via email. A Nissan coordinator arranged for auto experts to participate, with interviews conducted at the Nissan Technical Center in Farmington Hills, Michigan. During the interviews, investigators checked to see that subjects answered all the previously disseminated questions, and then transcribed and photographed information identifying what was stored in each subject's navigation system. Other procedures were similar to the procedures for typical drivers. Since the auto experts were surveyed during business hours, they were not paid for their participation. The study required approximately 30 minutes per subject.
3. RESULTS / DISCUSSIONS
3.1. How many trips occurred per year?
The total number of trips per year from the US survey, 1388 trips/year/person (Hu and Reuscher Reference Hu and Reuscher2004), was three times more than reported here for both groups (369 trips/year/driver for typical drivers, and 409 trips/year/driver for auto experts), but both groups were almost the same as reported in the United Kingdom at 410 trips/year/driver (Department of Transport 2009). It could be that the number of trips in the US survey included all modes of transportation (private vehicle, public transit, walking, and others). Furthermore, the US survey included 36 categories of trip purposes (Hu and Reuscher Reference Hu and Reuscher2004), but only five categories of trip purposes were used in the present survey. For example, the trip purpose “Medical/Dental Service” was not available to subjects in this study but was included in US survey. Finally, the number of trips was estimated, and not obtained from a trip diary, which would have been more accurate.
3.2. What was the purpose of the trips and how far did subjects drive?
Each of the navigation systems and surveys used a different scheme for coding trip purpose and points of interest (POI). To ensure a sufficient number of responses for each POI/trip purpose category and to aid in consolidating the categories, POIs were classified using Garmin's scheme, which had the fewest number of categories. The investigators also included two more categories: friends' and relatives' houses, since they accounted for 15% and 4%, respectively, of the trips that subjects made.
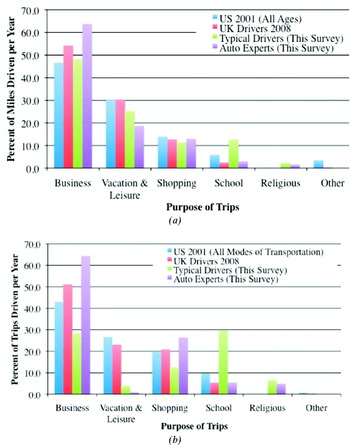
Figure 1(a) compares the distribution of miles driven by trip purposes from this survey with the UK (DOT 2009) and US (Hu and Seuscher Reference Hu and Reuscher2004) data. In the US study, the results were the percentage of the annual miles travelled by people, not just by drivers. The distribution of miles driven by trip purpose for typical drivers is similar to the distribution from the UK study, except for school trips. This is not surprising, since 57% of the typical drivers were students. However, the auto experts in this study travelled relatively more miles for business trips and relatively fewer miles for vacation and leisure trips than those reported in the US and UK studies, possibly because studies in the United States and United Kingdom included retired (age >65) and younger (age <16) subjects. Retired and young people are usually not engaged in business, and both groups have more time for vacation and leisure travel. Another possibility was that “vacation and leisure” are commonly thought of as having a longer duration, but subjects in this study did not count the one-day or two-day short trips to a recreation centre, a friend's house, etc., as “vacation and leisure”.
Comparison of (a) Percentage of miles driven per year and (b) Percentage of trips driven per year for both groups and other studies.

Comparing the absolute number of trips, auto experts (409 trips/year/driver) drove more trips than typical drivers (369 trips/year/driver), which was consistent with having driven more miles, and their trip purpose distributions were quite different (Figure 1b). Auto experts drove more trips for business and shopping, whereas driving to school was common for typical drivers. Again, it is not surprising that there were fewer business trips and more school trips for typical drivers, since most of the study subjects were students. There is a large difference (28% vs. 64%) in the percentage of business trips between typical drivers and auto experts, but there is not much difference in the miles driven (48% vs. 64%). This might suggest that the average distance driven for one business trip is longer for typical drivers than the distance driven by auto experts.
Further, typical drivers drove more hours on business trips (7 hours vs. 1 hour) and on vacation (22 hours vs. 5 hours), compared to auto experts. This could be because most of the typical drivers were students who typically have less money for vacation. Therefore, they would drive instead of flying to vacation destinations.
The patterns of the trip purposes of each group were different from the studies in the United States and United Kingdom (Figure 1(b)). These differences are probably related to differences in the populations surveyed.
3.3. How necessary was the navigation system for each trip?
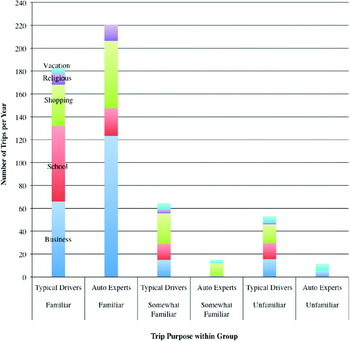
When subjects used their navigation systems while driving, 61% (183/299) of the trips for typical drivers and 89% (212/239) of the trips for auto experts reported that they were familiar with the desired destinations; 21% (63/299) of the trips for typical drivers and 7% (16/239) of the trips for auto experts reported that they were somewhat familiar with the desired destinations; and only 18% (53/299) of the trips for typical drivers and 5% (11/239) of the trips for auto experts reported that they were unfamiliar with the desired destinations (Figure 2). It is unknown why drivers used their navigation systems for previously known destinations.
Reported use of navigation assistance as a function of trip purposes.

For the familiar destinations, the common purposes were “School” (36%) and “Business” (36%) for typical drivers, and “Business” (58%) for auto experts. For the category of “somewhat familiar with the destinations,” the most common purpose was “Shopping” for both typical drivers (40%) and auto experts (69%). For the unfamiliar destinations, there were no significant differences in the purposes for “Business” (30%), “School” (26%), and “Shopping” (30%) for typical drivers. For auto experts, “Vacation” (55%) and “Business” (45%) were the most common purposes. When auto experts used navigation systems, they did not report any trips for “School” and “Religious” purposes, for neither somewhat familiar nor unfamiliar destinations. In general, the results indicated that subjects from both groups still used navigation systems even when they were familiar with the destinations.
3.4. How often were manual and speech interfaces reportedly used to enter destinations and how long did subjects estimate it took to enter them?
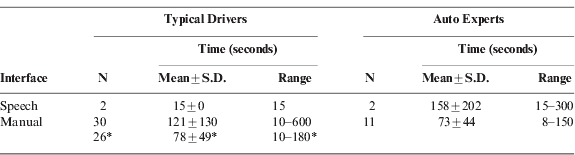
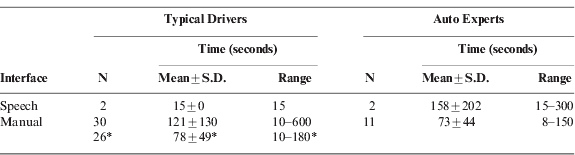
Only two of the thirty typical drivers (8%), and two of the eleven auto experts (18%) reported that they had used speech interfaces to enter destinations. The estimated mean time to complete a destination entry task using the speech interface was 15 s for typical drivers and 158 s for auto experts (Table 1). Note that only two in each group reported using speech and so the data are limited.
Reported mean time to complete a destination entry task using speech and manual inputs.
*: Without outlier
The estimated mean time to complete a destination entry task using the manual input was 121±130 s for typical drivers and 73±44 s for auto experts (Table 1). When the four outliers in the typical drivers were removed (an outlier is defined as any observation outside of the range: [Lower quartile−1·5 (quartile difference), Upper quartile+1·5 (quartile difference)], Tukey Reference Tukey1977), the estimated mean time to complete a destination entry task using the manual input was 78±49 s. There were no outliers among the auto experts. There was no statistically significant difference between the two groups (t(39)=−1·20, p=0·24, with outlier; t(35)=−0·34, p=0·74, without outlier) in the estimated mean time to complete a destination entry task using manual input.
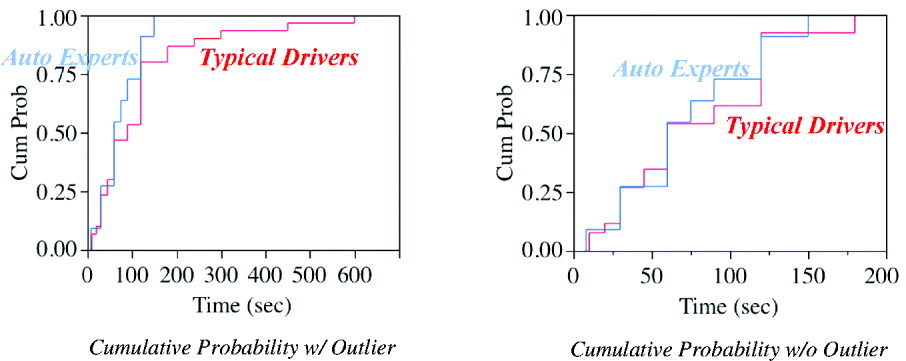
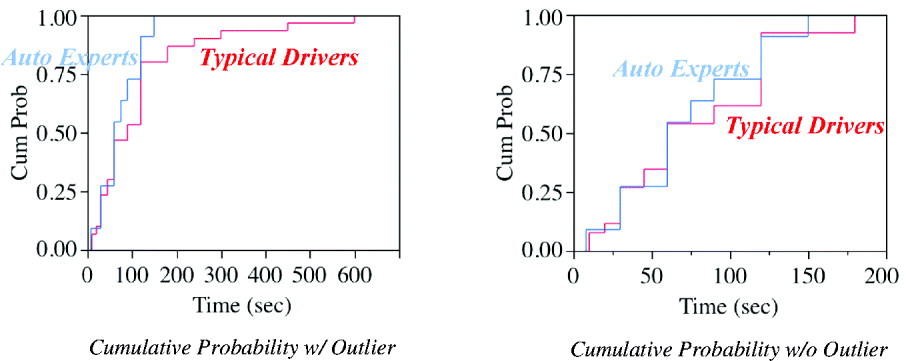
The estimated destination entry task time distributions among typical drivers using manual input were quite different with outliers (lognormal distribution) than without outliers (exponential distribution). The estimated task times were normally distributed for the auto experts. When the outliers were removed from the data for typical drivers, the cumulative probability distributions were similar for both groups (Figure 3).
Cumulative probability of time estimated to complete a destination entry task using manual input from both groups.
The estimated self-reported mean times to complete a destination entry task using the manual input for both groups were less than the measured times from other studies (Gärtner, König, and Wittig Reference Gärtner, König and Wittig2001; Tsimhoni, Smith, and Green Reference Tsimhoni, Smith and Green2004; Walls, Baron, and Green Reference Walls, Baron and Green2007). When the outliers were removed from the data, the reported mean time to manually complete a destination entry task was a few seconds longer than the mean time from the Manstetten et al. study (Reference Manstetten, Krautter, Grothkopp, Steffens and Geutner2001) (73·2 s). The ranges of the time to manually complete a destination entry task were almost the same to those reported by Walls, Baron, and Green (Reference Walls, Baron and Green2007) (24·7 s to 179 s).
3.5. How did the reported methods used to enter destinations vary with trip purposes?
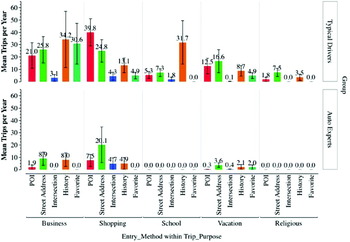
“History” (30%), “Street Address” (27%) and “POI” (26%) were the common methods reported by typical drivers to enter destinations for all purposes of trips. Auto experts reported that “Street Address” (48%) and “History” (24%) were common methods for destination entry for all purposes of trips. Figure 4 provides more detailed information on the method used by trip purpose. For business trips, the most popular method used by typical drivers was “History” and “Favourite,” which accounted for a total of 60%. When typical drivers went shopping, the “POI” method was used almost half of the time, whereas auto experts preferred the “Street Address” method (62%). When going to school, typical drivers overwhelmingly searched the destination by “History” (69%). No school trips were reported by auto experts. Comparing the methods used for destination entry tasks, “Intersection” was the method both groups were least likely to use. Since the reported number of trips for vacation and religious purposes were too small, no conclusions could be drawn from the methods used.
Reported frequency of destination entry method use by trip purpose for both groups.

3.6. When a speech entry error occurred, how did subjects report that they corrected it?
Fifty-seven percent of the time, typical drivers reported that they corrected a speech entry error by repeating exactly the same words, and thirty-seven percent of the time they used manual input to correct it (Table 2). On the other hand, sixty-three percent of the time auto experts corrected the error by entering the words manually. No subjects reported spelling the words out to correct an error. There are no empiric data to verify these claims, and there were only two subjects in each group that reported using this method.
Mean percentage (ranges) of error correction methods using speech.

3.7. What was the frequency of recent destinations that drivers actually visited using navigation systems?
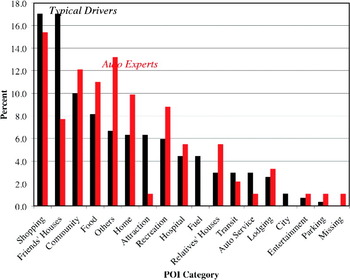
There were 270 records transcribed from typical drivers and 91 records from auto experts. All subjects in the typical drivers group and nine of the eleven (82%) subjects in the auto experts group had more than nine records on the “History” lists in their navigation devices, so the data shown were from a self-selected data set, using only the first nine records in each device. As shown in Figure 5, “Shopping” and “Friends' Houses” were the top two ranked destinations for typical drivers (17%). On the other hand, “Shopping,” “Community,” (which includes “School/University,” “Place of Worship,” Bank/ATM,” “Library”), “Food,” and “Others” were the top-ranked destinations for the auto experts. The high frequency for visiting “Friends' Houses” and “Relatives' Houses” is an important finding, because many destination entry studies use common entries, such as “POI” for restaurants or intersections for business offices to evaluate their navigation systems (Geutner et al. Reference Geutner, Steffens and Manstetten2002; Minker et al. Reference Minker, Haiber, Heisterkamp and Scheible2004; Weng et al. Reference Weng, Varges, Raghunathan, Ratiu, Pon-Barry, Lathrop, Zhang, Scheideck, Bratt, Xu, Purver, Mishra, Raya, Peters, Meng, Cavedon and Shriberg2006, Reference Weng, Yan, Feng and Ratiu2007). However, these data suggest the trials used for address entry task should include residential locations (friends' houses and relatives' houses), and furthermore, because these locations are for friends and family, they will be subject-specific.
Frequency of POI categories visited for both groups.

3.8. Which methods did drivers actually use to enter destinations?
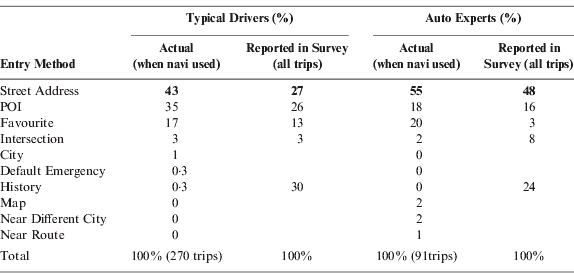
Table 3 compares reported methods with actual methods used by subjects to enter destinations. Keep in mind that destinations derived from the device history were only for trips in which destinations were inputted, while the method estimated from the survey was for all trips. The most frequently used method to search for a destination was by “Street Address” for both groups, 43% for typical drivers and 55% for auto experts. The actual result for “Street Address” conflicted somewhat with the result from the survey for the typical drivers. “History” was only used once (0·3%) based on information retrieved from their devices. However, searching for a destination from “History” was the most frequently used method (30%) reported by typical drivers. Similarly, auto experts did not use the “History” method at all based on data retrieved from their devices, but it accounted for 24% of total use reported by auto experts. The results from actual use also contradict the results from the survey for both groups. “Favourite” was cited as the second most preferred method used by auto experts, but there was a substantial difference with the survey results, 20% vs. 3%, respectively. One possible explanation for the difference is that the method recorded in the device history is for part of the trips in which destinations are recently entered, but the method estimated from the survey is for all trips.
Destination entry methods recorded from personal devices compared to survey results.
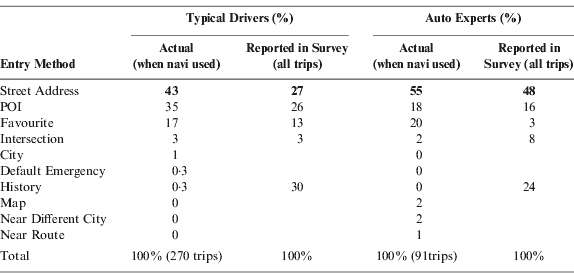
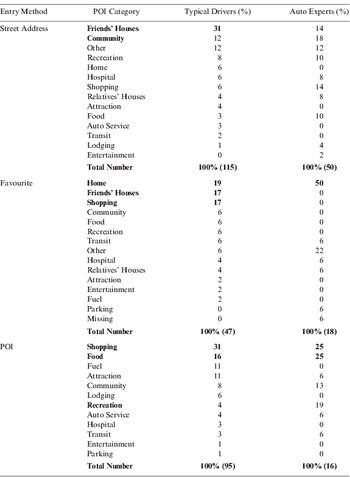
Table 4 shows how destination types were distributed among the top three destination entry methods (“Street Address,” “Favourite,” and “POI”) from subjects' devices. For typical drivers using the “Street Address” method, the most common destination was “Friends' Houses” (31% of street address entries). There was no significant POI destination difference for auto experts using the “Street Address” method. “Shopping” and “Food” were dominant destinations for both driver categories when using the “POI” entry method. Searching for “Recreation” (16%) was the third ranked destination when auto experts used the “POI” entry method. The most notable difference between driver categories was for destinations entered using the “Favourite” entry method: typical drivers used this method for “Home” (19%), “Friends' Houses” (17%), and “Shopping” (17%) with equal frequency, while auto experts used this method for “Home,” but not at all for “Friends' Houses” and “Shopping.” The relatively high frequency of visiting “Friends' Houses” or going “Home” as being destinations has not been identified previously in the literature. Since these residential locations are for social purposes, there may be an opportunity to aid drivers in selecting destinations by linking navigation systems to social networking sites, such as Facebook.
Frequency of POI categories by top three destination entry methods used.

3.9. What was the frequency distribution of point of interest (POI) categories that subjects saved in “Favourite” lists in their navigation systems?
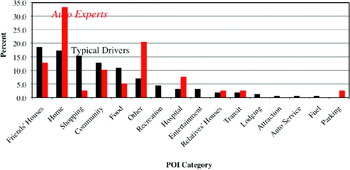
Overall, there were 156 (5·2 records per subject) records for typical drivers and 39 (3·5 records per subject) records for auto experts on the “Favourite” lists saved in their navigation devices. Thirty-seven percent (11/30) of the typical drivers and eighteen percent (2/11) of the auto experts had more than nine records on their “Favourite” lists. Figure 6 shows the frequency of POI categories for these records. “Friends' Houses,” “Home,” “Shopping,” and “Community” were the four top-ranked categories on the “Favourite” lists of typical drivers. “Home” and “Other” were the most frequent categories on the “Favourite” lists of auto experts. These results confirmed that “Home” was the most common category for subjects when using their “Favourite” lists as the method to enter a destination.
Frequency of POI categories that subjects saved as favourite in their navigation devices.

4. CONCLUSIONS
To design and evaluate in-vehicle navigation systems and travel information systems, we need to know where real drivers typically go, a topic examined in this paper. In fact, the authors do not know of any other current data on destination entry frequency or methods for contemporary navigation systems. The mean annual distance driven for subjects from both groups in this study were similar to the US population, although students were overrepresented in the typical driver group. The comparison of the typical drivers to the general population likely means that there is a shift in the distribution of trip purposes from business to education, and given the comparatively lower income levels, vacation travel by car was more likely. Additional data would be needed to evaluate other major subsets of the US population, such as retirees and others who are not auto experts.
How many trips occurred per year? The total number of trips per person for all purposes made by both groups in the current study was only about one-third of the total trips of the US population, 369 trips for typical drivers and 409 trips for auto experts. The auto experts drove more trips for business and shopping, whereas trips for school, business, and shopping were common for typical drivers. The typical drivers drove more hours on business trips (7 hours vs. 1 hour) and on vacation (22 hours vs. 5 hours), compared to auto experts.
The distribution of miles driven by trip purpose for typical drivers is similar to the distribution from the UK study, except for school trips. The auto experts in this study drive more miles for business trips and relatively fewer miles for vacation and leisure trips than those reported in the US and UK studies.
How necessary was the navigation system for each trip? Subjects commonly used navigation systems even when they were probably capable of reaching their destination without a navigation system (61% for typical drivers and 89% for auto experts). This was not expected. Why would a driver use a navigation system, intended to guide drivers to unfamiliar or unknown destinations, for familiar destinations? Answering this question could provide some insights as to how to better design navigation systems for the most common situation – guidance to familiar destinations.
How often were various methods used, and how did the method vary with the trip purposes? “History” (30%), “Street Address” (27%) and “POI” (26%) were the common methods to enter destinations reported by typical drivers. Auto experts reported “Street Address” (48%) and “History” (24%) as common methods for destination entry. Since these methods were the most commonly used, they should be the easiest to use, and interface design should focus on them. “History”, the most common reported method, has received little attention.
Visiting “Friends' Houses” was the most common (31%) reason for typical drivers to use the “Street Address” methods for destination entry. From the records in subjects' navigation systems, the most frequently used method for destination entry was “Street Address” for both groups (43% of typical drivers; 55% of auto experts). However, the results from recorded data stored in the navigation devices differed from the results reported by subjects from the survey.
Visiting “Friends' Houses” (19%), “Home” (17%), “Shopping” (15%), and “Community” (13%) were the four top-ranked POI categories on the “Favourite” lists for typical drivers. “Home” (33%) was the most frequent POI category on the “Favourite” lists for auto experts. This also confirmed that “Home” was the most common POI category for subjects using the “Favourite” method for destination entry.
The high frequency of visiting “Friends' Houses” as a destination hints at the idea of linking social networking sites to navigation databases with the intent of reducing the effort to select a friend's house as a destination, because the information would be more readily available. However, how this could be implemented will require consideration of a number of issues, including security concerns. Some drivers might be reluctant to enter their home address into a navigation system, because if their vehicle is stolen, the thief can readily determine where they live. This would be particularly problematic if house keys are left in their vehicle. Depending on how access to the navigation system is implemented, thieves could know who the vehicle owner's friends are as well.
The frequency data provide not only useful guidance for design, but data for assessment as well. For example, when checking compliance with AAM and SAE guidelines, the retrieval of destinations from guidance history and favourites lists should be assessed, and they need to be populated with subject specific data including their own home, local shopping, and addresses for their friends. In addition, these data emphasize the importance of POI lists, from which information is notoriously difficult to retrieve because of the uncertainty about which category contains the information desired by each driver.
How often were speech and manual interfaces reported used, and how were speech entry errors corrected? One of the most salient results of the current study is that the use of a speech interface for destination entry was not common. Based on very limited data, the estimated mean time to complete a destination entry task using the speech method was 15 s for typical drivers and 158 s for auto experts. The estimated mean time to complete a destination entry task using the manual method was 78 s for typical drivers and 73 s for auto experts. When an error occurred while entering a destination using speech, typical drivers reported that 57% of the time they corrected it by repeating exactly the same words, and 37% used manual input to correct it. On the other hand, 63% percent of the time auto experts correct the error by entering in the words manually. Keep in mind that the times reported are estimated, not measured time. Nonetheless, these data do not reflect well on the design of interfaces to minimize driver distraction, with task time in excess of one minute. Furthermore, the low use of speech interfaces is also a negative reflection of the state-of-the-art of in-vehicle speech interfaces.
Good design of a user interface, be it for a navigation system in a vehicle, a travel information system on a desktop computer, or a system for any other purposes, requires data on who will use the system and the tasks to be accomplished by those users. In this case, the critical information is where people want to go and how they enter that information. The present investigation provides important data that addresses these questions. As with any investigation, this one not only answers the questions posed, but raises new ones as well: Where and why are there differences between actual and reported travel data? Why are drivers using navigation systems to go to familiar destinations? What additional information will make the destination entry task more useful? How might information on social networking sites be integrated into navigation systems to aid in destination selection? Why do drivers not use speech interfaces? How can these interfaces be redesigned to facilitate ease-of-use, especially for commonly used selection methods? These are questions for future work.
ACKNOWLEDGEMENT
The authors would like to thank Mr. Toshiro Muramatsu of Nissan for coordinating data collection at the Nissan Technical Center North America, Inc.