1. Introduction
Detonation is one kind of extreme combustion whose speed reaches as high as thousands of metres per second (Fickett Reference Fickett1985; Lee Reference Lee2008). As with shock waves, there are two kinds of detonation waves according to the surface angle relative to the inflow direction: normal detonation and oblique detonation. Normal detonations have been studied extensively, but research is still needed on oblique detonations, particularly their potential application to ram accelerators or oblique detonation engines (ODEs) (Kailasanath Reference Kailasanath2000; Higgins Reference Higgins2006). As a new type of hypersonic ramjet engine, the ODE development needs fundamental knowledge of oblique detonation waves (ODWs) as a scientific foundation. Pioneering studies in the 1990s (Li, Kailasanath & Oran Reference Li, Kailasanath and Oran1994; Viguier et al. Reference Viguier, Figueira da Silva, Desbordes and Deshaies1996) demonstrated that a wedge-induced ODW is initiated by the transition from an oblique shock wave (known as OSW), inspiring a number of successive works on the structures of initiation regions, such as those by Figueira da Silva & Deshaies (Reference Figueira da Silva and Deshaies2000), Sislian et al. (Reference Sislian, Dudebout, Schirmer and Schumacher2001), Fusina, Sislian & Parent (Reference Fusina, Sislian and Parent2005) and Teng, Ng & Jiang (Reference Teng, Ng and Jiang2017). Additionally, the ODW surface was found to be unstable (Papalexandris Reference Papalexandris2000; Choi et al. Reference Choi, Kim, Jeung, Ma and Yang2007), and later works investigated the mechanism of instability and the evolution of fine-scale structures (Teng, Jiang & Ng Reference Teng, Jiang and Ng2014; Zhang et al. Reference Zhang, Zhou, Gong, Ng and Teng2018).
Using the ODW in propulsion systems such as an ODE requires consideration of several other factors. In hypersonic engines, it is impossible to keep ideal inflow conditions such as well-premixed fuel/air mixtures and steady inflow. Sislian et al. (Reference Sislian, Dudebout, Schumacher, Islam and Redford2000) conducted an early study of mixing inhomogeneity in two types of ramjets and clearly observed deflagration distortion. Recent studies (Fang et al. Reference Fang, Hu, Teng, Jiang and Ng2017; Iwata, Nakaya & Tsue Reference Iwata, Nakaya and Tsue2017) have found that the inflow inhomogeneity may distort the initiation region, generating a ‘V-shaped’ flame and changing the surface positions. Meanwhile, abrupt variations of inflow angle have been simulated to study the effects of unsteady inflow (Liu et al. Reference Liu, Wang, Xiao, Yan and Wang2018), revealing the hysteresis of ODW structures. More recently, simulation of an ODW in a generalized unsteady inflow (Yang, Ng & Teng Reference Yang, Ng and Teng2019a) modelled as a continuous harmonic disturbance has uncovered interesting wave dynamics such as overshooting of oscillation amplitude and suppression of triple-point generation.
Besides the effects of non-ideal inflow, ODW interaction with complicated geometry is also critical in developing a practical engine owing to its limited scale confinement. Most studies, such as Fusina et al. (Reference Fusina, Sislian and Parent2005), Teng et al. (Reference Teng, Ng and Jiang2017), Papalexandris (Reference Papalexandris2000) and Choi et al. (Reference Choi, Kim, Jeung, Ma and Yang2007), have used a semi-infinite wedge without considering the expansion wave induced by a truncated wedge or nozzle. Several recent studies (Liu et al. Reference Liu, Han, Yao and Wang2016; Bhattrai & Tang Reference Bhattrai and Tang2017; Fang, Hu & Teng Reference Fang, Hu and Teng2018) have considered a wedge with finite length, revealing more involved ODW structures. However, those studies have only addressed the post-shock expansion wave from a wedge or cowl rather than the ODW interaction with the upper wall of the engine tunnel. Therefore, the objective of this study is to investigate ODW interaction with an upper expansion corner which, presumably, introduces similar preshock Prandtl–Meyer expansion fan into the flow. On the contrary, present numerical results show that a new wave configuration forms, featuring a post-turning recirculation zone coupled with a gaseous wedge. To ascertain the formation mechanism, the wave configurations are simulated and analysed with respect to different geometrical and chemical parameters. Furthermore, structural features related to unstable surfaces are observed and analysed that lead to two destabilizing mechanisms of ODW structures.
2. Method
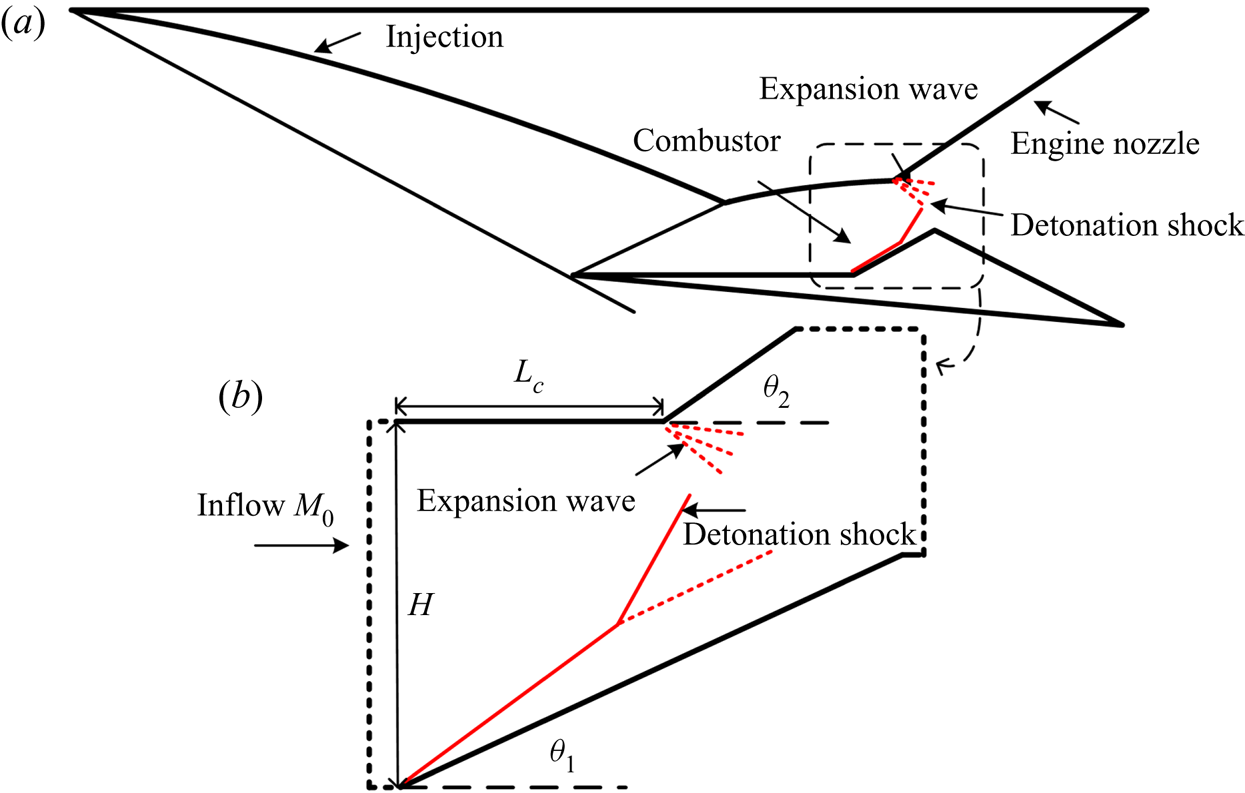
Figure 1 shows the schematic of an ODE and the computational settings. The hypersonic propulsion method for the ODE, which is shown in figure 1(a), is based on oblique detonation in the combustor and subsequent flow acceleration using the nozzle. A deflected top wall physical configuration is used to model the ODE combustion region of, and expansional acceleration by, the upper tunnel wall. Intuitively, as shown in figure 1(b), one may presume two interacting waves in the computational domain: an ODW induced by a wedge and a Prandtl–Meyer expansion fan in the flow domain ahead of the ODW derived from the turning point in the upper wall. However, as revealed later from the present investigation, a new flow structure could indeed arise from the wedge-induced ODW interaction with the upper corner deflection. In this study,  $H$ is the entrance inflow height,
 $L_{c}$ denotes the length of the upper wall from the wedge tip to the expansion corner, and
 $\theta _1$ and
 $\theta _2$ represent the angles of the wedge and the deflected upper wall, respectively.
Schematic of ODE (a) and computational domain with presumed features (b).

The analysis is based on the reactive Euler equations following previous numerical works (Choi et al. Reference Choi, Kim, Jeung, Ma and Yang2007; Yang et al. Reference Yang, Teng, Ng and Jiang2019b). Two additional reaction variables, the induction reaction index  $\xi$ and heat release reaction index
 $\lambda$, are introduced for the two-step model to mimic the characteristics of chain-branching kinetics (Ng et al. Reference Ng, Radulescu, Higgins, Nikiforakis and Lee2005). The transport equations of these new variables are
 \begin{align} \frac{\partial (\rho \xi)}{\partial t}+\frac{\partial (\rho u \xi)}{\partial x}+\frac{\partial (\rho v \xi)}{\partial y}=H(1-\xi)\rho k_I \exp \left[E_I \left (\frac{1}{T_S}-\frac{1}{T} \right) \right], \end{align}
 \begin{align} \frac{\partial (\rho \lambda)}{\partial t}+\frac{\partial (\rho u \lambda)}{\partial x}+\frac{\partial (\rho v \lambda)}{\partial y}=[1-H(1-\xi)]\rho (1-\lambda)k_R\exp \left[-\frac{E_R}{T}\right], \end{align}
where  $E_R$ is the activation energy of heat release,
 $E_I$ is the activation energy of induction, and the Heaviside step function
 $H$ is given by
 \begin{equation} H(1-\xi) = \begin{cases} 1, & \xi \le 1, \\ 0, & \xi > 1. \end{cases} \end{equation}
The advection upstream splitting method (known as AUSMPW+) (Kim, Kim & Rho Reference Kim, Kim and Rho2001) and a third-order Runge–Kutta algorithm are used to approximate numerically the solutions of the governing equations. The flow conditions are normalized with the free stream state as follows:
 \begin{equation} p=\frac{\tilde{p}}{p_0},\quad \rho=\frac{\tilde{\rho}}{\rho_0},\quad T=\frac{\tilde{T}}{T_0},\quad u=\frac{\tilde{u}}{\sqrt{RT_0}},\quad v=\frac{\tilde{v}}{\sqrt{RT_0}}, \end{equation}
where  $p$,
 $\rho$,
 $T$,
 $u$,
 $v$ are the pressure, density, temperature,
 $x$-velocity and
 $y$-velocity, respectively. The main parameters are set to
 $Q = 25$,
 $\gamma = 1.2$,
 $E_I = 4.0 T_s$,
 $E_R = 1.0 T_s$, where
 $T_s$ is the post-shock temperature of the Chapman–Jouguet detonation and
 $Q$ is the non-dimensionalized specific total energy. Two kinetic parameters,
 $k_I$ and
 $k_R$, are necessary to complete the model:
 $k_R$ is fixed to 1.0, while
 $k_I = -u_{vn}$, where
 $u_{vn}$ is the particle velocity behind the shock front in the shock-fixed frame for the corresponding Chapman–Jouguet detonation. The induction length of the Chapman–Jouguet detonation is fixed to unity. These parameters do not correspond readily to any detailed reactants, but rather a generic model with modest heat release and activation energy.
In this study,  $M_0$ is set to the values 6 and 7, which generate abrupt and smooth transitions for the ODW initiation, respectively. All cases achieve steady results after sufficient computing time unless otherwise stated. The left entrance starts at the position
 $x = -5$, and the wedge tip starts at
 $x = 0$ with a fixed wedge angle of
 $\theta _1 = 25^\circ$. The entrance inflow height
 $H$ is set to 140 by default, and two other values (100 and 180) are also tested. The wave configurations are studied by varying three parameters, two geometrical and one chemical:
 $L_{c}$,
 $\theta _2$ and
 $E_R$. These parameters are varied for both
 $M_0$ values. In the simulation, the whole flow field is initialized with the free stream inflow values, and the velocity components are calculated according to the inflow
 $M_0$. The left entrance is modelled as an inflow boundary with the condition that the parameters are constant owing to the supersonic flow. Outflow conditions extrapolated from the interior are implemented on the right exit and the upper boundary behind the deflected upper wall, as shown by the dashed lines in figure 1(b). A slip solid boundary condition is implemented on the low wedge surface and upper wall.
3. Results and discussion
3.1. Basic structure and resolution tests
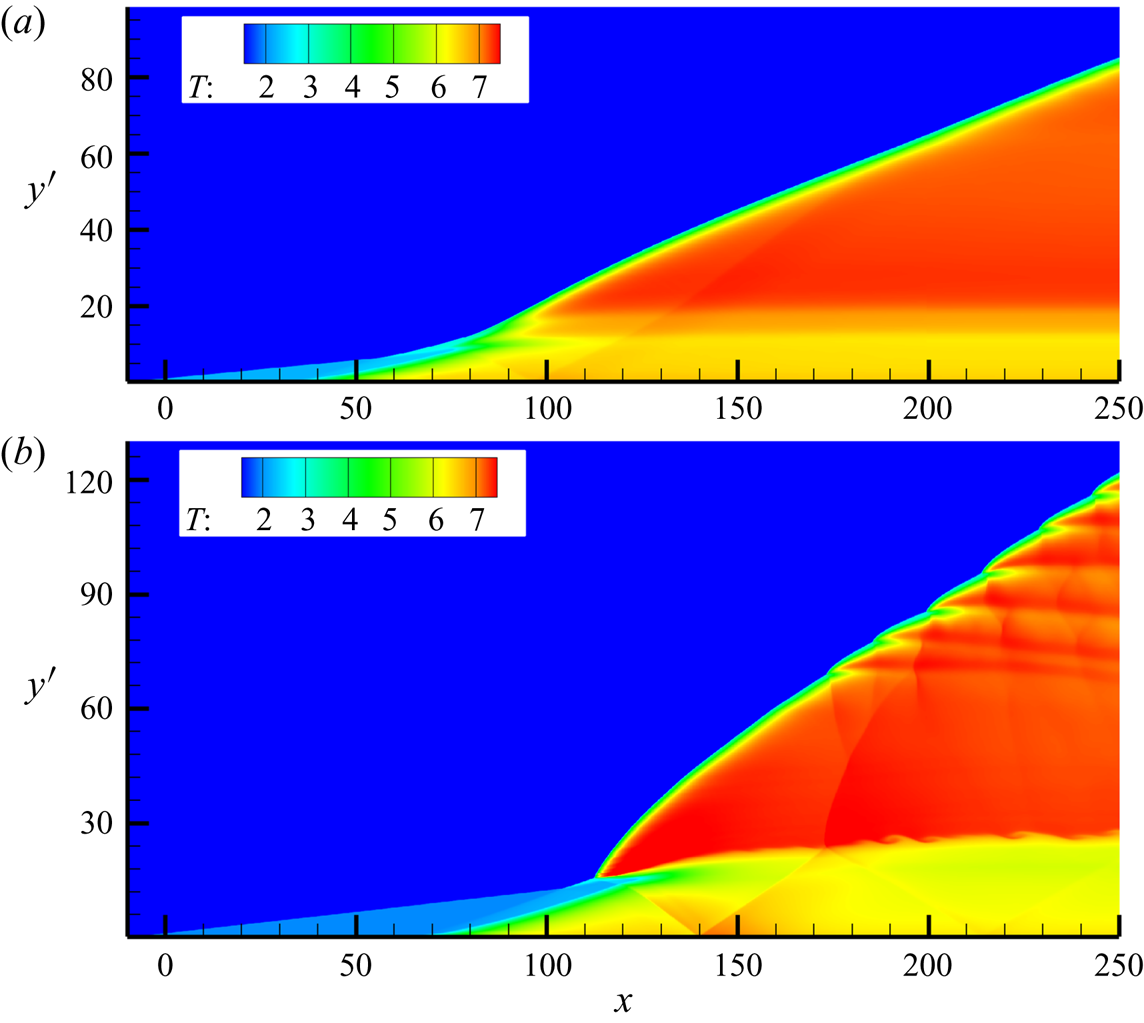
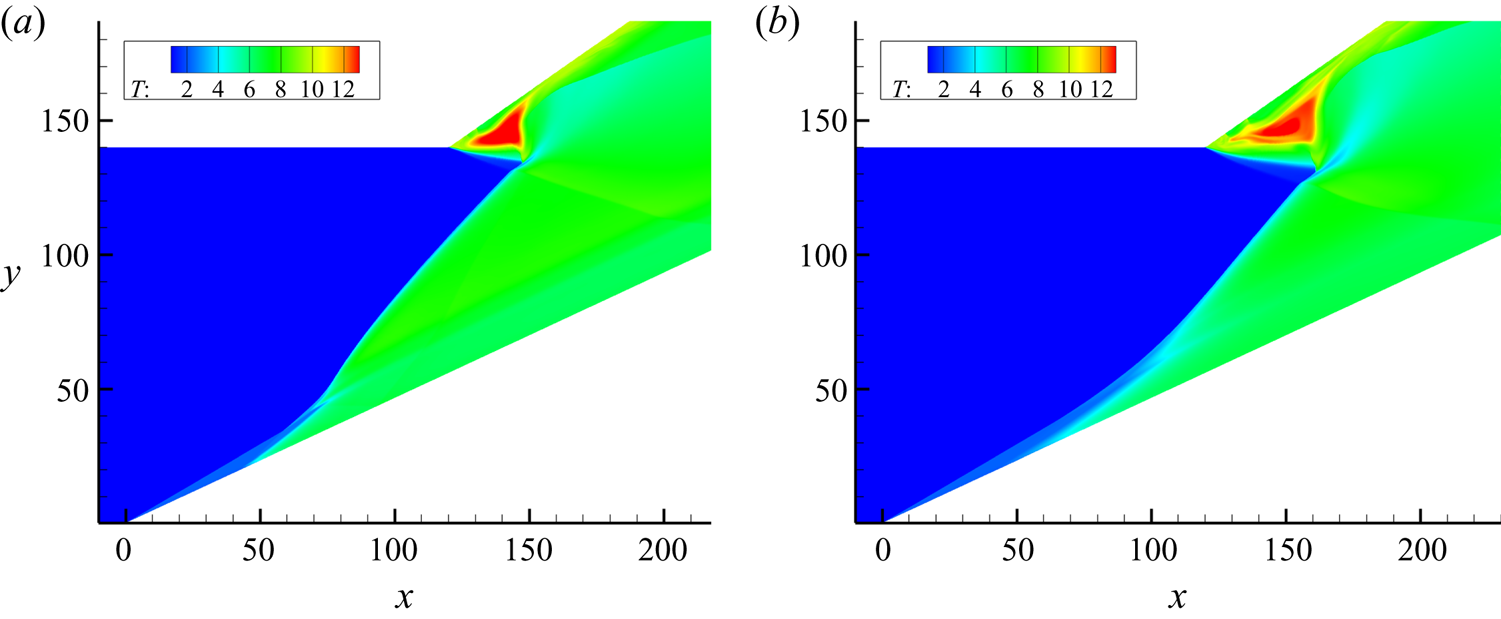
First, two basic ODW structures were simulated, as shown in figure 2. The deflected upper wall was not considered, so these structures are those reported by Yang et al. (Reference Yang, Teng, Jiang and Ng2018). The inflow reflects obliquely on the wedge, i.e. the computational lower boundary, and  $y'$ denotes the distance from the wedge. We chose
 $M_0$ carefully so the two structures would have different transition types. The transition is smooth for
 $M_0 = 7$ and abrupt for
 $M_0 = 6$. The dependence of transition position and type on
 $M_0$ is associated with several factors such as the induction zone temperature, which have been discussed by Teng et al. (Reference Teng, Ng and Jiang2017). It should be noted that the surface of the structure in figure 2(b) becomes unstable downstream, exhibiting a few triple points with associated transverse waves. In contrast, the ODW surface in figure 2(a) remains smooth in the whole computational domain considered, without any observed triple points. The ODW at low
 $M_0$ is easily destabilized owing to the low overdrive, as found in several studies such as Choi et al. (Reference Choi, Kim, Jeung, Ma and Yang2007). We will demonstrate that this difference significantly impacts the wave interaction.
Temperature fields of basic ODWs in the case of  $M_0 = 7$ (a) and 6 (b).

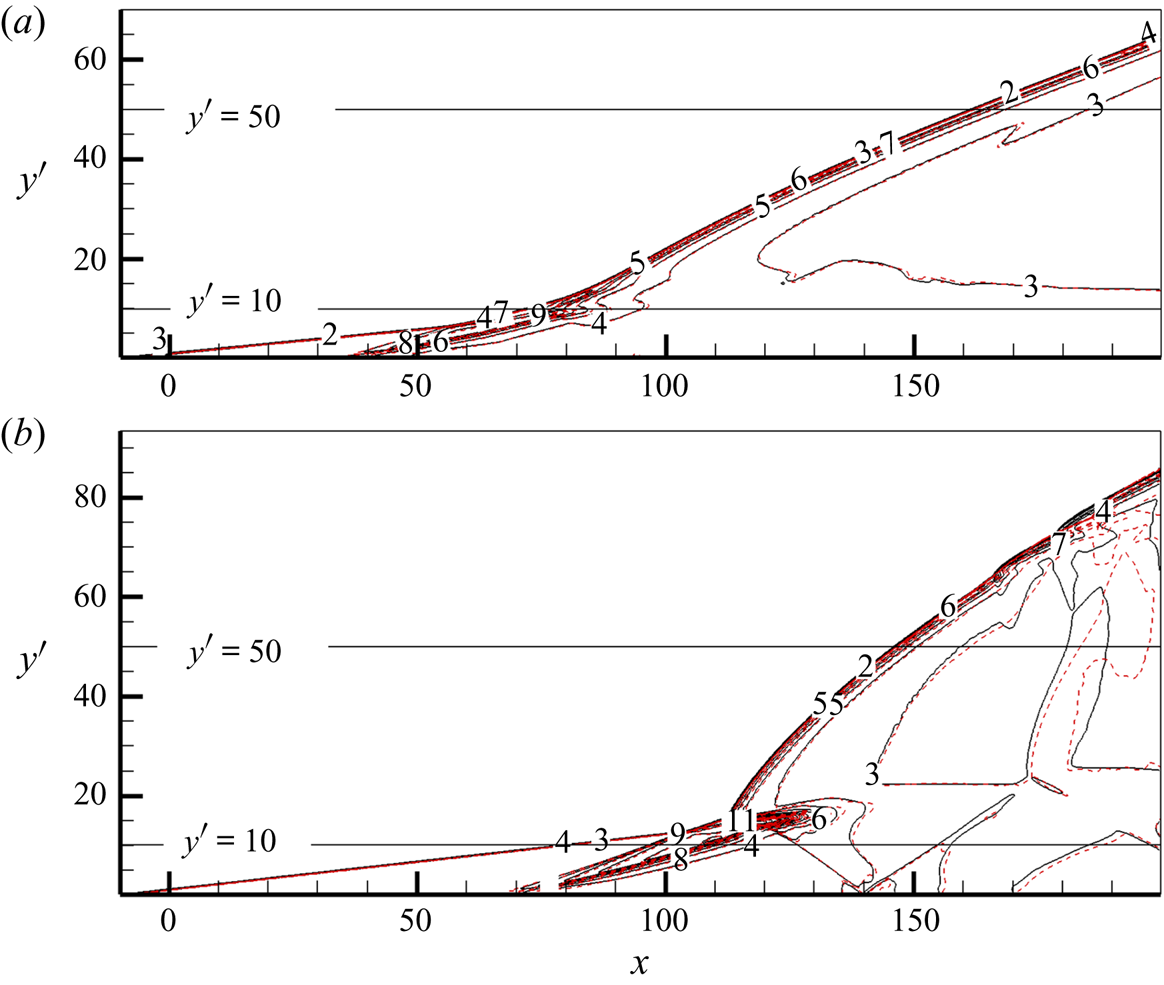
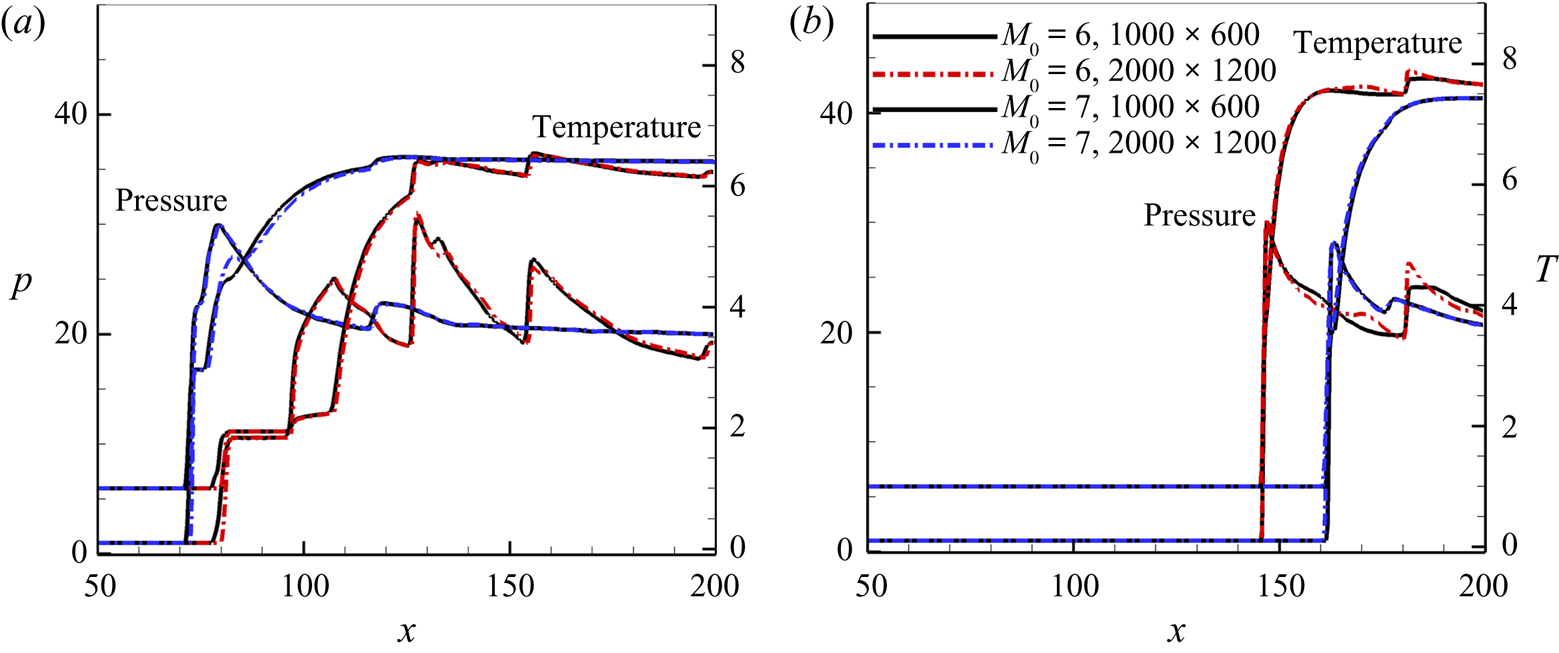
A resolution study on the size scale was performed, as shown in figures 3 and 4. The results of figure 2 were computed with a square grid length of 0.2. The flow fields are identical and show no obvious differences when the grid length is decreased to 0.1, i.e. the grid number per length is doubled, as shown in figure 3. To distinguish the effects of grid resolution, we quantitatively compare the temperature and pressure along different lines parallel to the  $x$-axis in figure 4. The black solid lines show the results for the grid length scale
 $dx = 0.2$, and the dotted lines show those for
 $dx = 0.1$. The solid and dotted curves nearly overlap with each other, so the difference is negligible and the overall ODW dynamics should not be affected. Further simulations with
 $dx = 0.05$ were also conducted, generating almost the same flow fields. Previous studies (Papalexandris Reference Papalexandris2000; Teng et al. Reference Teng, Jiang and Ng2014) have found that the required grid resolution in ODW simulations is not as high as in normal detonations, probably because of the unique flow characteristics of oblique detonations. Moreover, this study used relatively low
 $Q$,
 $E_I$ and
 $E_R$ values, significantly decreasing the difficulty of resolving the detonation front. The length scale
 $dx = 0.2$ was used in the later simulations, and the important results were verified by refining the grids.
Resolution test for the density of basic ODWs in the case of  $M_0 = 7$ (a) and 6 (b) (black solid curve, grid
 $1000\times 600$; red dashed curve, grid
 $2000\times 1200$).

Temperature and pressure based on different grid sizes along the wedge-parallel lines of  $y = 10$ (a) and 50 (b).

3.2. Wave configuration produced by the ODW upper deflected wall interaction
The two basic structures are simulated by considering the upper wall and adjusting  $L_{c}$, i.e. the length of the upper wall starting from the wedge tip
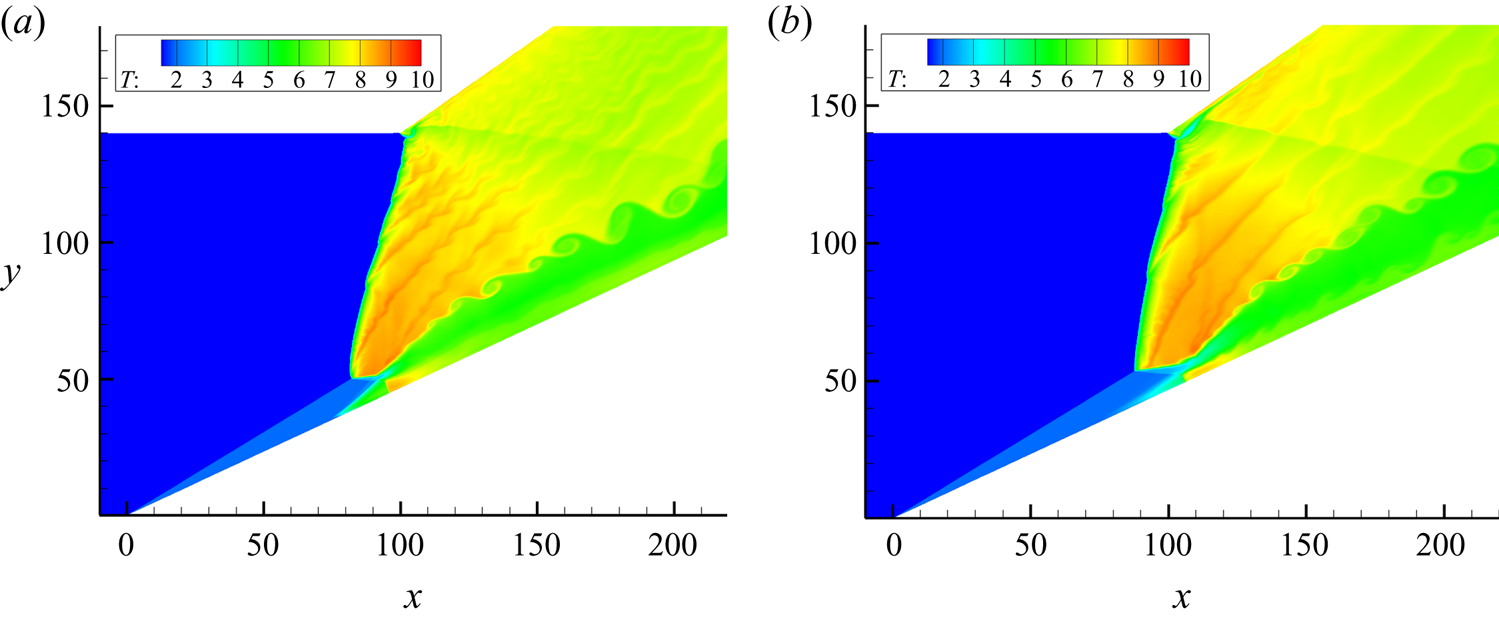
 $x = 0$, with an interval of 5. Figure 5 shows typical structures corresponding to
 $M_0 = 7$,
 $L_{c} = 120$ and
 $M_0 = 6$,
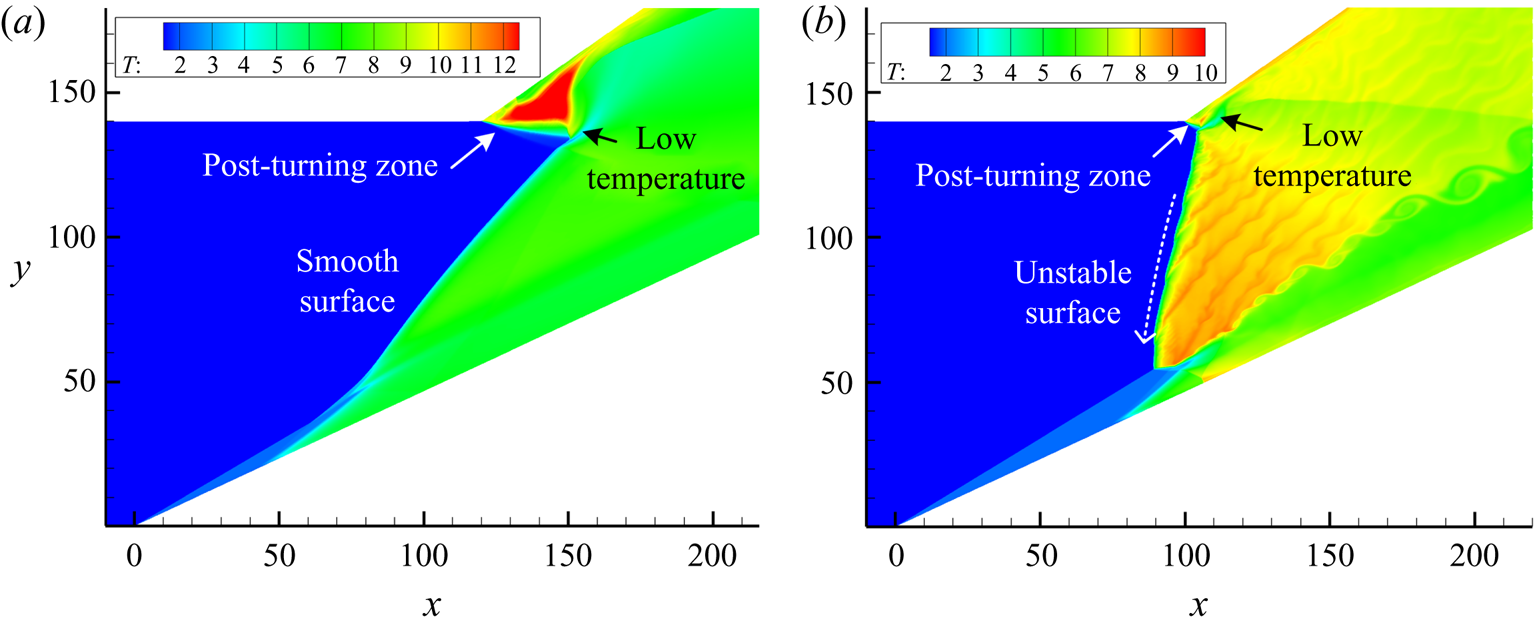
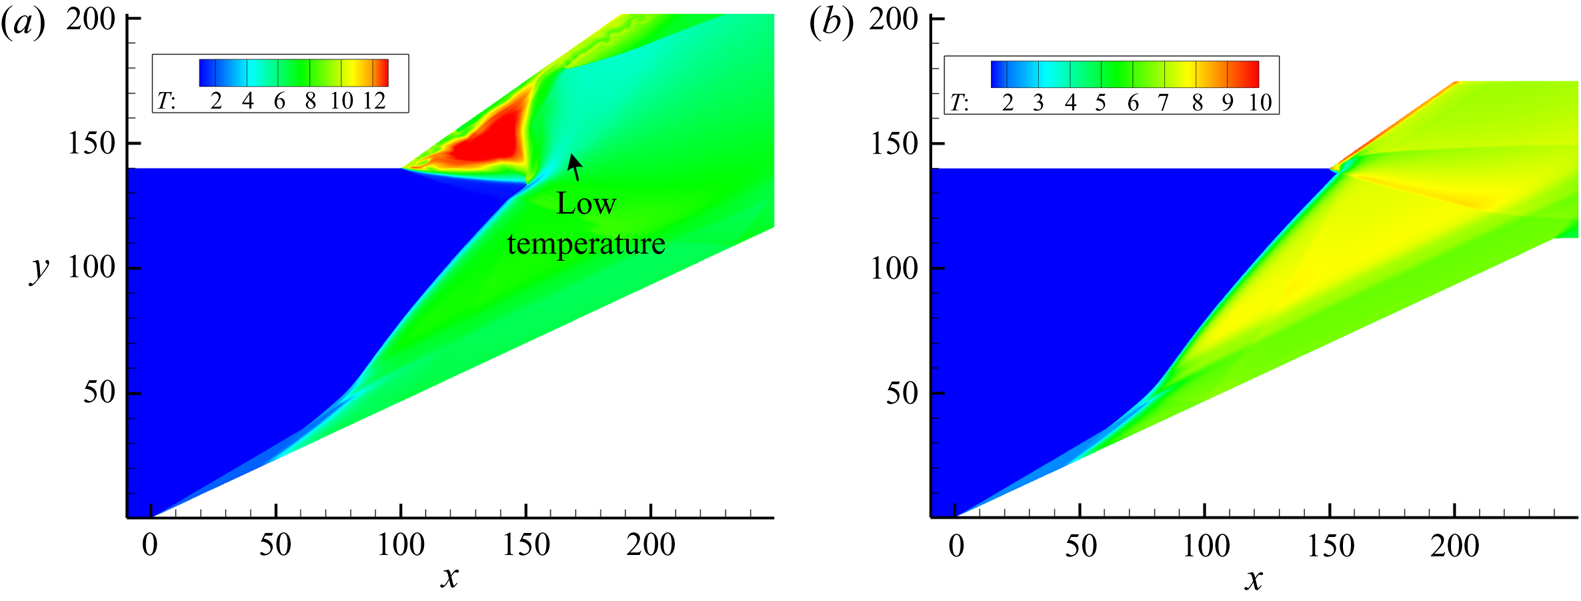
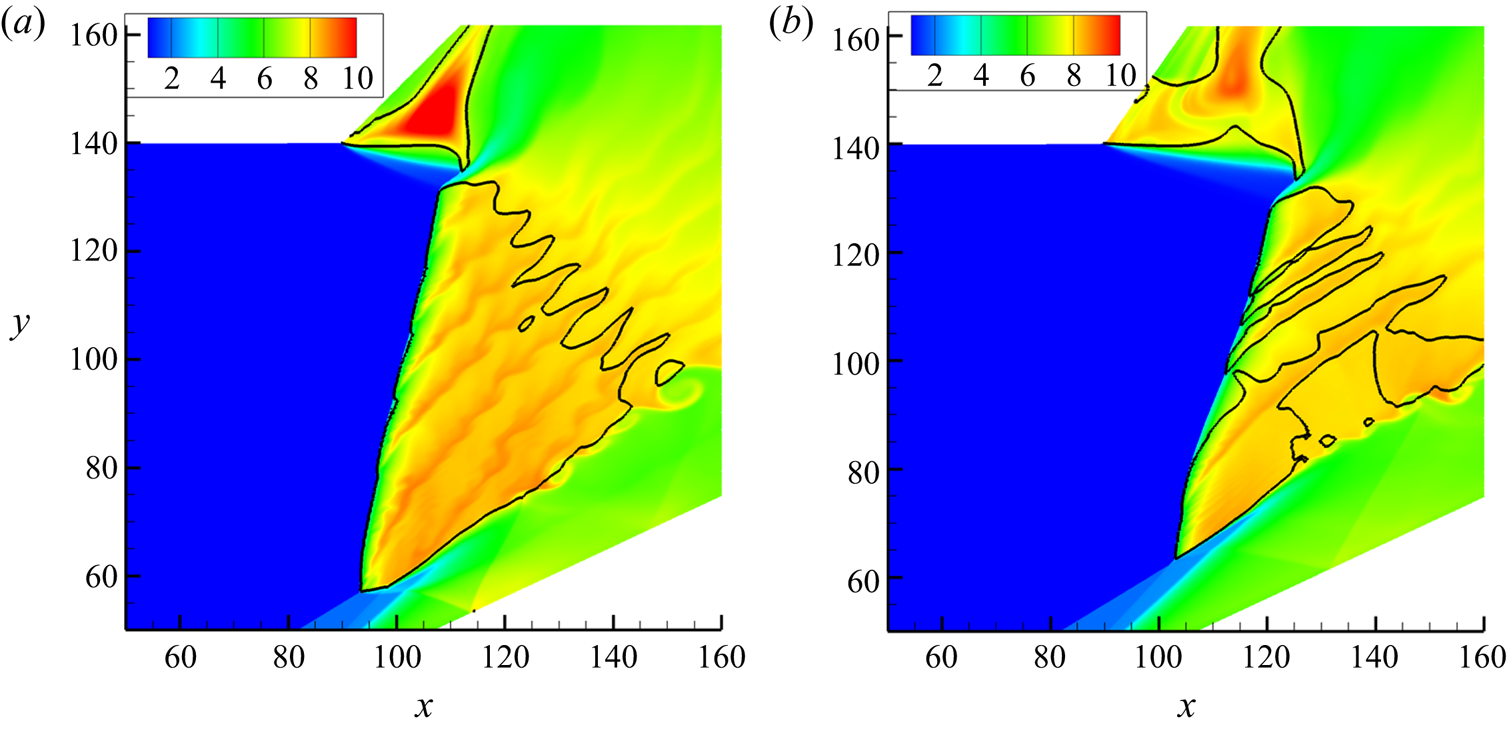
 $L_{c} = 100$. We observe that the interaction of an ODW with an upper turning corner results in a complicated wave configuration. A post-turning zone featuring a high-temperature triangle appears in each frame and extends downstream along the deflected upper confinement. The area of the post-turning zone is large in figure 5(a) and small in figure 5(b). Near the post-turning zone, there is a transition region downstream connecting with the ODW produced, and the temperature is locally low. The post-turning zones also affect the ODW surface, which remains smooth in figure 5(a) while becoming unstable in figure 5(b). For the unstable surface, transverse waves arise and lead to transverse waves extending downstream. However, the general wave configuration stays the same despite the different surface stabilities.
Temperature fields for (a)  $M_0 = 7$,
 $L_{c} = 120$; (b)
 $M_0 = 6$,
 $L_{c} = 100$. The dashed arrow in (b) denotes the motion direction of the transverse waves.

The unstable surface in figure 5(b) is interesting because the surface near the initiation region is still smooth for the original ODW in figure 2(b). By examining the surfaces at different instants, we find that the transverse waves travel upstream, or from top to bottom towards the wedge, as denoted by the white dashed arrow. Thus, the origin of these fine structures is the disturbance predominantly from the recirculation zone. These upstream-travelling transverse waves are different from those in previous studies such as Choi et al. (Reference Choi, Kim, Jeung, Ma and Yang2007). The left-running transverse waves that formed in our previous study (Teng et al. Reference Teng, Ng, Li, Luo and Jiang2015) still convected downstream in the laboratory coordinate, but the left-running transverse waves here are the first to be observed also travelling upstream in the laboratory coordinate. Previously, the origin of transverse waves was attributed to the random disturbance of the inflow, so the instability of this surface seems due to a different mechanism. Yang et al. (Reference Yang, Teng, Ng and Jiang2019b) found the infinitesimal disturbance from the initiation zone to be the origin of transverse waves in some cases, which is similar to this case.
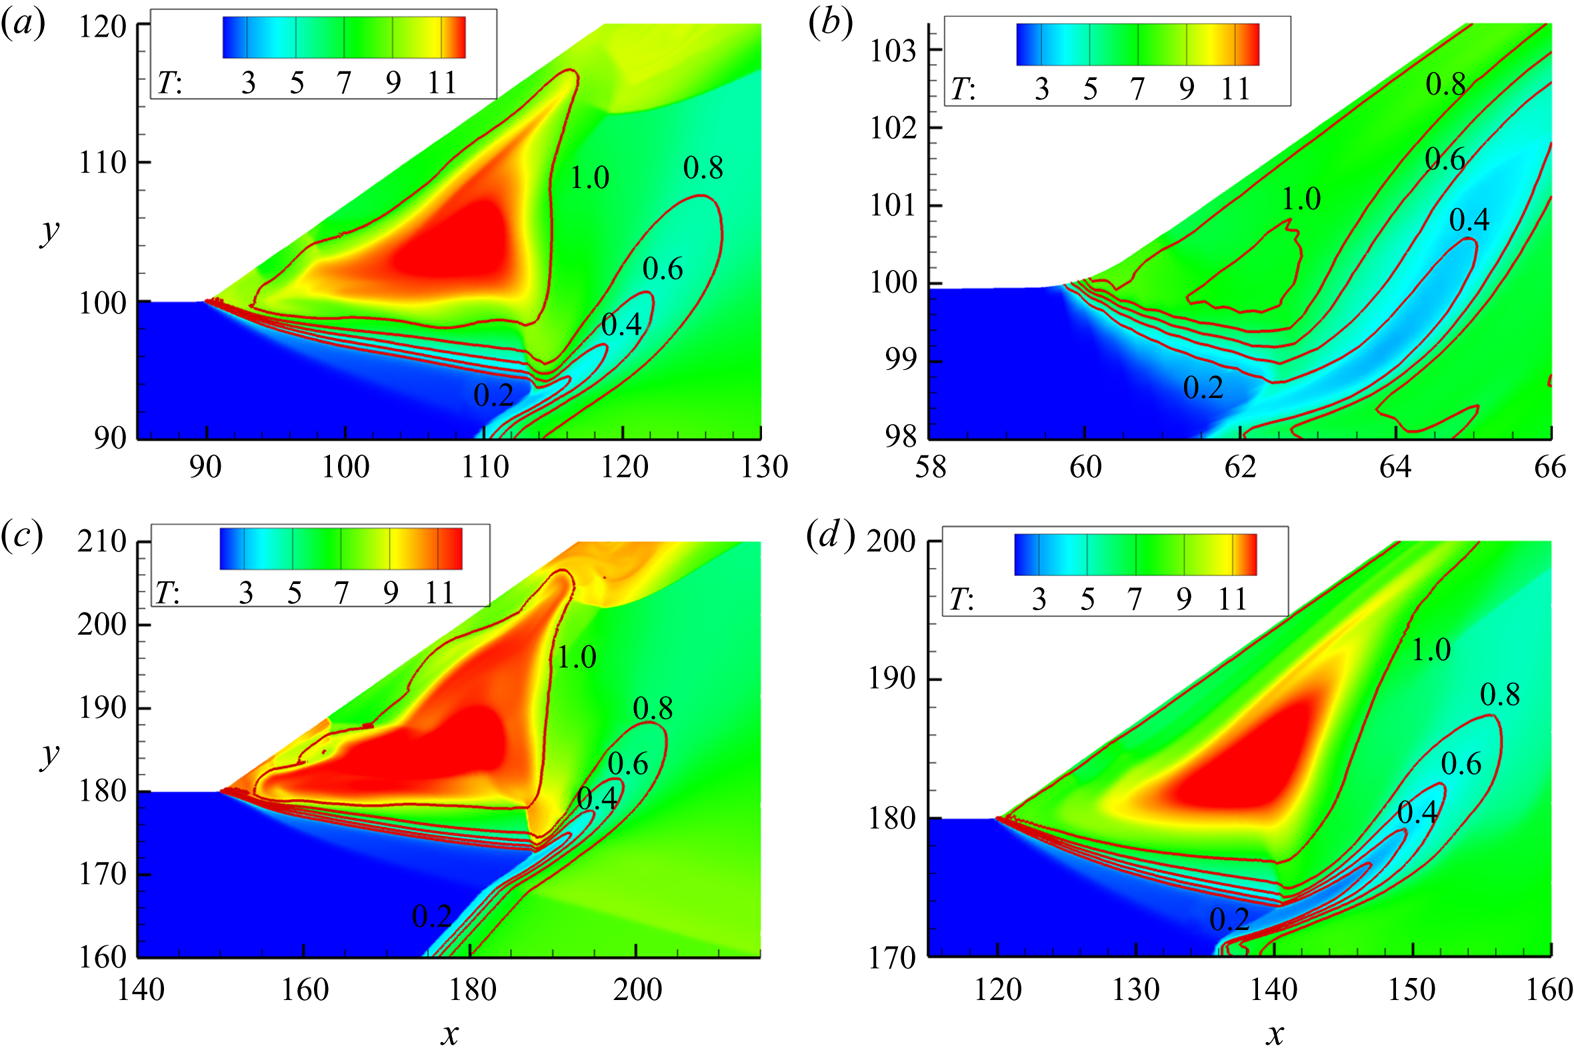
Since the temperature of a supersonic flow decreases after encountering an expansion wave, the high temperature of the post-turning zone suggests that the wave configurations have evolved, probably leading to a structure without the expansion fan. To verify that this type of wave configuration is universal, the entrance height  $H$ was varied to be either 100 or 180, and the results are shown in figure 6. The reaction index contours are also plotted to identify the heat release zone. Similar structures are observed clearly, indicating a post-turning zone close to a low-temperature transition region. The low-temperature region is overlapped by a spread contour of the reaction index, suggesting a slow heat release there. Surprisingly, the contours of the reaction index show that the heat release does not occur inside the high-temperature zone, suggesting the high temperature is due to the wave interaction rather than combustion. Hence, there is a complicated coupling between flow and combustion in this wave configuration beyond the presumed interaction of an expansion wave and an ODW.
Local temperature fields for (a)  $M_0 = 7$,
 $H = 100$; (b)
 $M_0 \!=\! 6$,
 $H \!=\! 100$; (c)
 $M_0 \!=\! 7$,
 $H = 180$; and (d)
 $M_0 = 6$,
 $H = 180$. The red curve represents
 $\lambda$ varying from 0.2 to 1.0.

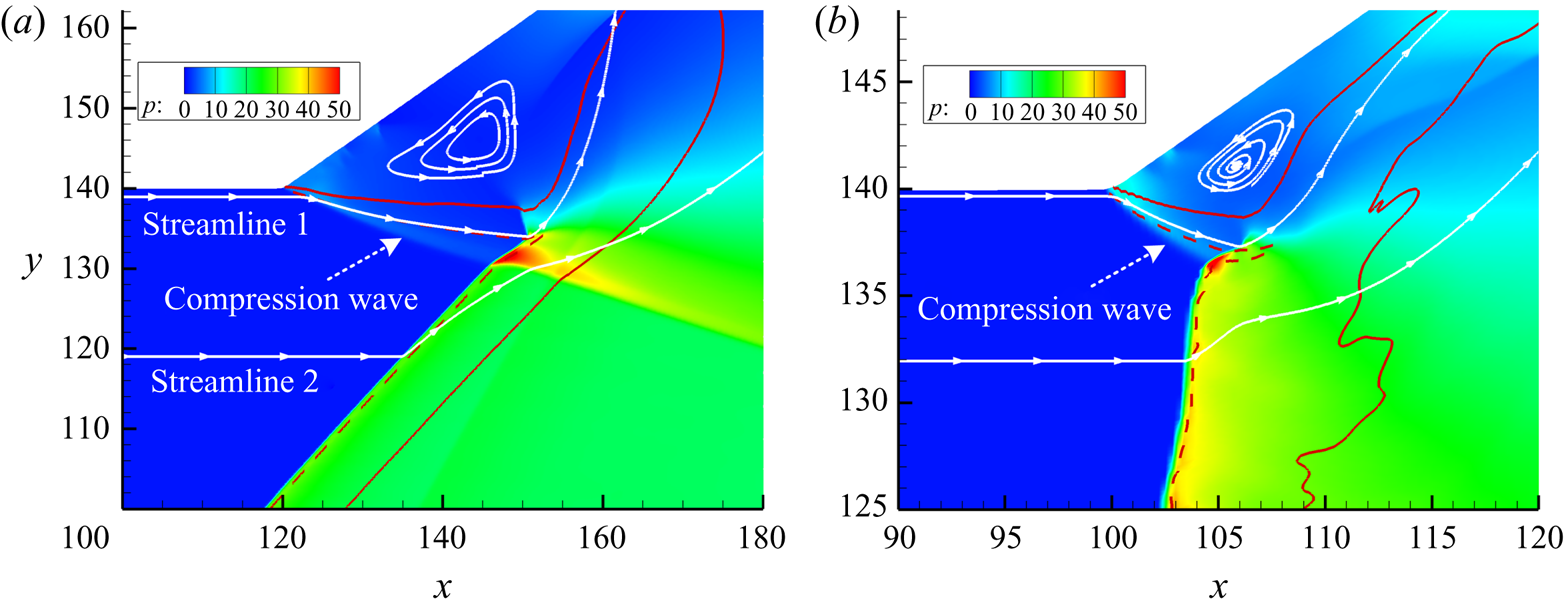
Figure 7 shows the local pressure fields and streamlines of the two wave configurations. The pressure in the post-turning zone is obviously lower than that behind the undisturbed ODW surface, and there is a compression wave connecting the turning point and the ODW surface, as shown in figure 7(a). However, the coiled streamlines indicate that the post-turning triangle zone is actually a recirculation zone. Meanwhile, the upstream streamlines close to the upper wall, such as streamline 1, deflect downward rather than upward first. The lower streamlines such as streamline 2 deflect upward when entering the undisturbed ODW surface. The reaction contours of  $\lambda = 0.05$ and 0.95 are plotted with dashed and solid curves, roughly denoting the start and end of heat release. There is a noticeably long heat release zone extending downstream, surrounded by the red solid curve. There are no ODWs in this transition region, but decoupled shocks with a spread heat release region. Therefore, the final wave configuration derives from the ODW decoupling and its related variation of heat release.
Local pressure fields for (a)  $M_0 = 7$,
 $L_{c} = 120$ and (b)
 $M_0 = 6$,
 $L_{c} = 100$. The white curves with arrows show the streamlines, and the red curves are the reaction index contours. The dashed red curve is for
 $\lambda = 0.05$ and the solid red curve is for
 $\lambda = 0.95$.

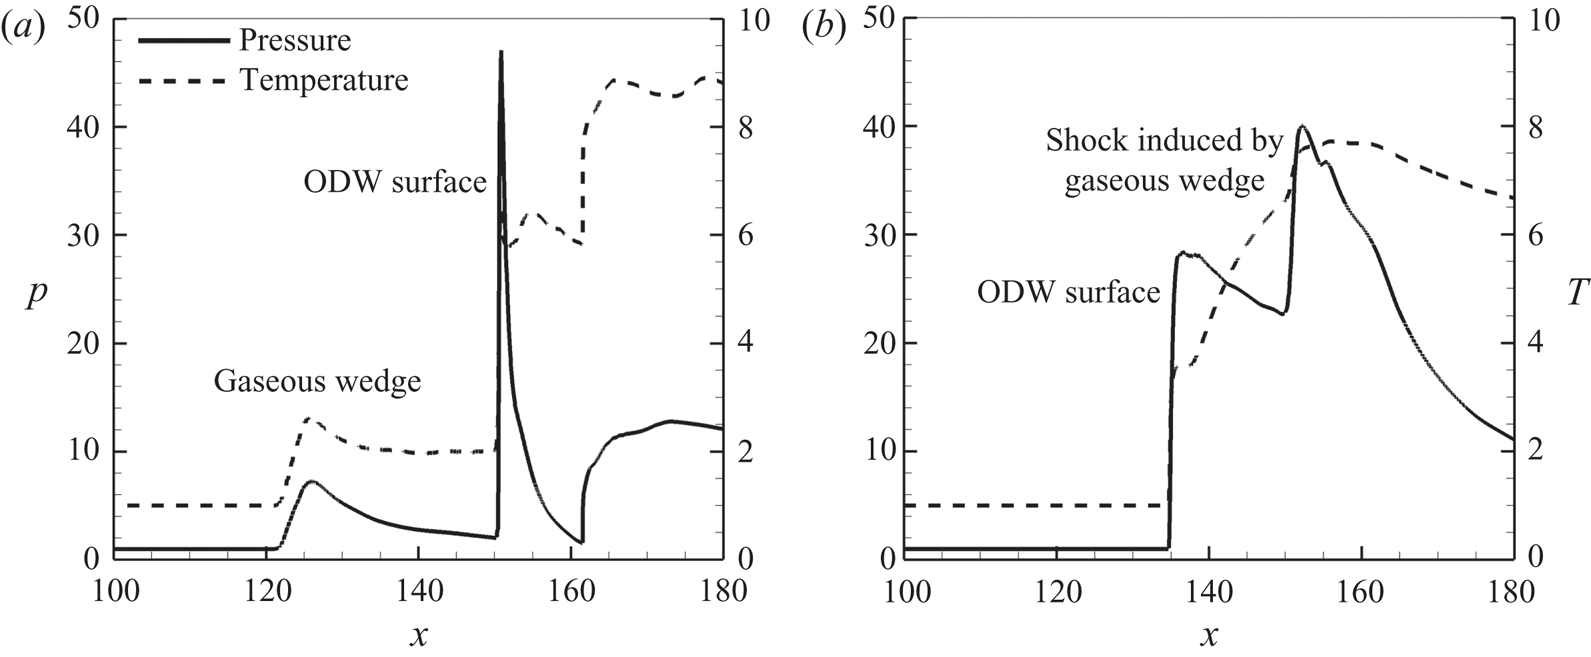
Figure 8 plots the pressure and temperature curves along streamlines 1 and 2 of figure 7(a). Both the pressure and temperature increase where streamline 1 first deflects downward. Hence, there is actually a virtual boundary (or a gaseous wedge) rather than an expansion wave, owing to the recirculation zone. Behind the gaseous wedge, the pressure and temperature decrease until the streamline reaches the ODW surface, leading a strong discontinuity. However, streamline 2 in figure 8(b) enters the ODW surface first and then interacts with a weak shock, resulting in modest increases of pressure and temperature. The weak shock derives from the gaseous wedge, as shown in figure 7(a). In conclusion, the new wave configuration not only features a recirculation zone, but also leads to a gaseous wedge equivalent. The gaseous wedge is in front of the recirculation zone, replacing the Prandtl–Meyer expansion fan. To our knowledge, this wave configuration has never been reported before.
Pressure and temperature curves along streamlines (a) 1 and (b) 2 for  $M_0 = 7$,
 $L_{c} = 120$.

3.3. Effects of different geometrical and chemical parameters
Parametric studies on more cases were conducted to elucidate the formation of the new wave configuration, especially the recirculation zone. The two cases above are named cases 1 and 2. Other cases were simulated by varying the geometrical parameters  $L_{c}$ and
 $\theta _2$, and the chemical parameter
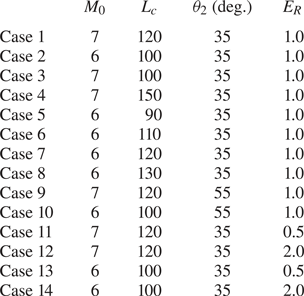
 $E_R$. Table 1 lists the cases whose flow fields are displayed in this subsection except Cases 1 and 2.
Simulated cases with corresponding parameters.

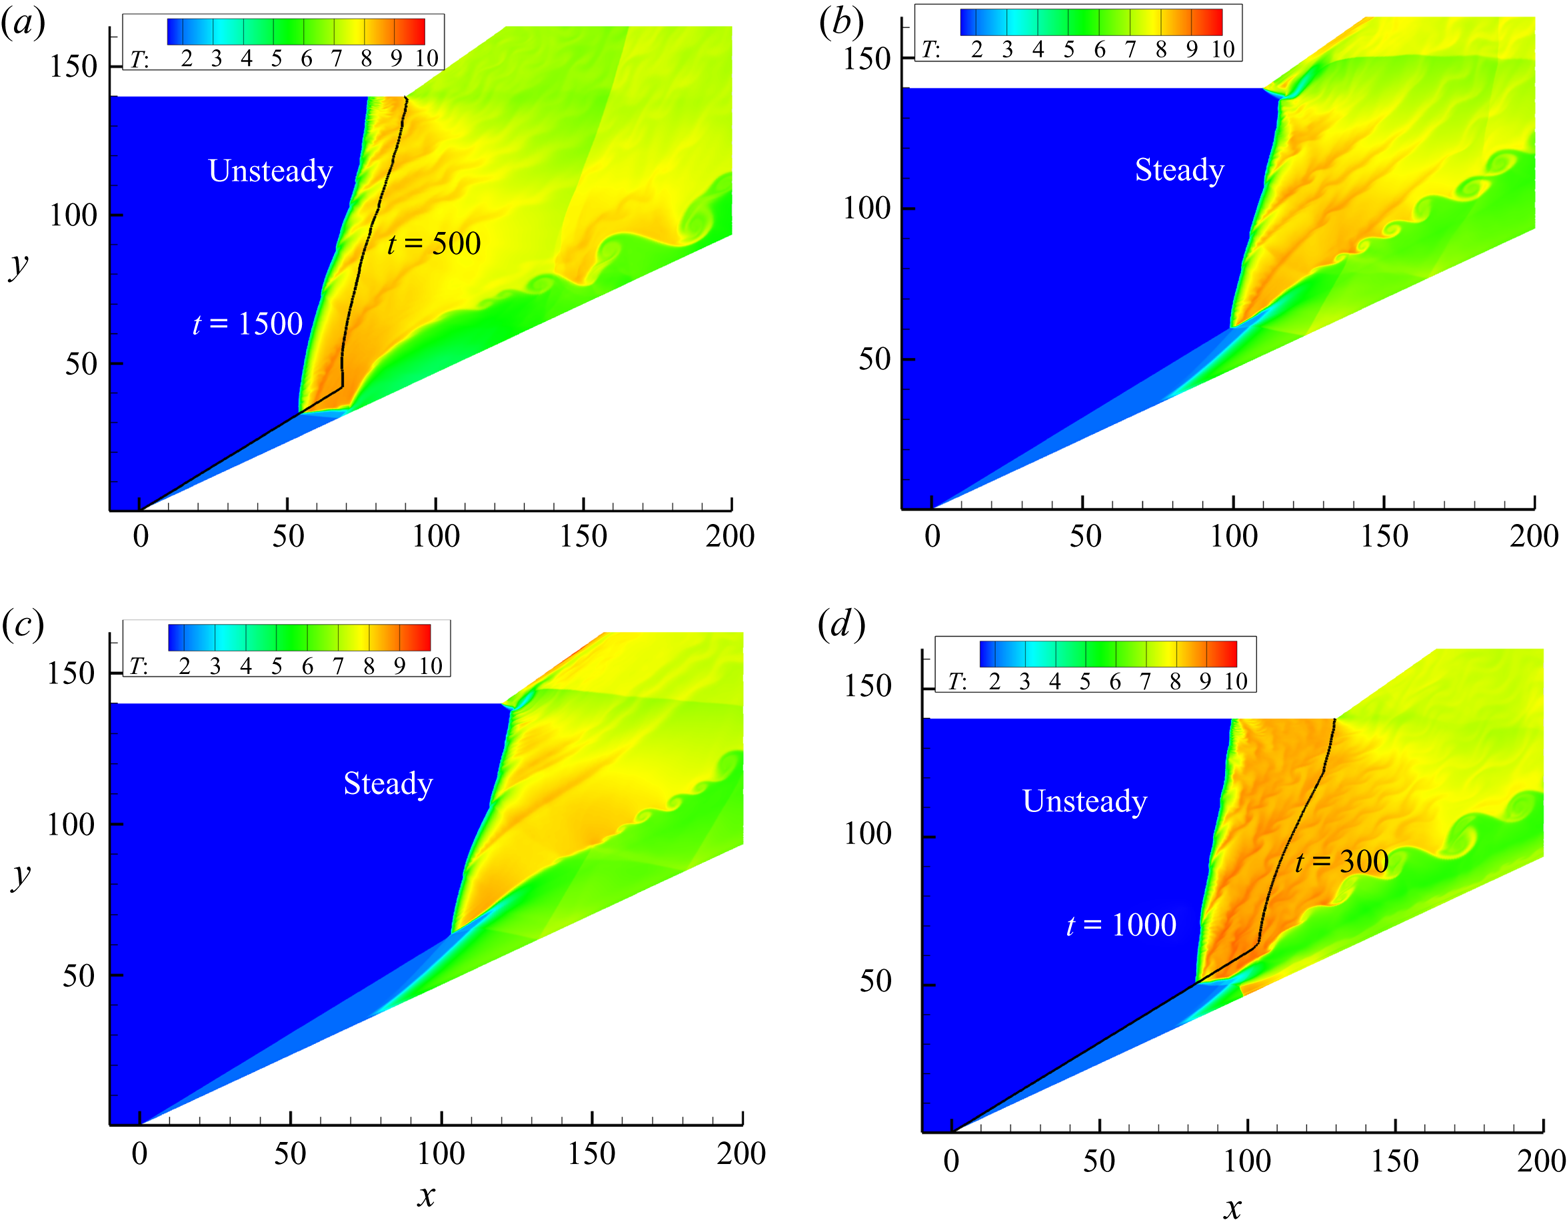
Cases 3 to 8 were simulated to investigate the effects of  $L_{c}$. Figures 9 and 10 show the temperature fields of the ODWs for
 $M_0 = 7$ and 6, respectively. In figure 9, a large recirculation zone appears with a smaller
 $L_{c}$, and increasing
 $L_{c}$ results in a small recirculation zone. Because the wave configurations are similar, only two cases are displayed here. The wave configuration characterized by a recirculation zone arises in figure 9(a), and the low-temperature region becomes large. In figure 9(b), the turning point is very close to the ODW surface, and the recirculation zone is almost negligible. Further increasing
 $L_{c}$ leads to the reflection of the ODW on the preturning upper wall, a different wave system which is not studied here.
Temperature fields for  $M_0 = 7$ with (a)
 $L_{c} = 100$ and (b)
 $L_{c} = 150$.

Temperature fields for  $M_0 = 6$ with
 $L_{c} = 90$ (a), 110 (b), 120 (c), and 130 (d). The black curves in panels (a) and (d) illustrate the wave fronts at a certain instant before.

For  $M_0 = 6$, varying
 $L_{c}$ leads to more complicated flows, as shown in figure 10. An unsteady structure arises when
 $L_{c}$ decreases to 90, so the whole ODW propagates upstream very slowly in figure 10(a). The wave configurations with
 $L_{c} = 110$ and 120 remain steady, generating the new wave configuration. Nevertheless, the unsteady ODW arises again when
 $L_{c}$ increases to 130 in figure 10(d). Thus, this wave configuration only appears in the narrow
 $L_{c}$ range from 100 to 120. It is also interesting that the recirculation zone keeps small rather than varying significantly in figure 9. This is achieved by the ODW surface movement with
 $L_{c}$ in figures 10(b) and 10(c), suppressing any change of the recirculation zone. Furthermore, there are always unstable surfaces in figure 10, suggesting that the surface instability is induced by low
 $M_0$.
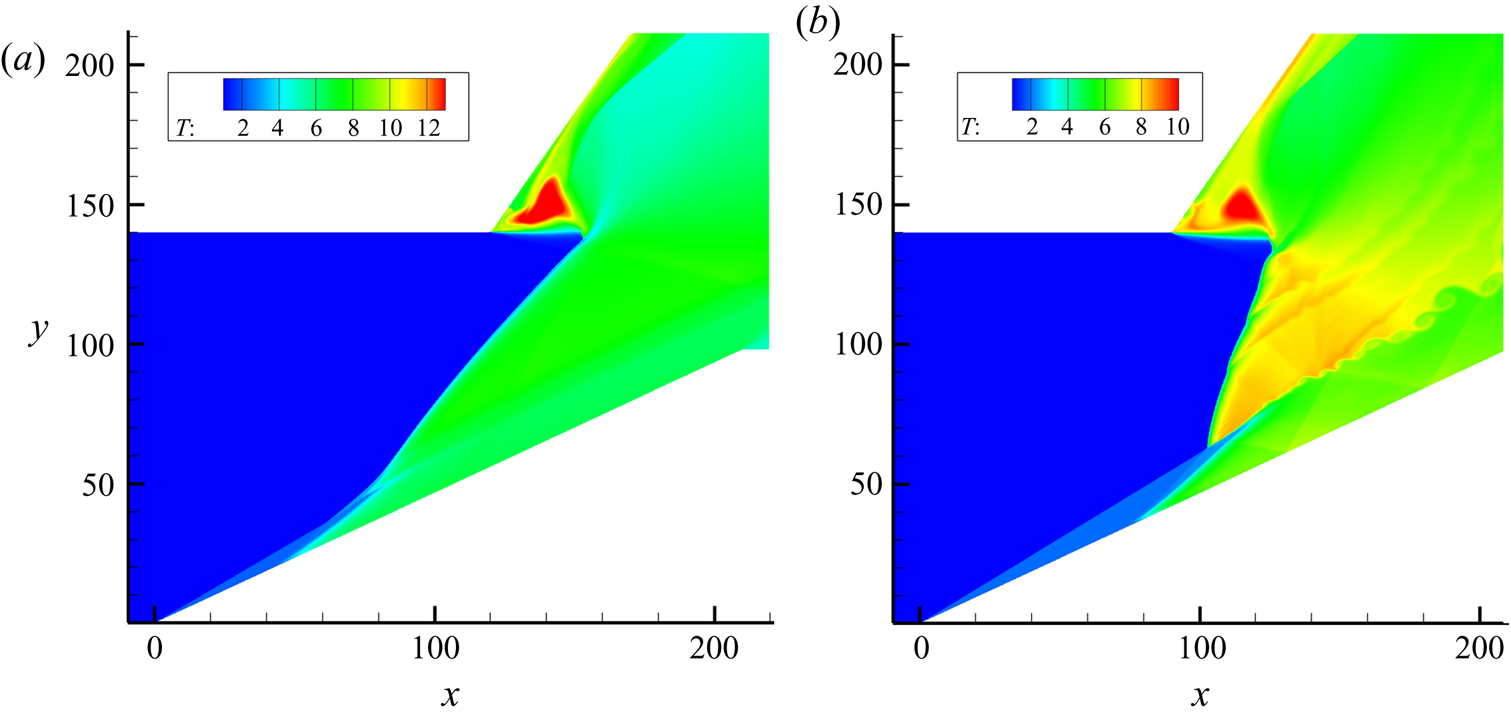
Cases 9 and 10 were simulated to investigate the effects of  $\theta _2$ and are shown in figure 11. The cases with a modest
 $\theta _2 = 45^\circ$ were also simulated, but their flow fields are similar and so not shown here. The new configuration also arises in these cases, except for some minor differences in the wave positions. In figure 11(a) with
 $M_0 = 7$, a large
 $\theta _2$ does not change the area of the recirculation zone, but the gaseous wedge becomes weak and almost parallel to the inflow. In figure 11(b) with
 $M_0 = 6$, the wave configuration becomes more obvious owing to a large recirculation zone. This is because the high
 $\theta _2$ weakens the effects of the recirculation zone on the unstable surface, which does not approach upstream. It should be noted that the ODW surface in figure 11(a) does not reflect on the deflected wall when the wave interaction is not considered, indicating that the new configuration does not derive from the wall reflection of the ODW surface.
Temperature fields for  $\theta _2 = 55^\circ$ with (a)
 $M_0 = 7$,
 $L_{c} = 120$ and (b)
 $M_0 = 6$,
 $L_{c} = 100$.

Cases 11 to 14 were simulated by varying  $E_R$ to investigate the effects of chemical parameters. Because
 $E_R$ is the activation energy of the heat release reaction, larger
 $E_R$ corresponds to a higher heat release rate sensitivity to temperature, and vice-versa. Figures 12 and 13 show the ODWs with
 $E_R = 0.5$ and 2.0, again illustrating the new wave configurations. The variation in area of the recirculation zone can be observed clearly in figure 12 for
 $M_0 = 7$ and
 $L_{c} = 120$. Increasing
 $E_R$ increases the area of the recirculation zone, indicating large flow characteristic lengths. It is interesting to find that the heat release with high
 $E_R$ induces large chemical characteristic lengths, building up the connection of the flow and chemical characteristic lengths. However, for
 $M_0 = 6$ and
 $L_{c} = 100$, the effect of
 $E_R$ on the recirculation zone is negligible owing to the small area, but the surface transverse wave indicates an obvious effect. From figure 13, it is observed that increasing
 $E_R$ results in fewer transverse waves on the surface. Above cases collectively demonstrate that there exist more transverse waves on the unstable surfaces when
 $L_{c}$,
 $\theta _2$ and
 $E_R$ decrease, as shown in figures 10, 11 and 13, respectively.
Temperature fields for  $M_0 = 7$,
 $L_{c} = 120$ with
 $E_R = 0.5$ (a) and 2.0 (b).

Temperature fields for  $M_0 = 6$,
 $L_{c} = 100$ with
 $E_R = 0.5$ (a) and 2.0 (b).

3.4. Discussion of the structural features
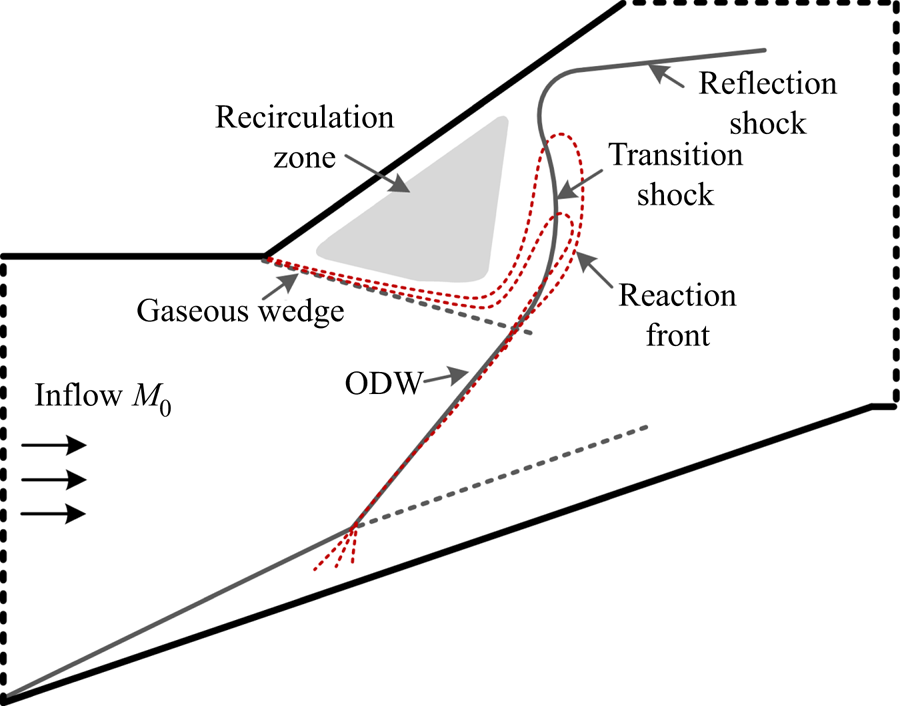
Figure 14 shows the schematic of the new wave configuration according to the common features observed from the above flow fields. The established wave configuration actually deviates from the presumed one, i.e. the interaction of an ODW with a Prandtl–Meyer expansion fan. There is still the ODW whose lower part is undisturbed, but the upper part evolves through its interaction with the supersonic flow after a turning point. The primary structural feature is the formation of the recirculation zone, which is critical to understanding the whole configuration. In the presumed wave configuration, the inflow supersonic gas expands through the Prandtl–Meyer expansion fan. Hence, the gas in front of the ODW surface has low pressure, low temperature and a high Mach number, when the present evolution is not considered. The pressure/temperature induces the ODW decoupling and expansion toward the wall, and then the high Mach number or high flow velocity leads to the downstream movement of the heat release layer, as marked by the red dashed curves in figure 14. The heat release occurring downstream decelerates the supersonic flow and raises the pressure there, resulting in a recirculation zone propagating upstream that does not stop until a gaseous wedge is generated behind the turning point. The decoupling also generates the transition shock and the reflected shock, which can be observed in almost all the cases.
Schematic of the new wave configuration.

On the whole, the formation of this structure deepens our knowledge and enhances ODE design. The ODE performance and robustness are among the main concerns in any engine design, especially when operating conditions deviate from the ideal setting. For instance, in the design, the ODW should reflect on the turning point of the upper wall (Sislian et al. Reference Sislian, Dudebout, Schirmer and Schumacher2001). However, it is impossible to maintain ideal conditions in practical flight. The reflection deviation on the upper wall may induce thermal choking, which will be discussed later in this paper. As demonstrated by the stable structure revealed in this numerical study, a robust flow configuration makes it possible for the ODE to operate at a greater inflow Mach number or angle of attack, independently of  $L_{c}$.
Beside the new wave configuration, the ODW instability deserves more attention. The ODWs for  $M_0 = 7$ are steady with smooth surfaces, but the surfaces are all unstable for
 $M_0 = 6$. Some of these become unsteady, i.e. propagate upstream, when
 $L_{c}$ increases to 130 or decreases to 90. To investigate the destabilizing mechanism,
 $\theta _2$ was varied to examine the ODWs for extreme
 $L_{c}$. Steady ODWs can be obtained in both cases by setting
 $\theta _2$ to
 $45^\circ$ and
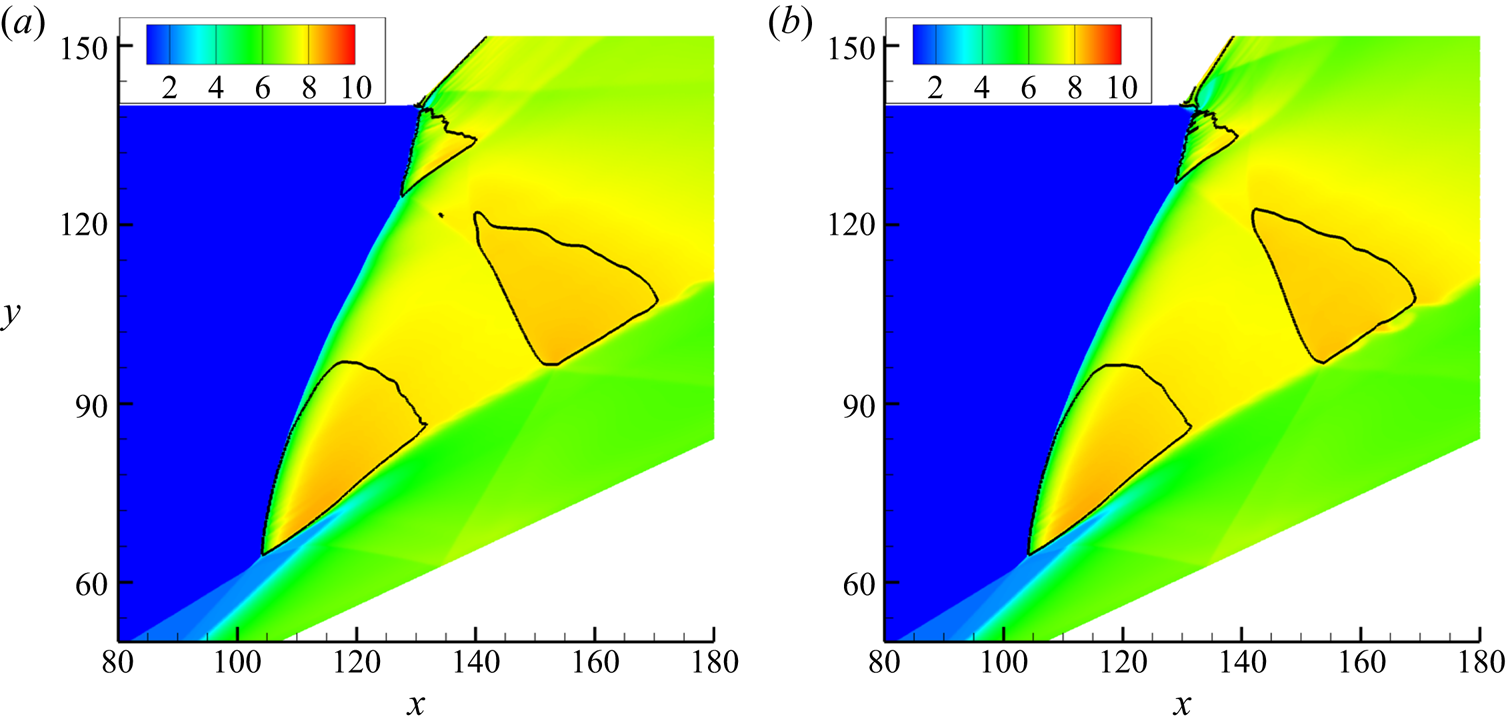
 $55^\circ$, as shown in figures 15 and 16.
Temperature fields for  $M_0 = 6$,
 $L_{c} = 130$ with
 $\theta _2 = 45^\circ$ (a) and
 $55^\circ$ (b). The black curves denote the sonic location.

Temperature fields for  $M_0 = 6$,
 $L_{c} = 90$ with
 $\theta _2 = 45^\circ$ (a) and
 $55^\circ$ (b). The black curves denote the sonic location.

Figure 15 displays the ODWs for  $M_0 = 6$,
 $L_{c} = 130$ in terms of the temperature fields with the sonic location. Different from those surfaces in all the
 $M_0 = 6$ cases above, the smooth surfaces arise here. Actually, there is a small part of an unstable surface near the turning point, the inside of which is subsonic. Owing to a large
 $L_{c}$ of 130, the recirculation zone is small and introduces only a weak disturbance near the turning point. Comparing the two frames with different
 $\theta _2$ values shows that the subsonic zone near the turning point becomes large when
 $\theta _2$ decreases. Further decreasing
 $\theta _2$ to
 $35^\circ$ causes the subsonic zone near the turning point to merge with another one downstream, leading to an unsteady ODW. Steady ODWs are also obtained for
 $M_0 = 6$,
 $L_{c} = 90$ by increasing
 $\theta _2$, as shown in figure 16. With a large
 $\theta _2$, the subsonic zones are isolated, but decreasing
 $\theta _2$ leads to a unified large subsonic zone close to the surface. The merged subsonic zone is easily disturbed, so the ODW becomes unsteady with a lower
 $\theta _2$ of
 $35^\circ$. The different destabilizing mechanisms can be identified: one from the enhanced surface instability and the other from the post-surface thermal choking. The latter arises from the post-surface heating, with the flow reaching sonic conditions and a local subsonic flow field downstream where upstream-propagating disturbances subsequently affect the ODW stability.
For the unstable surfaces of  $M_0 = 6$, the flow fields in § 3.2 indicate that the number of transverse waves (triple points) depends on the simulation parameters. It has been demonstrated that more transverse waves appear with low
 $L_{c}$,
 $\theta _2$ and
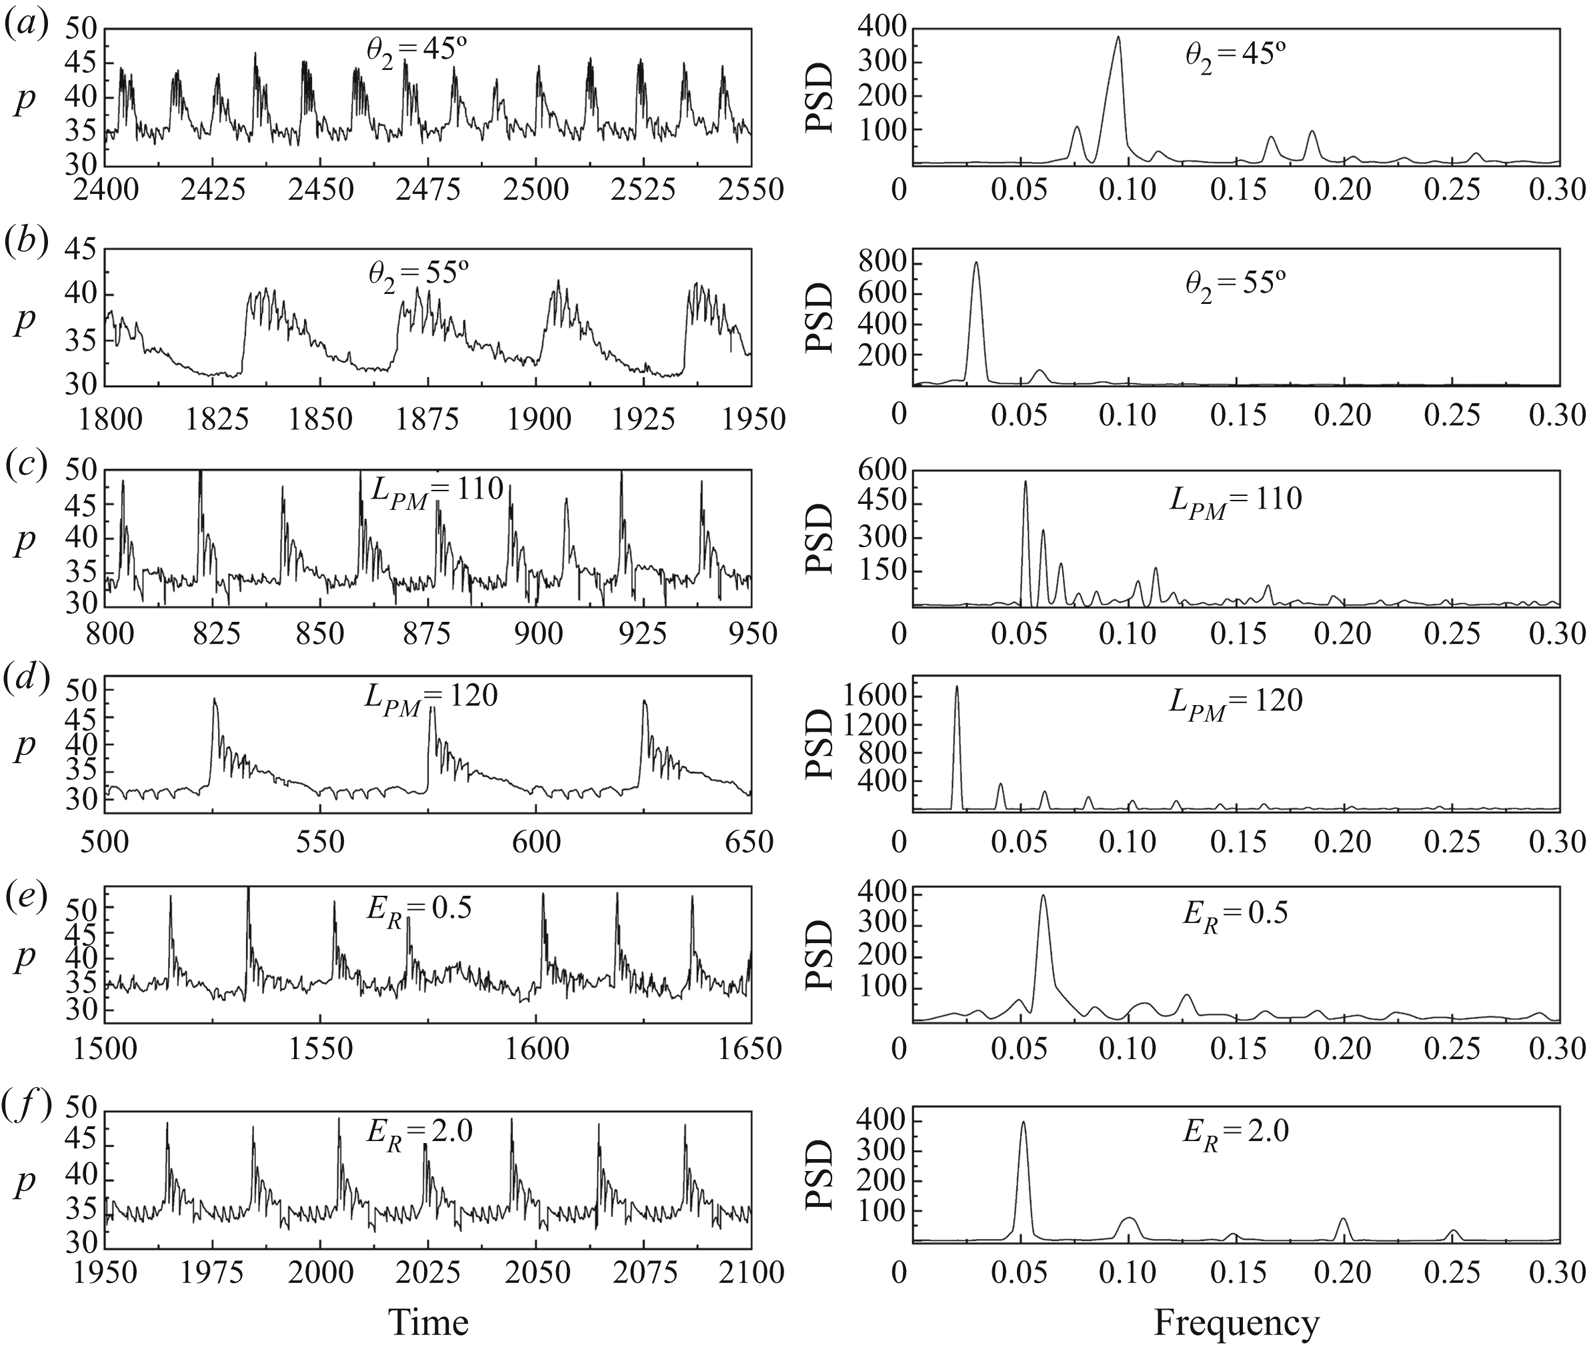
 $E_R$. To quantify these observations, we recorded temporal pressure values at certain positions on unstable surfaces and used the fast Fourier transform to analyse the frequency features via the power spectral density (PSD). The position was chosen at the half-reaction point (
 $\lambda = 0.5$) along the line
 $y = 100$, and the results are shown in figure 17. Changing the monitoring position changes the pressure curves, but the PSD distribution stays the same. The pressure oscillates regularly, and the geometrical and chemical parameters influence the dominant frequency (the frequency corresponding to the maximum PSD). In general, either increasing
 $\theta _2$,
 $L_{c}$ or
 $E_R$ decreases the dominant frequency. The dominant frequency determines the number of transverse waves, and high frequency corresponds strongly to unstable surfaces. Hence, the cases with low
 $\theta _2$,
 $L_{c}$ and
 $E_R$ have more transverse waves, and then strongly unstable surfaces. These results provide a quantitative description of the surface instability, although more cases and work are necessary to develop a rigid stability model in the future.
Pressure and PSD of half-reaction point ( $\lambda = 0.5$) along the line
 $y = 100$. Unless otherwise specified, the default parameters are
 $M_0 = 6$,
 $L_{c} = 100$,
 $\theta _2 = 35^\circ$ and
 $E_R = 1.0$.

4. Conclusions
This study has simulated ODW interaction with an wall expansion corner using the reactive Euler equations with a two-step induction–reaction kinetic model. A new wave configuration has been observed that features a post-turning, triangular recirculation zone coupled with a gaseous wedge connecting the deflection point and ODW surface. The variation of this configuration with respect to  $\theta _2$,
 $L_{c}$ and
 $E_R$ shows that its formation is due to the evolution of ODW decoupling in an expanded supersonic flow. The surface stability and steadiness of the ODW structures were investigated in detail for
 $M_0 = 6$. Special unstable surfaces were observed for the first time, featuring upstream-travelling transverse waves generated continuously near the recirculation zone. The flow fields and quantitative fast Fourier transform analysis show that unstable surfaces with low
 $\theta _2$,
 $L_{c}$ and
 $E_R$ have more transverse waves. The collective effects of
 $L_{c}$ and
 $\theta _2$ on ODW steadiness were simulated, revealing two destabilizing mechanisms: one from the post-surface thermal choking and the other from the enhanced surface instability.
The interaction of an ODW with a changing wall confinement such as an upper deflected wall involves several issues, and this preliminary study focused on the fundamental structure. This is actually a qualitative study owing to the use of the two-step chemical reaction model. Further study based on detailed chemical reaction models will provide more quantitative results. This study did not include viscous effects, which may affect the structure and stability. Moreover, the structure and dynamics in the transition region could be quantified, furthering our understanding of the wave configuration observed. Investigation related to the instability of an ODW surface will be the foundation of determining the wave system inside an engine, and help develop a practical engine that achieves stable combustion in a wide range of inflow parameters.
Acknowledgements
This research was supported by the National Natural Science Foundation of China (NSFC) (nos. 11822202 and 91641130), the Natural Sciences and Engineering Research Council of Canada (NSERC) and the 111 Project (no. B16003) of China.
Declaration of interests
The authors report no conflict of interest.