





Introduction
Major depressive disorder (MDD) is a prevalent psychiatric disorder, characterized by heterogeneous clinical symptoms and differentiated treatment responses. Despite advances in antidepressant therapies, it was estimated that around one-third of patients fail to achieve remission (Ruberto, Jha, & Murrough, Reference Ruberto, Jha and Murrough2020), highlighting the need to better understand the biological underpinnings of MDD and to identify objective biomarkers for stratifying patient subtypes (Insel & Cuthbert, Reference Insel and Cuthbert2015).
The kynurenine pathway (KP), the major catabolic route of the essential amino acid tryptophan (TRP), has emerged as a critical mediator linking immune activation to neuropsychiatric disorders (Cervenka, Agudelo, & Ruas, Reference Cervenka, Agudelo and Ruas2017). Under inflammatory conditions, TRP is preferentially metabolized through the KP by rate-limiting enzymes, indoleamine 2,3-dioxygenases (IDO1, IDO2), and tryptophan 2,3-dioxygenases (TDOs), rather than toward serotonin (5-HT) synthesis. This metabolic shift reduces serotonin availability, potentially contributing to mood dysregulation and depressive symptomatology (Sublette & Postolache, Reference Sublette and Postolache2012). Beyond serotonin depletion, kynurenine (KYN) metabolites exert distinct neuroactive effects (Savitz, Reference Savitz2020). Certain downstream metabolites, such as 3-hydroxykynurenine (3-HK) and quinolinic acid (QA), have been implicated in neurotoxicity through oxidative stress induction and overactivation of NMDA receptors, whereas others, like kynurenic acid (KYNA), may have neuroprotective and anti-excitotoxic properties. The balance of these metabolites is therefore a key determinant of neuronal function and vulnerability, linking immune and metabolic states to neural circuits underlying depression.
Environmental stressors, particularly childhood maltreatment (CM), are known to prime the immune system toward a pro-inflammatory state, elevating cytokines such as IL-6, TNF-α, and IFN-γ (Johnson & Kaffman, Reference Johnson and Kaffman2018; Nemeroff, Reference Nemeroff2016). These cytokines can divert TRP metabolism into the KP, creating a feed-forward loop of inflammation and neuroactive metabolite production. Most importantly, interaction between IDO2 and CM identified through genome-wide-environment interaction analysis provides genetic evidence for the preferentially branch direction led by CM (Sun et al., Reference Sun, Liao, Zhang, Lu, Ma, Kang, Feng, Zhao, Sun, Zhu, Yuan, Yang, Guo, Zhang, Zhang, Chen, Bi and Yue2025). This finding suggests that genetically determined differences may preestablish a susceptibility background, which, in the context of early-life stress and inflammation, manifests as a specific depression subtype with distinct KP profiles. Although the KP has been proposed as a potential therapeutic target for MDD, its translation into clinical practice remains limited. We therefore propose that effective targeting of this pathway may require specific immune contexts, such as those shaped by early-life stress.
Based on these converging lines of evidence, we hypothesized that individuals carrying IDO2 risk alleles who experienced CM constitute a biologically distinct subtype of MDD. A genetically informed, top-down strategy was used to define this subgroup and to interrogate branch-specific KP alterations across epigenetic, proteomic, and metabolomic layers, with the ultimate goal of advancing biomarker-guided stratification and precision treatment. The study flow chart can be found in Figure 1.
Study flowchart.

Figure 1. Long description
The flowchart is divided into two main sections.
Top Section: Study Design
1. Major depressive disorder patients are shown as a group of blue and orange figures.
2. An arrow points down to Subtype identification, which involves I D O 2 genotype (represented by a D N A helix) and Childhood Maltreatment (C M) (represented by a child icon).
3. The population is split into two groups: the I D O 2-C M group (orange figures) versus the Non-I D O 2-C M group (blue figures).
Bottom Section: Multi-omics comparison on kynurenine pathway (K P)
This section is enclosed in a dashed blue box. The biochemical pathway flows as follows:
1. T R P (Tryptophan) points upward to 5-H T and rightward to N F K via T D Os and I D Os.
2. N F K points rightward to K Y N (Kynurenine) via A F M I D.
3. K Y N branches into three paths:
- Upward to A A via K Y N U.
- Upward to K Y N A via K A T, labeled as Neuroprotective.
- Downward to 3-H K via K M O, labeled as Neurotoxic.
4. 3-H K points rightward to Q A via A C M S D.
Legend at the bottom:
- D N A helix icon: D N A Methylation.
- Protein structure icon: Proteins.
- Triangular cluster icon: Metabolites.
Methods
Participants
Patients with MDD were recruited from a selective serotonin reuptake inhibitor (SSRI) monotherapy cohort led by Peking University Sixth Hospital, as described previously (Liao et al., Reference Liao, Sun, Guo, Kang, Sun, Zhang, He, Huang, Sun, Zhang, Wang, Wang, Chen, Wang, Pan, Ni, Weng, Wang, Cao, Sun, Zhang and Yue2024). A total of 142 patients who completed the CM assessment were included in the present analysis. Depressive symptoms were assessed using the Hamilton Depression Rating Scale (HAMD-17) at baseline and after 4 and 8 weeks of treatment. And antidepressant treatment response was quantified as the percentage improvement in symptom severity from baseline at 4-week and 8-week follow-up endpoints. HAMD ≤ 7 was considered as depression remission. CM was evaluated using the Childhood Trauma Questionnaire (CTQ) at baseline (Bernstein, Ahluvalia, Pogge, & Handelsman, Reference Bernstein, Ahluvalia, Pogge and Handelsman1997). Peripheral venous blood samples were collected at baseline prior to treatment initiation and stored at −80 °C until analysis.
All participants provided written informed consent, and the study protocol was approved by the local institutional ethics committee.
Definition of the IDO2-CM group
Genotyping was performed using the Illumina Asian Screening Array (ASA) chips. Based on our previous genome-wide gene-environment interaction analyses (Sun et al., Reference Sun, Liao, Zhang, Lu, Ma, Kang, Feng, Zhao, Sun, Zhu, Yuan, Yang, Guo, Zhang, Zhang, Chen, Bi and Yue2025), IDO2 rs7846217 was identified as the lead risk variant. Because rs7846217 was not directly genotyped on the ASA, proxy variants in high linkage disequilibrium (LD r2 > 0.8) were extracted. The rs2340953 showed strong LD with rs7846217 (r2 = 0.85 in both Asian and European ancestry populations), and the TT genotype was therefore designated as the risk genotype. CM was defined as exposure to any of the five CTQ subdomains: physical abuse, emotional abuse, sexual abuse, physical neglect, or emotional neglect. Cutoff scores for physical abuse, emotional abuse, sexual abuse, physical neglect, and emotional neglect were set at 10, 13, 8, 10, and 15. And CM experience was defined as whether experience any type of CM or not. Participants carrying the rs2340953 TT genotype and reporting CM were classified as the IDO2-CM group, whereas all remaining patients were assigned to the non-IDO2-CM group.
Metabolite assays testing
Plasma concentrations of TRP, KYN, QA, and KYNA were quantified using commercially available assay kits. TRP was measured with a human ELISA kit (Elabscience E-BC-F091, 1:8), and KYN was measured with a human ELISA kit (Wuhan Feien, EH4214, 1:10), while QA and KYMA concentrations were assessed using ELISA kits from ELK Biotechnology (ELK8141, 1:1; ELK8136, 1:100). All samples were assayed in duplicate, and concentrations were calculated from standard curves generated for each plate. Healthy controls (n = 20) were assayed using the same protocols to provide reference values. Concentrations of all metabolites were converted to pmol/mL based on molecular weight to ensure consistency across metabolites. KP activity was indexed using metabolite ratios reflecting enzymatic flux: KYNA/KYN as a proxy for neuroprotective branch activation, QA/KYN as an indicator of preferential engagement of the neurotoxic branch, and QA/KYNA reflected the shifting status toward neurotoxic branch. KYN/TRP reflected the KP upstream branch.
Proteomic profiling
Plasma protein levels were measured using Olink proximity explore technology (Olink Explore 1536; Olink Proteomics, Sweden). Protein abundance was reported as log2-transformed normalized protein expression (NPX) values following Olink’s internal and inter-plate normalization procedures. Standard Olink quality control steps were applied, including evaluation of incubation and detection controls, assessment of inter-plate variation, and exclusion of proteins or samples not meeting manufacturer-defined thresholds. Proteins related to the KP and inflammatory signaling were extracted for downstream analyses (described in Supplementary Table S1).
Methylation testing
Illumina Infinium MethylationEPIC v2 BeadChips were utilized. Raw intensity data were subjected to stringent quality control prior to downstream analyses. Samples with low overall signal intensity, aberrant control probe profiles, or call rates below predefined thresholds were excluded. Probes were removed if they showed detection P values > 0.01 in more than 5% of samples, mapped to sex chromosomes, contained known single-nucleotide polymorphisms (SNPs) at the CpG or single-base extension site, or were reported to cross-hybridize. Beta values were normalized to reduce technical variation, and batch effects were assessed and corrected where necessary using empirical Bayes methods. The CpG sites located in KP genes were extracted in this study.
Statistical analysis
To test whether the IDO2-CM group represents a biologically distinct subtype or not, between-group comparisons on multi-omics were evaluated. Clinical information and KP metabolic ratios were firstly compared between IDO2-CM and non-IDO2-CM groups using t test or chi-square where appropriate. Linear regression models adjusting for age, sex, and pre-existing medication history were used for group comparisons on multi-omics data. Group differences in DNA methylation were additionally adjusted for batch effects and estimated leukocyte proportions. Proteomic analyses were conducted on z-standardized NPX values across samples after quality control. All statistical analyses were conducted using R (version 4.3.3), with two-sided P < 0.05 considered statistically significant. Multiple testing correction was performed using the false discovery rate (FDR) method.
Results
IDO2-CM group showed poor antidepressant treatment efficacy
Of the 142 patients, 30 (21.13%) patients were categorized into IDO2-CM group, and 112 were classified into non-IDO2-CM group. The basic characteristics can be found in Table 1. The IDO2-CM group showed earlier first-episode age. Totally, IDO2-CM group had poor antidepressant treatment efficacy at both 4th week and 8th week.
Antidepressant treatment characteristics between IDO2-CM and non-IDO2-CM groups

Table 1. Long description
The table consists of five columns: Characteristic, Total sample n = 142, I D O 2 C M n = 30, Non I D O 2 C M n = 112, and P value.
Key data points include:
* Age: Total 37.06, I D O 2 C M 27.47, Non I D O 2 C M 39.63, P < 0.001.
* Sex: Male 23.24 percent total; Female 76.76 percent total, P = 0.818.
* First-episode age: Total 33.49, I D O 2 C M 25.4, Non I D O 2 C M 35.7, P < 0.001.
* H A M D change rate at 4 weeks: Total 49.40, I D O 2 C M 35.73, Non I D O 2 C M 53.00, P < 0.001.
* H A M D change rate at 8 weeks: Total 66.66, I D O 2 C M 51.53, Non I D O 2 C M 70.71, P = 0.023.
* Response at 4 weeks: Yes for 23.33 percent of I D O 2 C M versus 72.32 percent of Non I D O 2 C M, P < 0.001.
* Response at 8 weeks: Yes for 59.10 percent of I D O 2 C M versus 78.57 percent of Non I D O 2 C M, P < 0.001.
* Remission at 4 weeks: Yes for 0.33 percent of I D O 2 C M versus 17.90 percent of Non I D O 2 C M, P = 0.087.
* Remission at 8 weeks: Yes for 31.82 percent of I D O 2 C M versus 60.75 percent of Non I D O 2 C M, P < 0.001.
Neurotoxic shift of KP metabolites in IDO2-CM group
Significant differences were found on four KP ratios between the IDO2-CM and non-IDO2-CM groups (Figure 2). No significant difference in the KP indicators was detected between the non-IDO2-CM group and healthy controls (all P < 0.05). After adjusting for age, sex, and pre-existing medication history, QA/KYN and QA/KYNA ratios remained significantly higher in the IDO2-CM group than in the non-IDO2-CM group (β = 0.086, SE = 0.042, P = 0.023; β = 0.164, SE = 0.045, P = 0.0006; see Supplementary Table S2), whereas no difference was observed in the KYN/TRP and KYNA/KYN ratio between the two groups. The two groups also showed significant difference on TRP and KYN concentrations (β = 44586.5, SE = 19505.4, P = 0.028; β = −197.3, SE = 70.3, P = 0.007). These findings suggest a preferential activation of the neurotoxic branch of the KP in IDO2-CM group. Additionally, individuals only experiencing CM showed significantly reduced KYNA/KYN ratio and increased QA/KYN ratio (see Supplementary Figures S1 and S2).
Kynurenine metabolic branches across different groups. (a) Kynurenine (KYN)/tryptophan (TRP) difference between IDO2-CM group and non-IDO2-CM group; (b) quinolinic acid (QA)/KYN difference between IDO2-CM group and non-IDO2-CM group; (c) kynurenic acid (KYNA)/KYN difference between IDO2-CM group and non-IDO2-CM group; and (d) QA/KYNA difference between IDO2-CM group and non-IDO2-CM group. *P < 0.05; **P < 0.01; ****P < 0.0001.

Figure 2. Long description
A four-panel violin plot layout showing metabolic differences. Each panel contains three groups on the x-axis: H C (black), non-I D O 2-C M group (pink), and I D O 2-C M group (teal).
Panel a. K Y N forward slash T R P ratio. The y-axis ranges from negative 0.05 to 0.15. The I D O 2-C M group shows a significantly lower ratio compared to the non-I D O 2-C M group, indicated by a bracket with a single asterisk.
Panel b. Q A forward slash K Y N ratio. The y-axis ranges from negative 0.2 to 0.8. The I D O 2-C M group shows a significantly higher ratio compared to the non-I D O 2-C M group, indicated by a bracket with two asterisks.
Panel c. K Y N A forward slash K Y N ratio. The y-axis ranges from negative 1 to 4. The I D O 2-C M group shows a significantly lower ratio compared to the non-I D O 2-C M group, indicated by a bracket with a single asterisk.
Panel d. Q A forward slash K Y N A ratio. The y-axis ranges from negative 0.2 to 0.8. The I D O 2-C M group shows a significantly higher ratio compared to the non-I D O 2-C M group, indicated by a bracket with four asterisks.
All panels include individual data points overlaid on the violin plots and a horizontal dashed line at zero.
Differential DNA methylation of KP genes
DNA methylation regulation was strongly associated with CM-related biological pathways. To investigate epigenetic regulation of the KP in IDO2-CM group, we examined DNA methylation levels across key KP genes in IDO2-CM and non-IDO2-CM groups. A total of 336 probes for KP genes were identified, with 278 probes passing the quality control.
Upstream rate-limiting enzyme IDO1 showed decreased tendency in methylation (cg09163429, Δβ = −0.015, Pfdr = 0.12, Figure 3) in IDO2-CM group than non-IDO2-CM group, whereas IDO2 probes were significantly hypermethylated (cg17533575, Δβ = 0.026, Pfdr < 0.05). However, AFMID hypomethylation (Δβ = −0.046, Pfdr < 0.05) may enhance KYN availability. Details can be found in Supplementary Table S3.
Volcano plot of DNA methylation differences in the kynurenine pathway (KP) between IDO2-CM and non-IDO2-CM groups. Each point represents a CpG probe, colored by KP branch: KYNA branch (blue), QA branch (red), and other genes (grey). The x-axis shows the mean methylation difference (IDO2-CM relative to non-IDO2-CM), and the y-axis shows −log10(P value). The horizontal red dashed line indicates the nominal significance threshold (P = 0.05). Only probes with FDR-adjusted P < 0.05 are labeled with gene names. Positive values indicate hypermethylation in IDO2-CM group, and negative values indicate hypomethylation.

Figure 3. Long description
A scatter plot with the x-axis labeled Mean Difference (I D O 2 C M minus non I D O 2 C M) ranging from minus 0.05 to 0.05, and the y-axis labeled minus log 10 (P value) ranging from 0 to 6. A horizontal red dashed line at y equals 1.3 indicates the nominal significance threshold of P equals 0.05. A vertical black dashed line is at x equals 0. Data points are shaped by significance: circles for Down, triangles for N S (not significant), and squares for Up. Points are colored by K P Branch: blue for K Y N A, red for Q A, and grey for Other.
Significant probes above the red dashed line include:
- On the far left (hypomethylated): A F M I D (red circle).
- In the center-top (highly significant): A C M S D (red square) at the highest y-value near 6.5, and I D O 2 (grey square) near y equals 4.
- On the right (hypermethylated): K Y N U (red squares) appearing at multiple points, G O T 1 (blue square), G O T 2 (blue square), H A O 2 (grey square), and a cluster labeled C C B L 2; R B M X L 1; R B M X L 1; C C B L 2 (blue squares).
The majority of non-significant data points (triangles) are clustered near the origin (0,0) and below the horizontal threshold line.
Within the neuroprotective KYNA branch, CpG sites located within CCBL2, GOT1 and GOT2 displayed significantly higher methylation in IDO2-CM group (Δβ = 0.008 to 0.035, Pfdr < 0.05) than non-IDO2-CM group, consistent with reduced expression and a possible decrease in KYNA synthesis, which may compromise neuroprotective capacity.
In the neurotoxic branch, KMO exhibited decreased tendency in methylation (Δβ = −0.005 to −0.020), suggesting increased enzymatic activity. KYNU and HAO2 displayed significant hypermethylation (Δβ = 0.029 to 0.077, Pfdr < 0.05), and ACMSD hypermethylation (Δβ = 0.022, Pfdr < 0.05) could impair QA degradation; these collectively promote accumulation of neurotoxic metabolites in IDO2-CM group than non-IDO2-CM group.
Overall, methylation patterns reflect a functional shift of the KP toward the neurotoxic branch, and concurrent suppression of the neuroprotective KYNA branch, in IDO2-CM group compared to non-IDO2-CM group.
Differential protein levels of KP and inflammation-related proteins
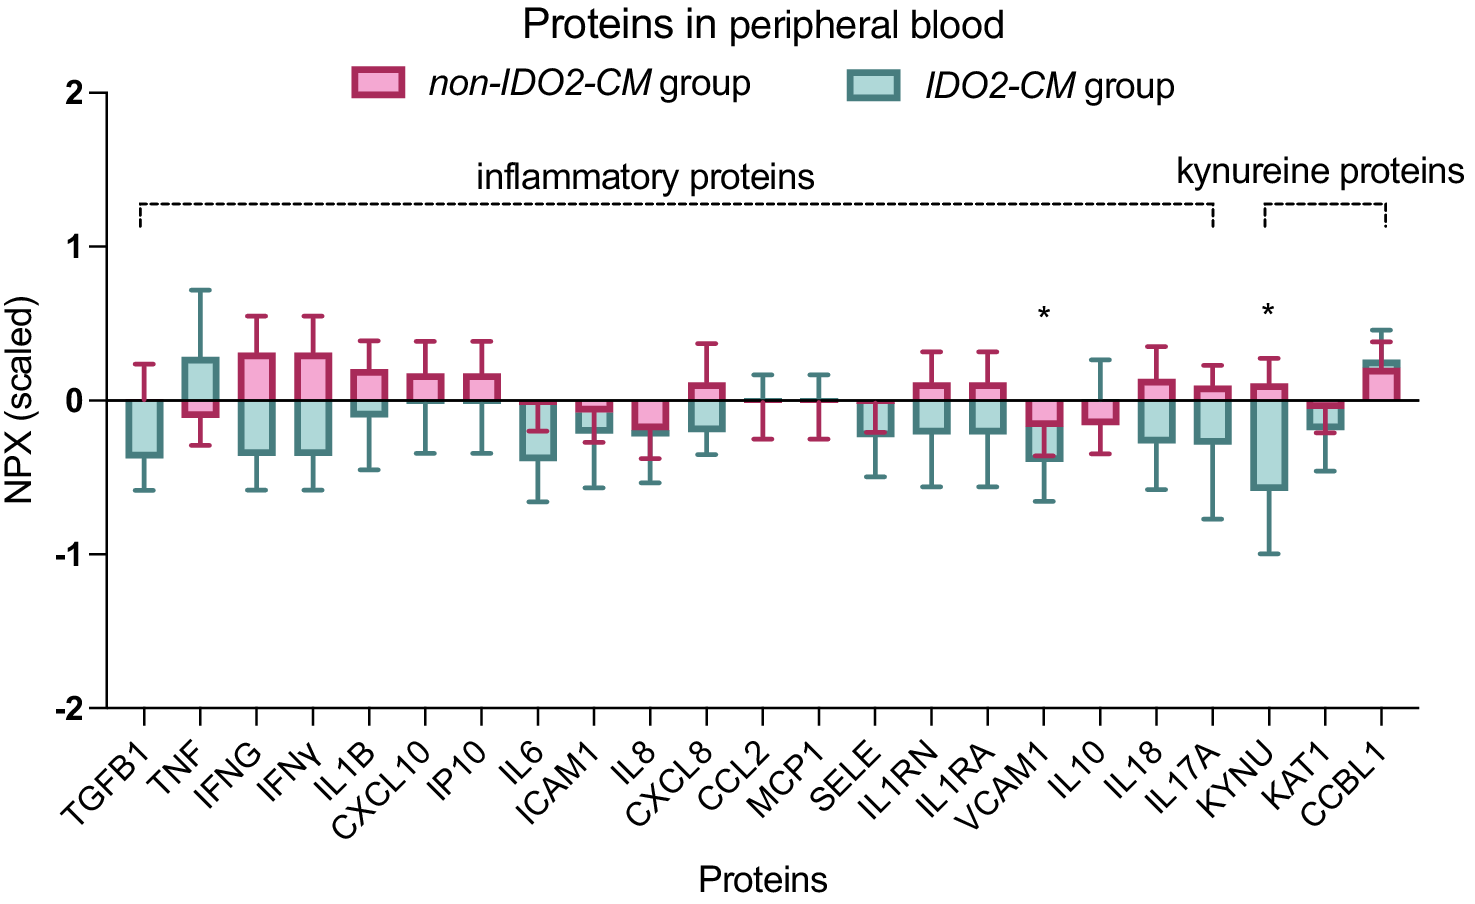
Three KP-related proteins (KAT1, KYNU, and CCBL1) and 16 inflammatory-related proteins were extracted from Olink panel. After adjusting covariates, a significant decrease was observed in KYNU, a key enzyme in the KP (logFC = −0.94, P = 0.040, Figure 4, Supplementary Table S4). Among the classical pro-inflammatory cytokines, levels of IL-6 and TNF-α showed no significant alterations between the two groups. Notably, the adhesion molecule vascular cell adhesion molecule-1 (VCAM1) was significantly downregulated in the IDO2-CM group (logFC = −1.02, P = 0.039). This specific pattern-featuring downregulation of VCAM1 and KYNU in the absence of changes to canonical pro-inflammatory cytokines-suggests that IDO2-CM may be more closely associated with alterations in vascular function and tryptophan metabolism rather than a classical systemic inflammatory response.
Kynurenine pathway and inflammation-related proteins comparison between IDO2-CM and non-IDO2-CM groups. *P < 0.05.

Figure 4. Long description
A grouped box plot titled Proteins in peripheral blood. The y-axis represents N P X (scaled) ranging from -2 to 2. The x-axis lists 22 proteins. A legend at the top identifies pink boxes as the non-I D O 2-C M group and teal boxes as the I D O 2-C M group.
Two brackets at the top categorize the proteins.
1. Inflammatory proteins: T G F B 1, T N F, I F N G, I F N Y, I L 1 B, C X C L 10, I P 10, I L 6, I C A M 1, I L 8, C X C L 8, C C L 2, M C P 1, S E L E, I L 1 R N, I L 1 R A, V C A M 1, I L 10, I L 18, and I L 17 A.
2. Kynurenine proteins: K Y N U, K A T 1, and C C B L 1.
Most proteins show overlapping distributions between the two groups near the zero baseline. Significant differences marked with an asterisk are visible for V C A M 1 and K Y N U. For V C A M 1, the I D O 2-C M group shows a lower median and range compared to the non-I D O 2-C M group. For K Y N U, the I D O 2-C M group shows a substantially lower median and a wider downward error bar compared to the non-I D O 2-C M group.
Discussion
MDD is increasingly recognized as a biologically heterogeneous condition comprising distinct pathophysiological subtypes (Williams, Reference Williams2016). In our previous work, we identified a biologically informed subtype defined by the joint presence of CM and genetically determined IDO2 risk alleles within the KP, termed the IDO2-CM subtype (Sun et al., Reference Sun, Liao, Zhang, Lu, Ma, Kang, Feng, Zhao, Sun, Zhu, Yuan, Yang, Guo, Zhang, Zhang, Chen, Bi and Yue2025). Individuals in this group were characterized by an earlier age at onset, increased psychotic experiences, and a higher prevalence of self-injurious behaviors. Building upon this framework, the present study further demonstrates that the IDO2-CM subtype exhibits significantly poorer antidepressant response, preferential activation of the neurotoxic branch of the KP, and coordinated epigenetic alterations across key KYN-related genes. Collectively, these convergent findings support a model in which early-life stress interacts with genetic vulnerability to shift tryptophan metabolism toward neurotoxic pathways, thereby contributing to a depressive phenotype marked by poor response to SSRIs and potential transdiagnostic significance.
Clinically, the IDO2-CM group exhibited significantly lower symptom improvement and remission rates under SSRI monotherapy, consistent with the hypothesis that etiologically distinct depressive subtypes confer differential treatment sensitivity. The KP has previously been proposed as a potential therapeutic target for MDD (Badawy, Dawood, & Bano, Reference Badawy, Dawood and Bano2023; Cervenka et al., Reference Cervenka, Agudelo and Ruas2017). Findings from the STAR*D cohort indicated that IDO2 moderates antidepressant treatment efficacy (Cutler, Rush, McMahon, & Laje, Reference Cutler, Rush, McMahon and Laje2012), and electroconvulsive therapy has been shown to suppress the neurotoxic branch of the KP in treatment-resistant depression (Schwieler et al., Reference Schwieler, Samuelsson, Frye, Bhat, Schuppe-Koistinen, Jungholm, Johansson, Landen, Sellgren and Erhardt2016). Despite enormous clinical evidence, the KP has encountered a translational impasse, marked by conflicting pathophysiological findings and failed clinical attempts – underscoring why it has yet to yield a druggable target (Brown, Huang, & Newell, Reference Brown, Huang and Newell2021; Platten et al., Reference Platten, Nollen, Röhrig, Fallarino and Opitz2019). The present study contributes to this line of inquiry by localizing KP-related mechanisms using a gene-by-environment interaction framework. While CM has been consistently associated with activate immune-inflammatory response (Teicher, Gordon, & Nemeroff, Reference Teicher, Gordon and Nemeroff2022), and genetic variants within inflammatory or metabolic pathways may further modulate therapeutic response, our findings extend prior work by demonstrating that early-life stress combined with KP-related genetic risk identifies a subgroup marked by especially poor treatment outcomes. These results point to specific triggers of KP engagement that may play a distinct role under certain inflammatory conditions.
Integrated multi-omics analyses further implicate a predominantly neurotoxic KP profile in this subtype. At metabolite level, IDO2-CM patients showed elevated QA/KYN and QA/KYNA ratios, indicating preferential flux toward the QA-producing neurotoxic branch of the pathway, whereas neuroprotective branch activation (indexed by KYNA/KYN) did not differ between subtypes. This pattern suggests that group differences arise from KP enzymatic regulation shaping metabolite balance. QA is a potent NMDA receptor agonist and has been implicated in glutamatergic excitotoxicity, microglial activation, and neurodegeneration – mechanisms strongly linked to depressive symptom severity and treatment resistance (Steiner et al., Reference Steiner, Walter, Gos, Guillemin, Bernstein, Sarnyai, Mawrin, Brisch, Bielau, Schwabedissen, Bogerts and Myint2011). The absence of differences between non-IDO2-CM patients and healthy controls further underscores the specificity of this metabolic bias to the IDO2-CM subtype, rather than reflecting a general feature of MDD.
DNA methylation analyses also revealed coordinated IDO2-CM-associated shifts across multiple nodes of the kynurenine cascade. Reduced methylation of IDO1, together with hypermethylation of IDO2, suggests a context in which inflammatory stimuli may preferentially drive IDO1-mediated tryptophan degradation. Simultaneous hypermethylation of KYNA-branch enzymes (CCBL1/2, AADAT, GOT2) implies suppression of neuroprotective metabolite synthesis, while hypomethylation of KMO and AFMID and hypermethylation of ACMSD collectively favor accumulation of QA. These findings are consistent with accumulating evidence that CM induces long-lasting epigenetic remodeling of immune-metabolic pathways, thereby shaping vulnerability to psychiatric disorders decades later (Lussier et al., Reference Lussier, Smith, Fisher, Luo, Cerutti, Schneper, Smith, Cecil, Felix, Mitchell, Notterman, Ressler, Schaid, Simpkin, Suderman, Walton, Smith and Dunn2024). Importantly, the directionality of methylation changes observed here converges on the shift of metabolic flux toward neurotoxic products, strengthening the biological plausibility of the IDO2-CM subtype. This epigenetic profile also aligns with findings through metabolites and mechanisms previously implicated in depression, including NMDA receptor-mediated excitotoxicity and diminished neuroprotection (Müller & Schwarz, Reference Müller and Schwarz2007).
Proteomic profiling reveals synergistic involvement of the KP and inflammatory signaling in defining this depressive subtype. Patients in IDO2-CM group showed decreased circulating KYNU, accompanied by downregulation of VCAM1. This pattern contrasts with the conventional view of MDD as a state of overt systemic inflammation and instead points toward a more nuanced immune-metabolic phenotype. KYNU catalyzes a key step in the QA-producing branch; however, alterations in circulating KYNU may not directly reflect enzymatic activity within the KP, given its pronounced tissue-specific regulation. Thus, the reduced plasma level may reflect compensatory feedback regulation or tissue-specific enzymatic shifts not captured in circulation. Meanwhile, VCAM1 is involved in endothelial activation and leukocyte trafficking, suggesting that vascular or blood–brain-barrier related processes may play a role in shaping neuroimmune signaling in this subtype (Yang et al., Reference Yang, Velagapudi, Kong, Ko, Kumar, Brown, Franklin, Zhang, Caceres, Min, Filiano, Rodriguiz, Wetsel, Varghese and Terrando2023). This combined dysregulation likely perturbs the balance between neurotoxic and neuroprotective KP metabolites, thereby influencing glutamatergic and monoaminergic neurotransmission in a manner distinct from classical cytokine-driven models. The absence of group differences in IL-6 and TNF-α does not preclude immune dysregulation, as circulating cytokines are influenced by multiple factors and may not adequately reflect central immune processes.
Taken together, our genetic, epigenetic, proteomic, and metabolomic results converge on a model in which CM interacts with IDO2-linked genetic susceptibility to induce persistent reprogramming of KP metabolism. The reprogramming biases pathway flux away from KYNA-mediated neuroprotection and toward QA-driven excitotoxicity, potentially contributing to altered glutamatergic neurotransmission, impaired synaptic plasticity, and reduced antidepressant responsiveness. Such a biologically coherent subtype aligns with contemporary efforts to move beyond symptom-based classification toward mechanism-based stratification in psychiatry. The present findings further suggest that QA/KYN ratios and KYN-pathway methylation signatures may serve as candidate biomarkers for identifying stress-sensitive, treatment-poor-response MDD subgroups. From a translational perspective, patients in IDO2-CM group may benefit from therapeutic strategies targeting glutamatergic signaling or immune-metabolic pathways, such as NMDA receptor modulators, KMO inhibitors, or anti-inflammatory interventions tailored to this specific biological profile. Moreover, incorporating genetic and CM information into clinical assessment may help predict treatment outcomes and guide early intervention strategies.
Several limitations should be acknowledged. First, the sample size of the IDO2-CM subgroup was modest, necessitating replication in independent and larger cohorts to confidently identify small-effect epigenetic or proteomic signals, and findings related to such subtle differences should be interpreted with caution. Second, causal inference cannot be drawn from this observational design, and longitudinal studies beginning in childhood are needed to clarify the temporal dynamics of epigenetic reprogramming. Third, peripheral measures may not fully capture central nervous system processes, highlighting the importance of future work integrating cerebrospinal fluid assays, neuroimaging, or postmortem data. Finally, functional validation experiments are required to determine whether the observed methylation changes directly alter gene expression and enzymatic activity.
Conclusions
In summary, this study identifies a genetically and environmentally defined subtype of MDD characterized by poor antidepressant response and coordinated multi-omics dysregulation of the kynurenine pathway toward neurotoxic metabolism. These findings provide mechanistic support for stress–gene interactions in depression and underscore the promise of biologically informed subtyping approaches for advancing precision psychiatry.
Supplementary material
The supplementary material for this article can be found at http://doi.org/10.1017/S0033291726105509.
Funding statement
This study was supported by the Capital’s Funds for Health Improvement and Research (2024-1-4111, W.Y.); National Natural Science Foundation of China (82501828 Y.S.; 82441005, W.Y.); Beijing Natural Science Foundation (7254462 Y.S.; 7264357, X.F.); Beijing Nova Program (20230484425, W.Y; 202604841254, Y.S.); and Medical Innovation and Development Project of Beijing Medical Association (MIDBMA, 2026BMALB023, Y.S.). The funders did not have any role in the design of the study. The authors acknowledge the use of ChatGPT (OpenAI) for language editing and improvement of manuscript clarity. The authors take full responsibility for the content of the manuscript.




 Open access

