


1. Introduction
Coastal polynyas, which are openings in the sea-ice cover exposing open water and newly formed ice, are formed by wind and ocean currents diverging the ice field. In coastal polynyas, high heat loss from ocean to atmosphere in winter results in very high rates of sea-ice production compared to the surrounding ice cover (Reference Tamura and NihashiTamura and others, 2008). This leads to dense water formation through the large amount of brine rejected into the ocean from newly grown sea ice (Reference Morales MaquedaMorales Maqueda and others, 2004). The dense water formed in polynyas can be a source of bottom water in the Southern Ocean and maintains the cold halocline layer in the Arctic Ocean (Reference Cavalieri and MartinCavalieri and Martin, 1994). Due to the lack of an insulating ice cover when open water is maintained, heat loss and thus ice production rate are at a maximum during episodes of supercooling and associated frazil ice formation.
Under cold and windy conditions, sea ice is initially generated as small mm- or μm-scale disc-shaped or dendritic crystals, called frazil ice (Reference MartinMartin, 1981). Laboratory experiments have shown that underwater frazil ice formation occurs in association with supercooled water resulting from large surface heat loss under turbulent conditions with strong wind (Reference Ushio and WakatsuchiUshio and Wakatsuchi, 1993; Reference SmedsrudSmedsrud, 2001). The magnitude of the supercooling ranges from 100 to 200 mK in laboratory experiments (Reference Ushio and WakatsuchiUshio and Wakatsuchi, 1993).
However, in situ observations of supercooling and underwater frazil ice formation have been hampered by logistical challenges in polar oceans. Such observations are particularly demanding because the supercooling levels of ocean waters, reported to be on the order of 10mK, are close to the instrumental uncertainties, and methods of frazil ice detection have not been well established in the marine environment. So far, few investigators have observed underwater frazil ice formation with supercooling in a polynya. Reference Drucker, Martin and MoritzDrucker and others (2003) observed signals of underwater frazil ice formation associated with supercooling in the St Lawrence Island polynya in the Arctic through mooring observations with upward-looking sonars and salinity/temperature sensors. Reference DmitrenkoDmitrenko and others (2010) observed frazil ice and supercooling in the Laptev Sea coastal polynya in the Arctic, using an acoustic Doppler current profiler (ADCP) and a salinity/temperature sensor. Several measurements have been made of supercooling in the Storfjorden polynya in the Arctic (e.g. Reference Skogseth and NilsenSkogseth and others, 2009; Reference McPhee, Skogseth and NilsenMcPhee and others, 2013; Reference Jardon, Vivier, Bouruet-Aubertot, Lourenço, Cuypers, Willmes and fromJardon and others, 2014). Reference Skogseth and NilsenSkogseth and others (2009) also obtained frazil/ grease ice samples from ∼5 m depth at the polynya edge. Reference ShcherbinaShcherbina and others (2004) and Reference FukamachiFukamachi and others (2009) measured supercooling in the northwestern shelf and Sakhalin Polynya, respectively, in the Sea of Okhotsk.
Supercooled water produced by melting/dissolution of ice shelves or icebergs has also been observed at several sites. In the Arctic, supercooling beneath icebergs was reported by Reference LewisLewis and Perkin (1983). In the Antarctic, Reference Leonard, Purdie, Langhorne and HaskellLeonard and others (2006) and Reference MahoneyMahoney and others (2011) reported on observations of platelet ice growth in supercooled water beneath the sea-ice cover in McMurdo Sound. Reference LeonardLeonard and others (2011)described the seasonal evolution of a layer of supercooled water beneath the sea-ice cover at a site close to the McMurdo Ice Shelf.
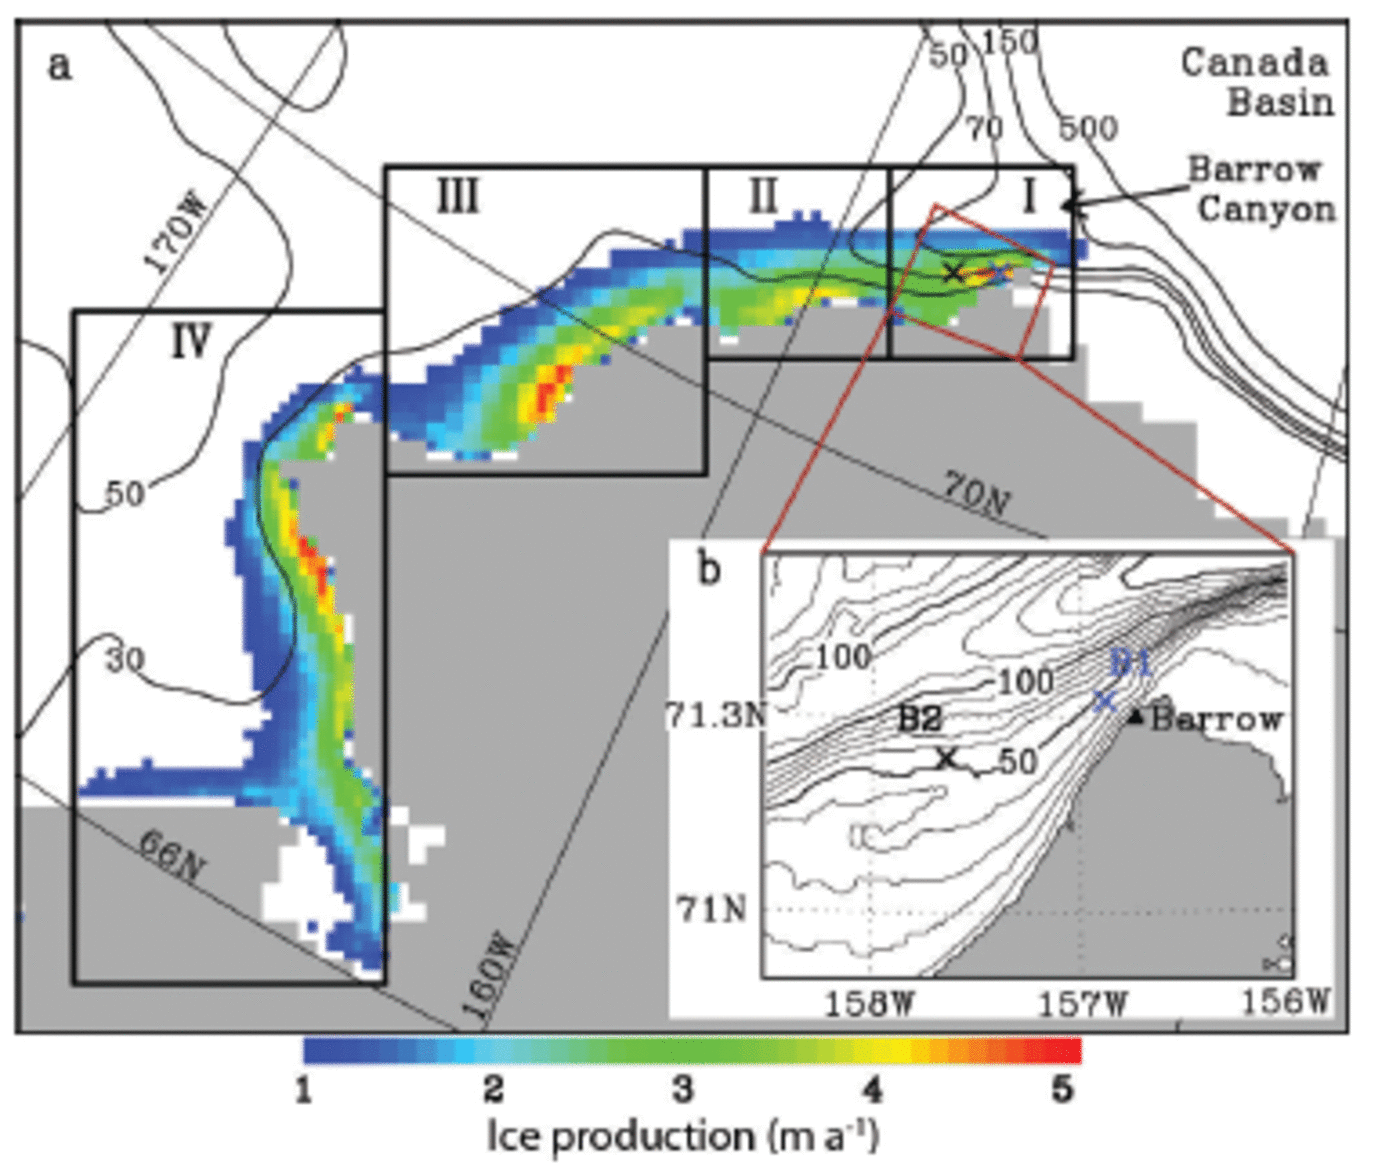
We have conducted mooring observations off Barrow (Fig. 1), Alaska, USA, in the Chukchi Sea since 2009, through a collaboration between Hokkaido University and the University of Alaska Fairbanks as part of the Seasonal Ice Zone Observing Network. The aim is to investigate the seasonal break-up of landfast sea ice (Reference Petrich, Eicken, Zhang, Krieger and FukamachiPetrich and others, 2012) and coastal polynya processes, and to provide validation data for satellite-derived ice thickness (Reference Iwamoto, Ohshima, Tamura and NihashiIwamoto and others, 2013). A series of coastal polynyas and flaw leads often occurs in this region and further southwest along the Alaskan coast with active sea-ice production (Fig. 1; Reference Martin, Drucker, Kwok and HoltMartin and others, 2004, Reference Martin, Drucker, Kwok and Holt2005; Reference TamuraTamura and Ohshima, 2011). Brine rejection due to high ice production in these polynyas contributes to the maintenance of the cold Arctic halocline (Reference Martin, Drucker, Kwok and HoltMartin and others, 2004; Reference Itoh, Shimada, Kamoshida, McLaughlin, Carmack and NishinoItoh and others, 2012). In the data from these moorings, we find evidence of several supercooling events and also detect signals of frazil ice with an Ice Profiling Sonar (IPS), associated with the polynya activity.
(a) Map of the Chukchi Sea coastal polynyas with annual cumulative sea-ice production (color shadings) averaged over 2003–11 from Reference Iwamoto, Ohshima and TamuraIwamoto and others (2014). The 30, 50, 70, 150 and 500 m isobaths are indicated. The bottom topography data are obtained from ETOPO1 (Reference Amante and EakinsAmante and Eakins, 2009). The rectangular areas I–IV are those for which time series of the polynya extent are shown in Figure 2d. (b) The inset map shows the location of the moorings B1 and B2 (crosses).
This paper details the observation of supercooled water and frazil ice, based on mooring measurements along with satellite and meteorological data. To the best of our knowledge, this study provides the first IPS observation of underwaterfrazil ice in the ocean, using a newly developed profile mode option. The IPS is capable of much higher temporal observation than the upward-looking sonar (e.g. Reference Drucker, Martin and MoritzDrucker and others, 2003). On the basis of these observations, we also discuss the formation processes of supercooled water and frazil ice to improve our understanding of the processes governing high ice production rates in a coastal polynya.
2. Data and Methods
2.1. Data
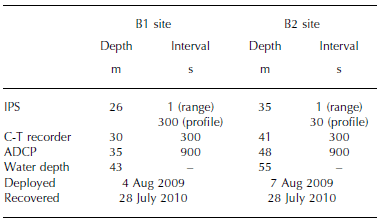
Two moorings, referred to here as B1 and B2, were deployed off Barrow from the beginning of August 2009 to the end of July 2010. B1 was deployed ∼5 km offshore at 71.32° N, 156.88° W in 43 m of water, while B2 was deployed ∼30 km away and 23 km offshore at 71.23° N, 157.65° W in a water depth of 55 m (Fig. 1). Reference Petrich, Eicken, Zhang, Krieger and FukamachiPetrich and others (2012) and Reference MahoneyMahoney and others (2015) have shown that fast ice episodically forms over the B1 site in winter.
Each mooring was equipped with a conductivity-temperature (C-T) recorder (SeaBird SBE-37), an ADCP (RDI WH-300 Sentinel) and IPS (ASL IPS5). Table 1 gives details of the mooring deployment. The accuracies of temperature and salinity, obtained from measurement of conductivity, are ± 2 mK and ±0.004 psu, respectively. Pre-deployment calibrations were carried out before the observation in May 2009. In May 2011, post-deployment calibrations revealed minor drift for each of the sensors. However, this sensor drift does not affect our findings. The accuracy of pressure measured by the IPS is ± 5 x 10² Pa. The ADCPs obtained valid data in 15 vertical 2 m bins from ∼31 m to ∼3 m at B1 and 20 vertical 2 m bins from ∼41 m to ∼3 m at B2, with an accuracy of 0.01 ms–1 (0.86kmd–1).
Deployment details of the moorings. Terms IPS, C-T recorder and ADCP denote Ice Profiling Sonar, conductivity–temperature recorder and acoustic Doppler current profiler, respectively
The acoustic frequency of the IPS is 420 kHz, corresponding to a wavelength of ∼3.5mm. The IPS detects the distance from the instrument to a target which is the underside of the sea ice, or, in its absence, the ocean surface, at a sampling interval of 1 s. In the target mode, the range (or distance) is recorded, as well as the maximum acoustic amplitude of the target (return strength) (Reference MellingMellingand others, 1995; Reference Fissel and MellingFissel and others, 2008). The detected amplitude of the acoustic wave pressure reflected from underwater targets represents the digitized voltage amplitude, ‘return strength’. In our IPS5, return strengths are expressed in the 16-bit digitized count output of the instrument (0-65 535 counts). The IPS5 instrument was operated simultaneously in a water column ‘profile mode’ in which the acoustic backscatter intensity throughout the water column above the instrument is recorded with a vertical resolution of ∼0.01 m at a sampling period of 30 or 300 s (Table 1). Reference Marko and JasekMarko and Jasek (2010a,Reference Marko, Jasek and inb,Reference Marko, Jasek and inc) have shown that the basic IPS5 instrumentation operated in the profile mode can be used to detect and produce complete vertical profiles of frazil ice parameters in a shallow river using the return strength (in counts). We are not aware of published corresponding data reporting the detection of frazil in the ocean.
To examine sea-ice conditions in the study area, we used daily thin-ice thickness data from the Advanced Microwave Scanning Radiometer-Earth Observing System (AMSR-E), which were computed from an algorithm based on the polarization ratio of the brightness temperatures at 89 and 36 GHz channels (Iwamoto and others, 2012, Reference Iwamoto, Ohshima and Tamura2014). The mapped spatial resolutions are ∼6.25 km for 89 GHz and ∼12.5km for 36 GHz. In addition, we used the Envisat Advanced Synthetic Aperture Radar (ASAR) data to examine the ocean and/or sea-ice surface conditions.
The European Centre for Medium-Range Weather Forecasts Interim Re-analysis (ERA-Interim) data with resolutions of 0.75° latitude x 0.75° longitude were used to provide winds at 10 m, air temperature at 2 m, dew-point temperature at 2 m, sea-level pressure and cloud cover. The data at the gridpoint closest to the mooring sites were used and confirmed to be consistent with the meteorological data acquired at Barrow Airport. Correlation coefficients between the two wind datasets for the north-south and east-west components are 0.84 and 0.96, respectively.
Heat loss at the ocean surface is derived from the sum of sensible and latent heat fluxes, and the net longwave radiation. Heat loss at the ice surface is obtained under the assumption that the sum of radiative and turbulent fluxes at the ice surface is balanced by the conductive heat flux through ice. The sensible and latent heat fluxes are calculated from the bulk formulae in a similar way to Reference NihashiNihashi and Ohshima (2001). The longwave radiation is estimated based on Reference Maykut and ChurchMaykut and Church (1973). The shortwave radiation is neglected in winter because it is one or two orders of magnitude smaller than the total heat loss. The ice thickness is derived from the AMSR-E thin-ice algorithm.
2.2. Supercooling of sea water
The freezing point of sea water, T f (°C), is estimated from the salinity, S (psu), and water pressure, P (Pa), following the equation

given by Reference Fofonoff and MillardFofonoff and Millard (1983). Here the constants are a =-0.0575, b = 1.710523 x 10⁻³ c =-2.154996 x 10– 4 and d = -7.53 x 10⁻⁸. In situ supercooled water is defined as the water at temperatures below the in situ freezing point. Potentially supercooled water is defined as water with a potential temperature below its salinity-determined surface freezing point, such that it would become supercooled if it were raised adiabatically to the surface.
The freezing-point calculation according to Eqn (1) has an accuracy of ∼3 mK (Reference Fofonoff and MillardFofonoff and Millard, 1983). Further errors in T f (Eqn (1)) associated with the uncertainty in the pressure and salinity sensors are calculated to be ∼1 mK, resulting in a total T f error of ∼4mK. In addition, the temperature sensors have errors of 2 and 3 mK for in situ and potential temperatures, respectively. Thus, the supercooling measurement contains at least an error of ∼5 mK, due to the above two factors combined by taking their root mean squares.
3. Results
3.1. Supercooling events revealed from mooring data
Figure 2 shows the time series of the mooring data with sea-ice and atmospheric conditions from AMSR-E and ERA-Interim during 1 December 2009 to 28 February 2010. During this period, two persistent coastal polynya events occurred at or in the immediate vicinity of the mooring sites (Fig. 2c and d). These polynya events lasted for 10-15 days and were associated with strong offshore winds (>10ms–1; Fig. 2g); one event took place during the period 20 December 2009 to 1 January 2010 and the other during the period 10-25 February 2010. On 20-21 and 23-26 December 2009, during the former event, episodic potential supercooling occurred coincidentally at 30 m depth for B1 and at 40 m depth for B2 (Fig. 2a and b). In particular, on 21 and 25 December 2009, the C-T recorder shows 7 mK of in situ supercooling at B1, which is comparable to the instrument uncertainties of ∼5-10mK (see Section 2.1; Reference MahoneyMahoney and others, 2011). These events show potential supercooling of up to 28 mK, far exceeding the instrument uncertainties. These supercooling events occurred at both sites at the same time, reducing the likelihood of the observed supercooling being caused by contamination of the conductivity cell by ice. During the latter persistent polynya event, potential supercooling of ∼10 mK was observed on 8 February 2010 at B1 and on 19-20 February 2010 at B2. All these episodic supercooling events occurred when the coastal polynya was active at the mooring sites, with large heat loss of 200-600 Wm– 2 to the atmosphere (Fig. 2c). Therefore, it is likely that these supercooling events are caused by strong direct surface cooling.
Time series of the mooring data with AMSR-E and meteorological data, during 1 December 2009 to 28 February 2010. (a) The water temperature relative to in situ freezing point (blue) and the potential temperature relative to the surface freezing point (red) at 30 m depth at B1 from the C-T recorder. The light blue line is the freezing point. (b) Same as (a) at 41 m depth at B2. (c) AMSR-E ice thickness (green) and calculated heat loss (orange) at B2. (d) Polynya extents expressed as the sum of thin-ice (<0.2 m) area for regions I (red), II (blue), III (green) and IV (grey) indicated in Figure 1, normalized by the maximum extent in winter. (e) The ocean current (3hour mean) from the ADCP measurement at 40 m depth at B2. (f) The potential temperature (red) and salinity (blue) at 40 m depth at B2. (g) 2 m air temperature (pink) and the 10 m wind (green) from the ERA-Interim data at the gridpoint closest to B2. Tick marks correspond to 0.00 UTC.
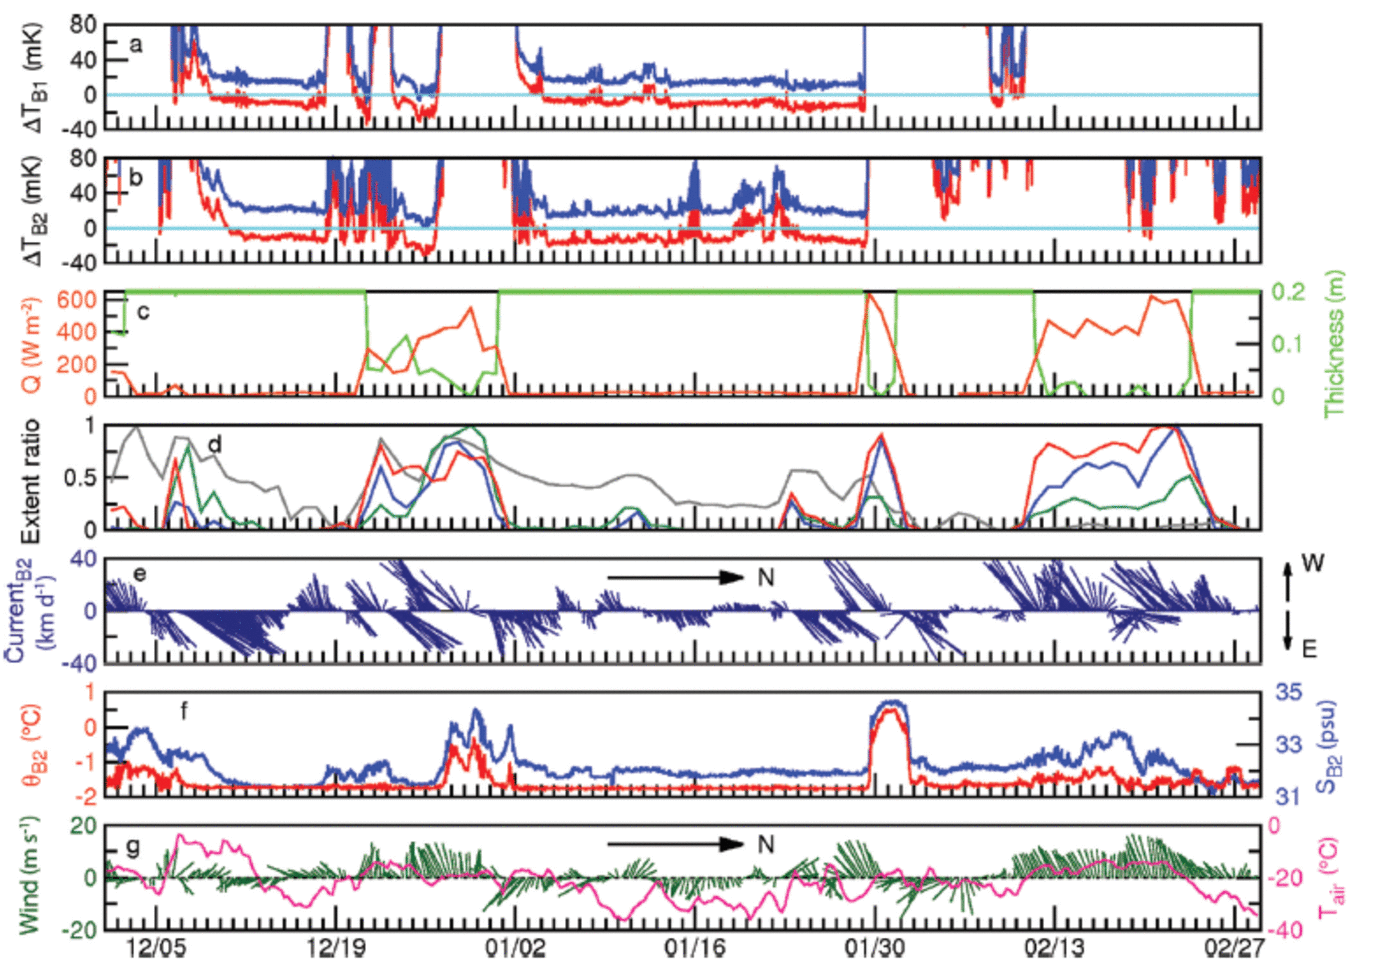
On the other hand, even when the polynya was not open, specifically for 10-18 December 2009 and 4-28 January 2010, coincident potential supercooling of ∼15mK persisted for 1-3 weeks at the two mooring sites. Under the sea-ice cover of thick ice, the heat loss is small and thus insufficient to create supercooled water at depth. According to the ADCP data collected at 40 m depth at B2 (Fig. 2e), a northeastward current of 0.35-0.45 ms–1 (30-40 km d–1) started to be dominant from ∼1 week before the events and persisted for the first half of the events. Mean northeastward velocities at these times were 0.30 ms– 1 (26kmd–1) and 0.15 ms– 1 (13kmd–1) for the two events, respectively. Although the polynya was closed at the mooring locations, the AMSR-E ice thickness data show that other coastal polynyas had formed ∼400-600 km to the southwest (region IV in Fig. 1) in these periods (3-18 December 2009, and 30 December 2009 to 28 January 2010) and a series of polynyas formed along the coast 5 0 - 300km to the west (regions II and III) at the beginning of these periods (5-11 December 2009 and end of December 2009) (Fig. 2d). Thus, the potentially supercooled water masses were likely advected from these polynyas. We discuss the formation processes of these potentially supercooled waters in Section 4.
We also evaluated supercooling based on the TEOS-10 Gibbs Sea Water equation (IOC, SCOR and IAPSO, 2010). The results show that the magnitude of the supercooling is slightly larger, by ∼1 mK, than those evaluated by the formula of Reference Fofonoff and MillardFofonoff and Millard (1983) (Eqn (1)), and do not alter our findings.
According to temperature and salinity data from the C-T recorders (the data at B2 are shown in Fig. 2f), all the supercooling events ended with the advection of saltier and warmer Atlantic Water from the northeast. In particular, at the end of December 2009 and January 2010, the temperature increase was most prominent, exceeding the freezing point by ∼2 K. At this stage, even if a polynya were to be open, new sea ice was unlikely to have formed, and instead likely to have melted. The AMSR-E data also show a rapid increase of open-water area around the mooring sites during this time (not shown).
3.2. Detection of frazil ice by an IPS
Figure 3a shows the time series of range and profile data at B2 on 20 February 2010 when potential supercooling was observed in association with a coastal polynya at the mooring locations. In the profile data, there are many targets exceeding the noise level of 250 counts in the return strength, down to 10–15m depth throughout the day, where we have identified the background noise level in the water column as the return strength of 220 counts based on the year-long profile data and then conservatively defined the noise level as the return strength of 250 counts. The specific definition of the return strength of the IPS is described in Reference Marko, Jasek and inMarko and Jasek (2010b). We interpret these IPS signals as frazil ice based on several lines of evidence presented below.
Time series of range (gray line) and profile (color dots) data obtained by the IPS (a) at B2 on 20 February 2010 and (b) at B1 on 25 December 2009. The vertical axis shows the distance between the IPS and each target. Dot color indicates return strength (in counts) of the profile data (see color bar in (b) for their values). The upper panel of (a) shows the range data in an enlarged vertical scale.

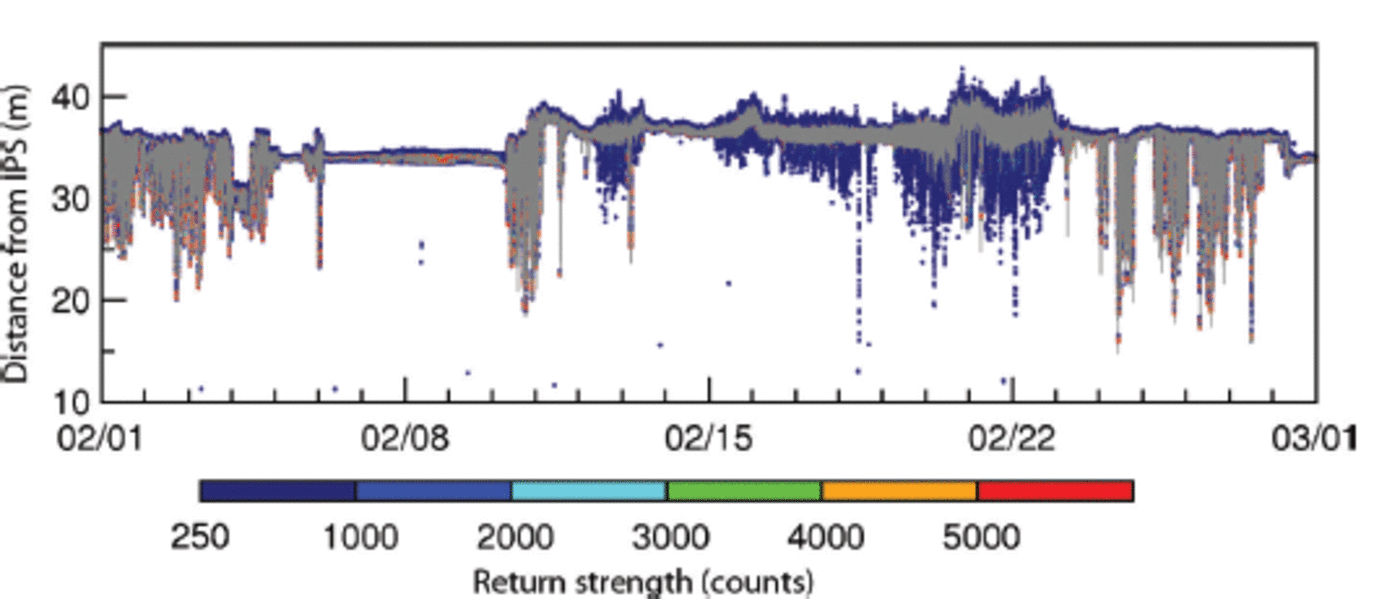
ASAR data (Fig. 4) were obtained for 20 February 2010 when the underwater signal was most prominent in the IPS record of B2. According to the ASAR image, the region around the mooring sites shows relatively high backscatter (brighter white), which indicates rough surfaces corresponding to a wind-roughened sea surface with capillary waves and wind waves. Elongated patches of lower backscatter at the center of the open-water area are interpreted as newly formed frazil and grease ice that helps dampen short-period waves, reducing the backscatter strength. White streaks in the downwind region to the northwest are likely newly formed thicker accumulations of semi-congealed frazil ice that have built up significant cm-scale surface roughness, increasing the backscatter signal relative to grease ice and open water (Reference Drucker, Martin and MoritzDrucker and others, 2003). According to the AMSR-E data (Fig. 5a), the region around the mooring sites shows polarization ratios close to that of the open-water area. Further, the ERA-Interim data show strong offshore wind on that day (Fig. 2g). While the most prominent signals occurred on 20 February 2010 with deep potential supercooling (Fig. 2b), such underwater signals were observed at B2 during the period 12–22 February 2010 (Fig. 6), which corresponds exactly to the active polynya period (Fig. 2c) with strong offshoreward winds prevailing (Fig. 2g). The signals occurred down to 5–10m depth nearly every day during this period except on 14 February 2010. During the entire mooring data record for 2009/10, such long-term underwater signals were observed only in this period. Considering all of these facts, the observed targets in the IPS profile data at B2 are considered to be frazil ice. This is likely the first detection of underwater frazil ice in sea water by an IPS; this finding provides information on the detectability of frazil ice in IPS data, such as a typical threshold value of 250 counts to discriminate frazil returns from background noise.
The Envisat ASAR image obtained at 21.31 UTC on 20 February 2010 using the HH polarization with pixel size of 150 m. Lighter areas present high backscatter. Crosses indicate the mooring locations.

Spatial distribution of the AMSR-E ice thickness on (a) 20 February 2010 and (b) 25 December 2009 derived after Reference Iwamoto, Ohshima and TamuraIwamoto and others (2014). Crosses indicate the mooring locations. Black shading denotes open-water pixels. The pixel size is 6.25 km.

Time series of range (gray line) and profile (color dots) data by the IPS at B2 during 1–28 February 2010. Dates are mm/dd and tick marks correspond to 0:00 UTC. Note that plots of both range and profile data are heavily overlapped because of the compressed time axis, when compared to Figure 3.
On the other hand, on 20-21 and 23-26 December 2009 during periods of in situ and/or potential supercooling at both moorings, underwater targets were not detected except fairly close to the ocean surface. Figure 3b shows the data obtained by the IPS at B1. According to the AMSR-E ice thickness data on this day (Fig. 5b), the ice thicknesses around the mooring sites are ∼0.02-0.05 m. Thus, the ice detected by the IPSs is probably thin sheet ice such as nilas.
4. Discussion
In this section, we discuss the difference in formation processes of sea ice, in the cases of frazil ice formation (20 February 2010) and nilas formation (25 December 2009), described in Section 3. First, we focus on the frazil ice formation case on 20 February 2010 (Fig. 3a). The range data show short-term (order of several seconds) variability with an amplitude of ∼ 1 - 2 m throughout the day. These data are indicative of turbulent conditions at the ocean surface with large surface waves. Such conditions are consistent with the strong offshore winds at speeds exceeding 15 m s–1 (Fig. 2g). Note that the longer distance in the range data in the latter half of the day is due to tilting of the IPS by the strong current.
Taking into account the observed potential supercooling at 40m depth, ocean heat loss of up to 600Wm–2the highest observed during winter 2009/10, and the observation of underwater targets in the IPS data, it is likely that in situ supercooling occurred near the ocean surface, although we did not observe it directly. Subsequently, frazil ice formation probably occurred in the supercooled water, with open water persisting as a result of downward transport of frazil ice by wind stirring or offshoreward transport of frazil ice through the advection by wind, which would have resulted in extremely high ice production.
In contrast, on 25 December 2009 (Fig. 3b), the IPS range data show a near-constant value for the whole day, indicating that nilas was forming under calm conditions. However, the ERA-Interim data on this day show relatively strong offshore winds with speeds exceeding 12 m s–1 (Fig. 2g).
Here we briefly discuss the contrast in sea-ice formation modes on 25 December 2009 and 20 February 2010 in spite of similar atmospheric conditions on these two days. For the case of 25 December 2009, on the preceding 2 days (23–24 December 2009), the ERA-Interim data show weak offshore winds and AMSR-E data show thin ice present. During these days, nilas was likely formed under calm conditions. Once nilas had formed, surface waves were efficiently suppressed even under subsequent windy conditions, so no underwater frazil ice formed (Fig. 3b). This is corroborated by a coastal marine radar operating at Barrow that tracks the width of the landfast ice and movement of offshore ice (Reference Druckenmiller, Eicken and JohnsonDruckenmiller and others, 2009; Reference MahoneyMahoney and others, 2015). The radar indicates smooth ice present at the mooring site B1 with no detectable backscatter or evidence of surface waves, followed by drift ice incursions on 25 December 2009.
In contrast, for the case of 20 February 2010, a coastal polynya had persisted for a week prior to this day (Fig. 2d) maintained by offshore strong winds (>10 m s–1; Fig. 2g). While the polynya persisted, the AMSR-E data show polarization ratios close to that of the open-water area around B2 (not shown), and range data from the IPS at B2 show persistent signals of surface waves (Fig. 6). Persistent strong offshoreward winds caused a persistent turbulent condition with swells, and thereby generated active frazil ice formation under large heat loss of 350–600Wm–2 (Fig. 2c) during the polynya from 11 to 22 February 2010. Moreover, the fetch at site B2 was larger by an order of magnitude than that at site B1, explaining differences in the sea state at the two locations (see also Fig. 4).
We cannot discount the possibility that air bubbles, sediments, fish or zooplankton aggregates acted as potential sources of the IPS-observed scattering within the water column from 11 to 22 February 2010. However, it is noted that underwater scatter was not detected by the IPS during ice-free summer conditions even in conditions more turbulent than on 20 February 2010. Therefore, the likelihood of air bubbles acting as scatterers is considered small. If the signals obtained by our measurements are in fact caused by frazil ice, this is the first report of frazil ice detection in the ocean by IPS.
Next we consider the cause of the persistent potential supercooling lasting for 1-3 weeks during the periods of thick ice cover (>0.2 m) at the mooring sites. These water masses were likely advected from the polynyas which had formed along the coast southwest of the mooring sites, as described in Section 3. Consequently we expect that these waters experienced a substantial heat loss while within the polynya and that they have not been modified by warm Atlantic Water arriving from the east. Under such persistent severe cooling, supercooled water denser than the underlying water is created at the surface layer, and then transported down to the ∼40 m depth (the depth of the C-T recorder) through ocean convection. The advection of such a water mass is the straightforward interpretation of the observed persistent potential supercooling. On the other hand, according to a model simulation of frazil ice formation by Reference Matsumura and OhshimaMatsumura and Ohshima (2015), when strong surface heat loss and high winds occur persistently, a portion of the frazil ice created at the surface layer is transported downward by the wind stirring overwhelming the ice buoyancy. Since the in situ freezing point is lower in deeper layers, frazil ice will melt there, absorb latent heat and finally cool the surrounding water, resulting in the potential supercooling. This is an alternative interpretation of the observed persistent potential supercooling.
5. Conclusions
When open water is maintained in a coastal polynya, the lack of an insulating ice cover causes supercooling and the associated formation of frazil ice, leading to very effective ice production. However, in situ observations of supercooling and underwater frazil ice formation have been very limited due to logistic and measurement difficulties. Mooring observations presented here revealed episodic events of potential supercooling lasting for 0.5–3.0 days at 30–40 m depths in the Chukchi Sea coastal polynya, with a magnitude of 20–30 mK, exceeding the instrument uncertainties. Further, our measurements show in situ supercooling with a magnitude of 7 mK, although this cannot be verified precisely, because its magnitude is comparable to instrument uncertainties.
One notable finding is that frazil ice-like signals were observed by an IPS down to 5-15 m from the surface when the polynya was active, and potential supercooling was recorded at 40 m depth with large heat loss and windy turbulent conditions around the mooring sites. Frazil ice formation is further supported by streaks of high backscatter in the ASAR image just downwind of the mooring sites. Although we are not able to determine the exact depth of frazil ice formation from the present observations, the IPS data and the streaks in the ASAR image suggest that in situ supercooling and subsequent frazil ice formation possibly occur down to 15 m depth. To our knowledge, this is the first detection of underwater frazil ice in sea water by an IPS. Assuming open water, ocean heat loss of ∼600Wm–2 is calculated for the duration of the polynya. Assuming sea-ice density of 920 kg m– 3 and latent heat of fusion of sea ice of 335 kJ kg–1 (Reference MartinMartin, 1981), this corresponds to an ice production rate of 0.17 m d–1.
It is noted that the longer-term potential supercooling lasting for 1-3 weeks also occurred during non-polynya periods at the mooring sites. The water mass associated with this potential supercooling was likely advected from a series of coastal polynyas southwest of the mooring sites and thus also incurred a persistent large heat loss with a turbulent condition. One scenario for this supercooling is that under persistent, severe, surface cooling, supercooled water denser than the underlying water is transported down to ∼40m depth (depth of the C-T recorder) through ocean convection. The other scenario is based on results from the numerical modelling. First a part of frazil ice created in the surface layer is transported downward by wind mixing. Since the in situ freezing point is lower in the deeper layers, the transported frazil ice will melt there, absorb latent heat and cool the surrounding water, resulting in potential supercooling. This mechanism might also contribute to the episodic events of supercooling.
Acknowledgements
AMSR-E data were provided by the US National Snow and Ice Data Center. ASAR data were provided by the European Space Agency. We appreciate the help of J.C. George, H. Brower and B. Adams as well as the North Slope Borough Department of Wildlife Management for the logistical support as well as in boating operations. Thanks are extended to C. Petrich and K. Kitagawa for their support. Special thanks go to J. Marko and D. Fissel for comments about the IPS measurement. We also thank two anonymous reviewers and P. Langhorne (Scienctific Editor) for valuable comments on the manuscript. This work was supported by Grants-in-Aid for Scientific Research (20221001, 23654163 and 25241001), the Green Network of Excellence (GRENE) Arctic Climate Change Research Project of the Ministry of Education, Culture, Sports, Science and Technology and research fund for Global Change Observation Mission 1st-Water of the Japan Aerospace Exploration Agency in Japan, and by the US National Science Foundation Seasonal Ice Observing Network award OPP-0856867.



