Introduction
The number of children migrating for intercountry adoption, which peaked at more than 45,000 in 2004, has fallen rapidly. This article focuses on the period of decline from 2004 to 2010, explores the factors leading to this change and considers the possible future direction of intercountry adoption
The rise and fall of intercountry adoption
The annual number of intercountry adoptions rose slowly to an estimated total of 20,000 per annum in the late 1980s. A slow decline began after South Korea, which accounted for about half the children sent between 1955 and 1987, reduced the numbers sent following adverse publicity at the time of the Seoul Olympics in 1988. For many European countries, this simply accelerated a decline that was already underway (Selman, Reference Selman, Sykes and Alcock1998, Reference Selman2010). Following the fall of Ceausescu in December 1989, Romania offered a temporary respite, but by 1991 a moratorium was imposed and the total number of orphan visas issued in the USA fell to its lowest point since 1987. The situation was transformed in the next decade as large numbers of children were sent by China and Russia so that between 1995 and 2004 the global numbers doubled from 22,000 to 45,000 (Selman, Reference Selman2006, Reference Selman2009b).
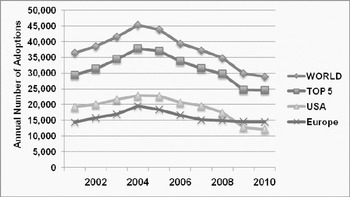
Figure 1 summarises the rise and fall between 2001 and 2010 for all countries, the top five receiving states, the United States and all European countries.
Trends in intercountry adoptions to 23 receiving states.

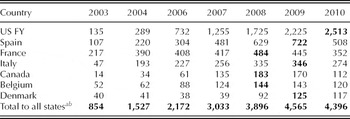
The overall trends are very similar but this pattern is broken from 2008 as the numbers of children going to the USA and Europe converge and from 2009 Europe replaces the USA as the main destination.
Receiving states
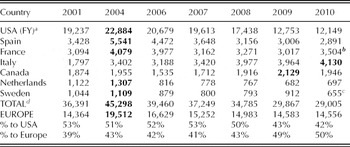
The decline in numbers has affected most countries receiving children through intercountry adoption. There are some striking contrasts between the main receiving states – see Table 1 and Figure 2. Initially the decline seemed to affect Spain most, but the later suspension of adoptions from Guatemala has resulted in the USA having a similar decline from 2004 to 2010 (47 per cent compared to 48 per cent for Spain). The number of visas issued by the US fell further in fiscal year 2011 to 9,320, 41 per cent of the total in 2004 and the lowest annual total since 1995.
Intercountry adoption to top seven receiving countries 1998 to 2010: by rank in 2004 (peak year in bold)

Notes: a US State Department publishes data on a financial year basis (October/September): 2010 total includes 1,090 special emergency visas for Haiti: without these the FY (fiscal year) total for 2010 is 11,059. The total for FY 2011 was 9,320.
b In 2011, the total number of intercountry adoptions in France fell to 1,955
c 2010 Swedish data are for agency placements only.
d Sixteen other countries are included in the overall totals: Andorra, Australia, Belgium, Cyprus, Denmark, Finland, Germany, Iceland, Ireland, Israel, Luxembourg, Malta, New Zealand, Norway, Switzerland and the UK.
Source: Statistics provided by central authorities of the receiving states: see Appendix 1. The data are taken from a more detailed table in Selman (Reference Selman, Gibbons and Rotabi2012a).
Four states receiving most children after the USA.

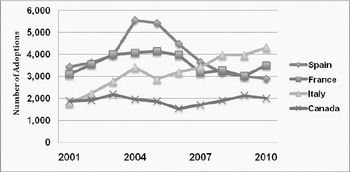
Figure 2 shows the marked variation in trends between the four countries receiving most children after the United States.
Between 2001 and 2004, all four countries saw an increase in the number of children received for intercountry adoption; the number moving to Spain rose by 62 per cent; the number to Italy by 89 per cent; the number to France by 32 per cent. In the next five years, the pattern reversed dramatically in Spain with a fall of 48 per cent, while the number going to Italy rose by a further 21 per cent. The rise and fall in Spain is largely explained by the numbers coming from China (Table 3). In contrast, Italy received no children from China until 2010. Spain also experienced a halving in the number of children from Russia, while the lower number entering Italy in 2004 changed little (Table 5).
In the first six months of 2011, Italy recorded a similar level of adoptions to 2010. However, numbers fell dramatically in France in 2011 following a rise in 2010, which was the result of an influx of children from Haiti.
States of origin
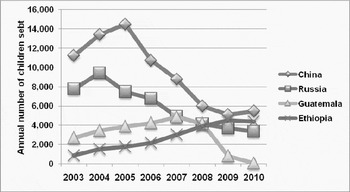
In the past sixty years, Korea has dominated intercountry adoption, sending about 170,000 of the estimated million children moving for international adoption between 1945 and 2010 (Selman, Reference Selman, Gibbons and Rotabi2012b). In the peak year of 2004, it remained one of the five top sending countries. Intercountry adoption was by then driven by two countries, China and Russia, which accounted for more than half of all intercountry adoptions. Ten years later, China remained the largest sender, but Ethiopia had overtaken Russia as the second most important source – Figure 3.
Four countries sending most children 2003−10.

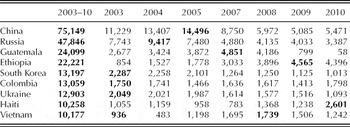
Table 2 shows the changing pattern for nine countries sending more than 10,000 children between 2003 and 2010.
Countries sending 10,000+ children for intercountry adoption between 2003 and 2010 (peak year in bold)

Source: Korean figures are from the Korean Ministry of Health and Welfare, for the other eight countries annual totals are aggregated from data provided by the twenty-three receiving countries listed in Table 1.
The decline in numbers from Korea is continual throughout the period. The three top countries saw an initial rise in numbers, but thereafter the pattern changes dramatically, with numbers falling in Russia from 2004, in China from 2005 and in Guatemala from 2007. For Ethiopia, numbers rise year by year; the total in 2009 is five times the number sent in 2003. These four countries are central to understanding the global decline and its likely continuation or reversal.
Up to 2007, the decline in the number sent by China, Korea and Russia (10,000 less than in 2004) was compensated by a rise of 4,000 in the numbers sent by Ethiopia, Guatemala and Vietnam (see Table 5 in Selman, Reference Selman, Wrobel and Neil2009a). From 2007 to 2009, the dramatic reversal in Guatemala, combined with a continuing fall in China and Russia led to a further reduction of 8,500 international adoptions countered by a rise of 2,000 in adoptions from Ethiopia and Haiti. In 2010, numbers from Russia, Korea and Guatemala have continued to fall, but China's decline has been reversed. The number of children sent by Ethiopia is leveling off and there has been a surge in adoptions from Haiti following the earthquake in January 2010 (see Table 7).
To understand this phenomenon we must examine the impact of changes in China, Russia, Guatamala and Ethiopia. The fall in numbers from Korea began much earlier and has been widely discussed (Bergquist et al., Reference Bergquist, Vonk, Kim and Feit2007). There is no prospect that Korea will ever resume intercountry adoption on the scale of the 1980s. Recent legislation, driven by adoptees and birth mothers (Trenka, Reference Trenka2009; Tae-hoon, Reference Tae-hoon2010; Dobbs, Reference Dobbs2011), will restrict adoptions by foreigners from June 2012, eventually ending the programme altogether. We need to explore whether any countries could replace Korea historically and Russia and China in the past fifteen years.
China
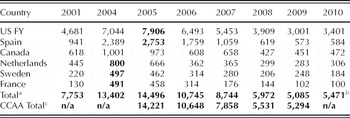
Between 1992 and 2010 China sent more than 125,000 children for intercountry adoption. Table 3 shows the rise and fall of adoption from China from 2001 to 2010, using data provided by fifteen receiving states with detailed figures for the six countries taking most children in this period.
International adoptions from China to fifteen receiving States, 2001 to 2010: six countries receiving most children (peak year in bold)

Notes: a In 2006, the China Centre for Adoption Affairs reported links with sixteen countries. The table above shows the top six countries. The totals include children sent to Australia, Belgium, Denmark, Finland, Iceland, Ireland, New Zealand, Norway and the UK, but no data for Singapore.
b In 2008, the China Central Adoption Authority (CCAA) announced an agreement to send children to Italy from 2009. In 2010, there were 116 adoptions.
c Figures for 2005–09 are those provided by the CCAA to The Hague Special Commission of June 2010. These include Singapore – see Selman (Reference Selman, Gibbons and Rotabi2012a: table 1.5) for full statistics from CCAA.
Source: Annual totals are calculated from data on adoptions from China in statistics provided by the six countries – see Appendix 1. Overall totals are based on data from fifteen countries.
The reasons for the reduction in the number of children sent have been discussed by many writers (e.g. Dowling and Brown, Reference Dowling and Brown2009; Selman, Reference Selman, Wrobel and Neil2009a, Reference Selmanb; Smolin, Reference Smolin2011; Stuy, Reference Stuy2009). These include the aftermath of the Hunan scandal (Meier and Zhang, Reference Meier and Zhang2008), a rising interest in domestic adoption, concern over adoptions by single women and same sex couples and a sense that China's capacity to care for its own children was being compromised.
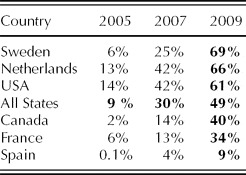
The rise in numbers in 2010 may prove temporary, but reflects a continuation of changes in the characteristics of the children sent, with more older children and a growing number with special needs (see Table 4). This in turn has affected the sex-ratio with girls no longer an overwhelming majority. China Central Adoption Authority figures submitted to The Hague Special Commission of 2010 show that the proportion of female infants placed fell from 95 per cent in 2005 to 74 per cent in 2009.
Proportion of children from China with ‘special needs’

Source: CCAA submission to the Hague Special Commission of 2010.
The decline from 2005 to 2009 in numbers sent is almost entirely due to a reduction in the number of young girls offset by a modest increase in the number of older children, including boys, with special needs. The increase in 2010 seems to reflect a further increase in older special needs placements, and the future of Chinese adoption seems likely to be through such placements. China is, therefore, following the pattern of other countries which have continued intercountry adoption despite being able to place infants with domestic adopters. For some years, Brazil has sent only older or special needs children for intercountry adoption and a similar pattern can be found in several Eastern European countries, including Latvia, Lithuania and Poland (Selman, Reference Selman2010). In March 2011, the China Central Adoption Authority changed its name to CCWAA (China Centre for Children's Welfare and Adoption Affairs), and announced that single women may apply to adopt special focus children listed on their Special Needs System.
Russia
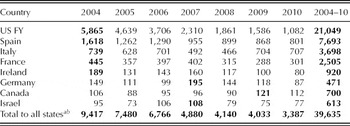
Since 1992 Russia has sent over 110,000 children for intercountry adoption. Annual numbers peaked at over 9,000 in 2004. This decline occurs earlier and more rapidly than in China, with no sign of slowing. Between 2004 and 2010 the annual number of children sent fell by 64 per cent and the number to the USA fell by 81 per cent. Table 5 shows the reduction in numbers for eight countries which received a total of 600 or more children between 2004 and 2010. One reason for this rapid decline was the problems arising over some children placed in the USA.
Adoptions from Russia 2004 to 2010: eight countries ranked by number of children received in 2004 (peak year in bold)

Notes: a Other countries receiving a total of 100 or more children from Russia in this period were Belgium, Finland, Malta, Sweden, Switzerland and the UK.
b Adoptions to Austria (fourteen plus in 2004) and Slovenia (sixteen between 2005 and 2009) are not included in totals.
Source: Annual totals for individual states are those provided by the central authorities of the eight countries listed: Overall total for each year is an aggregate for all receiving states named in Table 1 − see Appendix 1.
Russia has always sent a number of institutionalised children with significant health problems. In the past decade, a number of adoptive parents in the USA have been found guilty of killing their adopted child. Russia required re-accreditation of all US agencies and in 2009 announced that it had suspended the adoption of Russian children by American families after Artyom Savelyev, a seven-year-old adopted Russian boy, was rejected by his American mother and sent back alone to Russia (Abrams, Reference Abrams2010; Rotabi and Heine, Reference Rotabi, Heine and 2010; Selman, Reference Selman, Gibbons and Rotabi2012a).
Ethiopia
Since 2003, Ethiopia has experienced a rise in intercountry adoptions which has been as dramatic as the declines described in the previous country studies (Dambach and Selman, Reference Dambach and Selman2011). In seven years, the number of children rose by more than 500 per cent from under 1,000 to over 4,500 (Table 6). The increase was particularly dramatic in the US where the annual number of children received rose from 135 in 2003 to 2,513 in 2010.
Adoptions from Ethiopia 2003 to 2010: countries ranked by number of children received in 2009

Notes: a The total includes twelve other countries which have received children from Ethiopia in this period.
b Adoptions to Austria not included, the Austrian agency (Families for You), which received over seventy children between 2004 and 2006, has been removed from the approved list.
Source: Annual totals for individual states are those provided by the Central Authorities of the seven countries listed in the table: Overall total for each year is an aggregate for nineteen countries receiving children in this period.
To some extent, this cushioned the United States against the impact of closing Guatemala, but the cost to Ethiopia has been great. In principle, Ethiopia has a system of accrediting overseas agencies. Rotabi (Reference Rotabi2010) notes that there are now more than twenty US agencies operating in Ethiopia with major questions clouding the activities of some (see also Mezmur, Reference Mezmur2009b, Reference Mezmur2010). The expansion of numbers has been so rapid that this has had little impact even though some agencies have had authorisation withdrawn, as have a number of the orphanages to which agencies had been linked (US Department of State, 2011b). In 2011, Ethiopia finally acknowledged its inability to control the rapid expansion and announced that it would drastically reduce the number of intercountry adoptions being processed after 8 March (US Department of State, 2011a).
Adoptions from Latin America: changes in Guatemala and Haiti
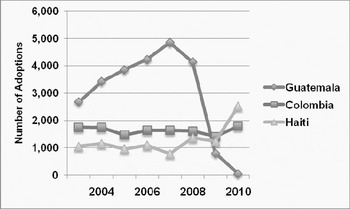
Briefly in the 1980s Latin America seemed likely to match Asia as a primary source with rising numbers of children placed from Colombia, Mexico, Brazil and El Salvador. Colombia has consistently been in the top ten sending countries and for a time Guatemala seemed likely to match China and Russia. In recent years, Haiti has emerged as a major source, albeit surrounded by controversy as the aftermath of its earthquake led to a doubling of numbers. Figure 4 shows the changes in these three countries.
Intercountry adoptions to Columbia, Guatemala and Haiti, 2003 to 2010.

Guatemala
The reduction in numbers from China and Russia affected most intercountry adoption receiving countries. The US was protected against these changes by a rise in the number of children from Guatemala. By 2007, 98 per cent of Guatemalan adoptions were to the US (Selman, Reference Selman2009b: 586) in spite of known problems which stopped adoptions to other countries. Following ratification of The Hague Convention, the US State Department finally acknowledged that there was widespread corruption and Guatemala imposed a moratorium resulting in the number of adoptions in the US falling from 4,728 in 2007 to fifty-one in 2010 (Selman, Reference Selman2011: Table 7). Corruption in Guatemala has been documented in detail by Bunkers et al. (Reference Bunkers, Groza and Lauer2009) and by Rotabi (Reference Rotabi2010), who has linked the decline in numbers to the remarkable rise in US adoptions from Ethiopia.
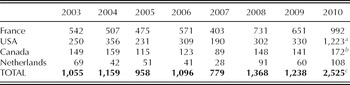
Adoption from Haiti 2003 to 2010: four countries receiving most children in 2009 and 2010

Notes: a US Fiscal year data – includes 1,090 ‘emergency visas’.
b Official total from Citizenship and Immigration Canada (CIC) who had had earlier (2010b) stated that 203 children had arrived in Canada. This is the number used by ISS in their review of Haiti (Dambach and Biglietto, Reference Dambach and Baglietto2010).
c Total for 2010 includes thirty adoptions to Belgium and Switzerland; ISS also reports sixty-two adoptions to Germany and fourteen to Luxembourg, raising total to 2,601 (Selman, Reference Selman2011).
Source: Tables 1 and 2 in Selman (Reference Selman2011).
Haiti
Following the earthquake of January 2010 (Selman, Reference Selman2011), Haiti replaced Guatemala as the Latin American country sending most children for intercountry adoption. This is however likely to be a temporary phenomenon.
The doubling of adoptions from Haiti was perhaps inevitable given the number of children ‘in the pipeline’. The wider reaction against the hasty rescue of children, further criticised in the detailed review by International Social Services (Dambach and Biglietto, Reference Dambach and Baglietto2010) along with the process of ‘expediting’ such adoptions has led to a call by the Hague Conference (2010) for agreement by contracting states that this should not happen again.
The number of children entering the USA from Haiti fell to thirty-three in fiscal year 2011 and the number to France to thirty-four. Global numbers are likely to remain low until Haiti has ratified the Hague Convention and established new safeguards against trafficking (Selman, Reference Selman2011).
Other key countries in the decline of intercountry adoption
The 36 per cent reduction in numbers of children sent for intercountry adoption worldwide from 2004 to 2010 is largely the result of the dramatic declines in China, Russia, Korea and – from 2008 – Guatemala, offset by the rapid rise in Ethiopia and Haiti, which seems to have been reversed in 2011.
Other countries have also experienced marked changes in this period.
Between 2004 and 2007, the number of children sent from Vietnam trebled, but persistent problems (ISS, 2009) led to a suspension of adoptions by the USA in 2008. Another Asian country beset by problems is Nepal (UNICEF and Terre Des Hommes, 2008; Degeling, Reference Degeling2010) where a doubling of adoptions from 2003 to 2006 was followed by a moratorium in 2008 as widespread corruption became evident. Adoptions virtually ceased in 2009 but resumed in 2010. India has also had much adverse publicity (Smolin, Reference Smolin2005; Dohle, Reference Dohle2008) and annual numbers sent – already very low per capita – have continued to fall (Selman, 2012b, Table 12). The Indian Central Adoption Resource Authority (CARA) has announced plans to increase numbers from 2012, albeit with limits on adoptions of children without special needs. The number of adoptions from Taiwan doubled between 2004 and 2009, but this country is almost as prosperous as Korea and is unlikely to prove a major source in future years. Other Asian countries have experienced little change in level – with a slight rise in Philippines and slight fall in Thailand, which has announced its intention to concentrate on special needs adoptions.
The proportion of intercountry adoptions from Europe has fallen from over 30 per cent in 2003–4 to 20 per cent in 2010. Adoptions from Romania and Belarus have virtually ended and the number from Bulgaria has fallen substantially (Selman, Reference Selman2010). Numbers have also fallen from Kazakhstan, classified as European by many countries, including the USA.
The potential for adoptions from Africa is clearly great. However few countries have been willing to follow the path of Ethiopia and numbers have fallen in Liberia and Madagascar. If Nigeria and the Democratic Republic of Congo (Kinshasa) were to send children on the scale of Ethiopia, the downward trend might be reversed, but currently a decline in numbers from Ethiopia seems more likely to lead to a reduction in African adoptions (Dambach and Selman, Reference Dambach and Selman2011).
What lies ahead?
This final section considers possible developments in intercountry adoption in the twenty-first century. Will numbers continue to decline until eventually it ends? Will the pattern of increase from 1995 to 2004 resume with a sounder structure to provide new hope for children without families in a globalised world? The annual numbers of children moving in 2010 was 29,000, a level well above that of the 1980s. A third scenario is that this level will continue so that the current million estimated to have been adopted internationally since the Second World War (Selman, Reference Selman2012b) could double by the end of this century.
Changes in the characteristics of children sent
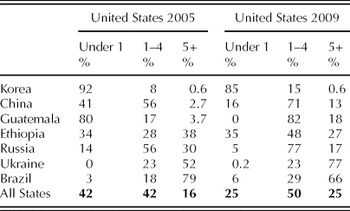
Alongside the change in numbers and origins of children moving for international adoption, there has been a significant change in the characteristics of the children being sent for intercountry adoption. We must consider not only whether the decline of the last six years could or should be reversed, but also whether the nature of intercountry adoption as a phenomenon may change as has arguably occurred in respect to domestic adoption. Children involved in local adoption in the USA or UK today are very different from those adopted fifty years ago. The growth of special needs adoption in China is discussed above. This was seen to interact with the age of children placed and a reduction in the number of infants placed. Table 8 shows changes in age of children arriving in the US.
Age of children adopted in the US from selected states of origin, 2005 and 2008, ranked by proportion aged five or more in 2005

Source: US submission to Hague Special Commission of June 2010.
The differences between sending countries are striking, but of equal interest is the consistency of the move towards the placement of older children and fewer infants. Much of this is the result of fewer young infants being available for adoption rather than a major increase in the number of older and special needs children being sent. Nonetheless, it suggests a changing perception on the part of sending countries as to which children are best served by intercountry adoption.
The proportion of children aged five-plus rose further in 2009 and 2010, as a result of the moratorium on Guatemala and the CCCWA Special Needs programme. Similar changes have been noted in EurAdopt agencies, where the proportion of children aged under one fell to 22 per cent in 2010. In Italy, the only major receiving country to have experienced rising numbers of adoptions since 2004, a majority of children adopted have been five years or older and in 2010 15 per cent of adopted children had particular or special needs (Commission for Intercountry Adoptions, 2011).
We saw that in China the change in age of children was accompanied by a change in gender. The earlier pattern of Chinese adoptions being primarily female infants abandoned as a result of social pressures associated with the One Child Policy was clearly shifting. The gender imbalance is often attributed to wider issues of son preference in China and this has led to an expectation that a similar pattern may be found in other Asian countries where sex-selective abortion is known to be practiced (Smolin, Reference Smolin2011). This is true of India where three-quarters of children placed for intercountry adoption are girls, but in Korea the pattern is reversed with a large majority of children placed in recent years being young boys. This relates to a preference for girls in domestic adoption in that country.
Continuing problems – should intercountry adoption cease?
Commentators concerned at the continuing evidence of illicit activities in intercountry adoption and growing evidence of the malign influence of a market in children as numbers placed fall while demand remains high have argued for much stronger regulation of the practice. The Hague Special Commission of June 2010 devoted a full day to the issue of ‘trafficking’.
David Smolin, who discovered that his two adopted daughters from India had been stolen, has written extensively on this topic (Smolin, Reference Smolin2006, Reference Smolin2007a, Reference Smolinb, Reference Smolin2010a) and contributed to The Hague debate (Smolin, Reference Smolin2010b). Another contributor to The Hague debate was Ethiopian law student, Benyam Mezmur, who addressed trafficking in intercountry adoption in Africa (Mezmur, Reference Mezmur2010), a topic on which he has written extensively (Mezmur, Reference Mezmur2009a, Reference Mezmurb).These concerns are well summarised in the writings of Graff (Reference Graff2008) who has spoken of intercountry adoption as ‘the lie we love’.
Could numbers rise again?
In contrast, a growing number of intercountry adoption supporters have argued that the current ‘crisis’ should be seen as a period of transition and that numbers could (and should) rise again. In a special edition of the New York Law School Review, Elisabeth Bartholet (Reference Bartholet2011) and Richard Carlson (Reference Carlson2011) argue that, if reformed, intercountry adoption could increase and form a key component of globalised child welfare, just as adoption has been seen as the answer for abandoned and abused children in the US and UK.
A new campaign, Both Ends Burning, was launched in 2010 by Craig Juntunnen, father of three adopted Haitian children and author of a book of the same name (Juntunnen, Reference Juntunnen2009). His campaign is described as ‘a movement to create a new system of international adoption so the world's orphaned and abandoned children can grow up in loving families’. Juntannen's focus is unnecessary delays imposed by adoption bureaucracies.
If numbers continue to decline, it seems likely that an increasing number of childless couples will look to the new reproductive technologies for a solution to their infertility and in particular to international surrogacy (Cahn, Reference Cahn2009). There has been a notable rise in reproductive tourism in India (Dasgupta and Dasgupta, Reference Dasgupta, Dasgupta, Chavkin and Mather2010) and a recent case of the use of surrogates in the Ukraine (Watson, Reference Watson2011). Surrogacy was discussed at The Hague Special Commission of June 2010, which decided that it would be inappropriate to include it in the remit of the Convention on Intercountry Adoption but recommended that the Hague Conference ‘should carry out further study of the legal . . . issues surrounding international surrogacy’ (Hague Conference, 2010: s. 26).
Conclusion
Demographers have a patchy record when it comes to predictions. Global numbers fell from 1987 to 1989 after a period of some 30 years steady growth from the time of the Korean War. Writing in 1991, Altstein and Simon (Reference Altstein and Simon1991) saw the reversal of the trend in 1990 as a temporary phenomenon due to Romania. Their view that wide-scale intercountry adoption was waning seemed justified as numbers fell in 1991 and 1992. As we know now, the prediction proved wrong as adoptions from China and Russia led to a doubling of numbers between 1995 and 2004. In 2010, global numbers fell to the lowest level since 1997, but were still 50 per cent higher than estimates for 1987.
Adoptions from China seem to be leveling out at around 5,000 a year with a growing proportion of children having special needs. The Ethiopian boom seems likely to have ended, but the rest of Africa shows steady growth and the revival of adoptions from Vietnam and Nepal suggest that Guatemala may once again become a source of children at least for the United States.
This suggests that intercountry adoption may continue over the next decade at a level akin to the mid-1990s – that is 20,000–30,000 a year – with an increased emphasis on the placement of older children with special needs. The large increase in numbers sought by Bartholet and Juntunnen seems unlikely unless the market forces which have so clearly operated in the last decade prevail. The alternative prediction of a final end to intercountry adoption as poorer countries react against the corruption and distortion engendered by market forces also seems premature. In a longer historical view, intercountry adoption on the scale experienced in the mid-2000s may be viewed as mistaken, like the now repudiated imperial child migrant schemes from the UK (Parker, Reference Parker2008). If this proves to be the case, one can only hope that intercountry adoption is replaced by a wider use of adoption and fostering within poorer countries so that the twenty-first century does not see a growth in the number of children trapped in institutions with all the negative consequences we now understand all too well.
Appendix: Sources of data on receiving states
Data on intercountry adoptions for receiving states have been collected from the central authorities of the twenty-three countries used. Some data were provided for the 2005 and 2010 Hague Special Commissions which requested information on adoptions for 2000−04 and 2005−09 respectively on a standard form sent to all contracting states. The responses are available at http://www.hcch.net/index_en.php?act=conventions.publications&dtid=32&cid=69
However, most central authorities publish data annually and much of these are available on the internet. These are the basis for the statistics presented in the charts and tables for this article. In the case of sending countries I have used the receiving state data to make estimates, as many of the major states of origin do not provide regular statistics. Where good quality statistics are provided over a long period – as in the case of Korea – I have used these.
The top seven receiving countries are listed below in descending order of number of children received 2000−10 (as in Table 1) with source of data and web-site for latest available year.
United States
Source: US Department of State: http://adoption.state.gov/
Data for 2011 available in form of Annual Report at: http://adoption.state.gov/content/pdf/fy2011_annual_report.pdf The 2010 Annual Report may be accessed by changing date in above URL.
Spain
Source: Ministerio de Sanidad, Politica Social e Igualdad: http://www.msps.es/politicaSocial/familiasInfancia/adopciones/home.htm
Data for 2006−10 are available as a powerpoint presentation at: www.msps.es/politicaSocial/familiasinfancia/docs/Datos_adopcion_internacional.ppt
France
Source: Mission de l'Adoption International L'Agence Française d'Adoption: www.adoption.gouv.fr
2011 Statistics are available at: http://www.diplomatie.gouv.fr/fr/IMG/pdf/12_Decembre_2011_cle417759.pdf
Italy
Commissione per le Adozioni Internazionali: http://www.commissioneadozioni.it
Data for 2000−11 available at: http://www.commissioneadozioni.it/it/per-una-famiglia-adottiva/rapporto-statistico.aspx
Canada
Source: Citizenship and Immigration Canada (CIC): http://www.cic.gc.ca/english/immigrate/adoption/index.asp
Statistics for 2002−10 are available at: http://www.coeuradoption.org/wiki/doku.php?id=pays:canada
The Netherlands
Source: Ministry of Security and Justice (Ministerie van Veilgheid en Justitie): http://www.rijksoverheid.nl/ministeries/venj
Statistics for 2006−10 (Adoptie Trends en Analyse) available from Hans Vrooman at: j.vroomans@minjus.nl
Sweden
Source: Swedish Intercountry Adoptions Authority (Myndigheten för internationella adoptionsfrågor (MIA)): http://www.mia.eu/english/first.htm
Data on authorised organisations up to 2011 are available at: www.mia.eu by clicking on ‘Statistik’; or by contacting Lovisa Kim at: lovisa.kim@mia.eu
Other countries
For data sources for the other states states listed in Table 1 footnote, please contact the author at pfselman@yahoo.co.uk
Data for seventeen receiving countries from 2000/1 to 2008/9 are available from the Australian web-site AICAN: http://www.aican.org/statistics.php?region=0&type=receiving