Introduction
The Burgess Shale, the most famous example of a Cambrian Lagerstätte, represents one of the best fossil deposits for exploring the diversity of life in the aftermath of the Cambrian Explosion (Briggs and Fortey Reference Briggs and Fortey2005). The site provides vital information for evolutionary biology, in particular regarding the early evolution of body plans, as well as for understanding the structure and functioning of Cambrian animal communities (Conway Morris Reference Conway Morris1986). However, despite some recent progress (Caron and Jackson Reference Caron and Jackson2006, Reference Caron and Jackson2008), we know very little about how the Burgess Shale biota varies in time and space, even though about a dozen new Burgess Shale assemblages have been discovered in the Canadian Rockies in the last three decades (Collins et al. Reference Collins, Briggs and Conway Morris1983; Caron et al. Reference Caron, Gaines, Mãngano, Streng and Daley2010; Caron et al. Reference Caron, Gaines, Aria, Mãngano and Streng2014). These localities offer great opportunities to address questions related to potential paleoenvironmental and ecosystem variations across Burgess Shale communities through space and time.
Discovered in 1983, the Tulip Beds on Mount Stephen boast one of the most abundant and richest assemblages of Burgess Shale fossils outside the Walcott Quarry (Collins et al. Reference Collins, Briggs and Conway Morris1983; O'Brien and Caron Reference O’Brien and Caron2012; O’Brien et al. Reference O’Brien, Caron and Gaines2014). Previous work described small subsets of the Tulip Beds assemblage, including sponges (Rigby and Collins Reference Rigby and Collins2004), dinocarids (Daley and Budd Reference Daley and Budd2010), leanchoiliids (García-Bellido and Collins Reference García-Bellido and Collins2007), and two new taxa unique to this locality, Siphusauctum gregarium (O’Brien and Caron Reference O’Brien and Caron2012) and Nereocaris exilis (Legg et al. Reference Legg, Sutton, Edgecombe and Caron2012). However, to date, a complete description of the community composition and structure at this locality and its relationship to the Walcott Quarry community have been lacking. Although the position of the Tulip Beds relative to the Cathedral Escarpment is unclear, it is interpreted as more distal to the escarpment than the Walcott Quarry and deposited in a low energy environment (O’Brien et al. Reference O’Brien, Caron and Gaines2014). In contrast, the Walcott Quarry lies within the younger Walcott Quarry Member of the Burgess Shale Formation (Fletcher and Collins Reference Fletcher and Collins1998; Caron and Jackson Reference Caron and Jackson2006), in direct contact with the Cathedral Escarpment of the Cathedral Formation. Here, we examine the diversity and ecological structure of the Tulip Beds locality for the first time and compare it with the Walcott Quarry to test for ecological, depositional, and stratigraphic variations. We then compare our results with patterns in other Burgess Shale-type localities, in particular from the Chengjiang biota, in order to detect wider paleoecological patterns.
Materials and Methods
Fossil Assemblages
The Tulip Beds material was collected from two stratigraphically related sub-localities, the Quarry site and the Talus site, separated from each other by only a few hundred meters (O’Brien et al. Reference O’Brien, Caron and Gaines2014). The fossil material from both sub-localities is treated here as a single time-averaged bulk assemblage of unknown duration representing as much as 12 m of strata (see also O’Brien et al. Reference O’Brien, Caron and Gaines2014). The Tulip Beds collection comprises 2017 slabs that are housed at the Royal Ontario Museum (ROM). The slabs range in size from a few square centimeters to ~2900cm2. Specimen abundance ranges from one to 169 individuals (i.e., ROM 62439—monospecific Undet. Taxon TB-B) per slab, and diversity ranges between one and 17 taxa (i.e., ROM 62283) per slab.
Nomenclature and Terminology
Taxa or taxon is used to refer to the lowest taxonomic rank in the datasets. Usually this is the genus level, but there are exceptions, as outlined below. Phylum or phyla (at the Total Group level) is used to refer to the highest taxonomic rank analyzed here. Nomenclatural abbreviations follow recommendations in Bengtson (Reference Bengtson1988): relationship of a new taxon to a named taxon (aff.), provisional identification (cf.), uncertainty in the identification (?), at least one species is present for the genus (sp.), and where two or more species are present within a particular genus (spp.). The species name is used only when one species has been identified. When the specimens are indeterminable (Indet.) there are not enough morphological features to identify the taxon to a lower taxonomic level. When the specimens cannot be attributed to a known taxon they are designated as undetermined (Undet.), however the material suggests a distinct taxon. These taxa are named to include an affinity when it can be determined (e.g., Undet. Arthropoda).
The terms “core species” and “bedding assemblage” are used throughout. Core species represent the five most abundant species present in an assemblage (following Caron and Jackson Reference Caron and Jackson2008). A bedding assemblage represents a fossil assemblage preserved in a single burial event (see Caron and Jackson Reference Caron and Jackson2006, Reference Caron and Jackson2008). We use the term “endemic” to refer to taxa that occur only at the Tulip Beds or Walcott Quarry but not both, and “shared” refers to taxa that are at both localities. These terms are not used with any implication of whether these taxa may be found at any other Burgess Shale-type deposits locally, regionally or globally.
Data Collection
Taxa
O’Brien et al. (Reference O’Brien, Caron and Gaines2014) described the techniques used to identify and photograph the fossils. Taxa were identified to the species level where possible; however, because many taxa at the Tulip Beds may represent new species of known genera and to avoid any effects of taxonomic over splitting (following Dornbos and Chen Reference Dornbos and Chen2008), our final data set only includes genus level taxa (Supplementary Appendix 1). To allow for a direct comparison between the Tulip Beds and the Walcott Quarry, the identification and count of individual specimens follows the same methods as Caron and Jackson (Reference Caron and Jackson2006, Reference Caron and Jackson2008). Where specimens were not identifiable to the generic level, a higher taxonomic level was used (e.g., Indet. agnostid). Indeterminate specimens that could not be definitively placed in any one genus were excluded from the final dataset (e.g., individual carapaces of bivalved arthropods that could not be identified to genus level). Taxa were primarily identified from complete specimens; however, some taxa are represented only by isolated elements (e.g., A. canadensis), commonly with multiple identifiable parts (e.g., Hurdia sp. claws and carapace elements). These taxa were included based on the minimum estimation of their representation in the assemblage (i.e., the number of carapaces or half the number of claws, whichever was greater, for Hurdia, and half the number of claws for Anomalocaris). For other taxa generally represented by complete specimens, counts of their isolated elements were excluded; exceptions were the algae/cyanobacteria and Tubulella flagellum, which represents possible cnidarian polyp thecae, (Van Iten et al. Reference Van Iten, Zhu and Collins2002) that are difficult to identify as complete individuals. This taxon was instead scored as present or absent on a slab, regardless of the number of pieces present. As a result, the abundance data (based on slab occurrences) for algae/cyanobacteria and Tubulella flagellum are not directly comparable to abundance data for other taxa but provide minimum estimates of the numbers of individuals. Specimens indeterminable to a taxonomic group were removed from the data set. To avoid potential identification errors and inflated taxonomic lists, potential new taxa known only from one specimen were excluded from the final data set, with the exception of Undet. Porifera TB-A, because it was identified and described by Rigby and Collins (Reference Rigby and Collins2004) as a new taxon although it remains unnamed, and Undet. Dinocarid TB-A, as it was recorded from claws on two separate slabs, although its count has been halved. In total, 21 potentially new taxa were included in the Tulip Beds dataset (Supplementary Appendix 1).
Each taxon was assigned to its relevant phylum, taken broadly to include potential stem group members, following the most recent literature. Undescribed taxa were assigned to phyla when there was confidence in their affinities at that taxonomic level (e.g., Undet. Porifera TB-A was assigned to Porifera). When affinities were unclear the taxa were assigned to the category “unknown.” In this paper, we tentatively grouped the controversial animal Echmatocrinus within echinoderms (Sprinkle, Reference Sprinkle1973,Reference Sprinkle1976; Sprinkle and Collins, Reference Sprinkle and Collins1998) while realizing that a cnidarian affinity has received strong support (Conway Morris, Reference Conway Morris1993, Ausich and Babcock, Reference Ausich and Babcock1998, Reference Ausich and Babcock2000).
Ecological data
All taxa were assigned to their relevant ecological groups based on published data and following similar categories used in previous studies (Conway Morris Reference Conway Morris1986; Caron and Jackson Reference Caron and Jackson2008; Zhao et al. Reference Zhao, Zhu and Hu2010, Reference Zhao, Hu, Caron, Zhu, Yin and Lu2012) for ease of comparison. Ecological categories are broken into: 1) mode of life (endobenthic, epibenthic, nektobenthic, nektonic, planktonic or unknown), 2) motility (mobile, sessile, or unknown) and, 3) feeding type (suspension, carnivory, deposit, primary productivity, herbivory, or unknown). Where ecological information could not be established or remains speculative, an “unknown” category was used in each group (Supplementary Appendix 1).
Walcott Quarry data
The dataset for the Walcott Quarry is primarily based on the ecological data matrix published by Caron and Jackson (Reference Caron and Jackson2008) (Supplementary Appendix 2). The original data set was modified in the following ways: the data were reduced to a single induced time-average assemblage in most analyses (except correspondence analysis), the taxonomic list was revised to allow for taxonomic descriptions made since the original publication, taxa now thought to be misidentified (J.B. Caron, personal observation) were removed, taxa were analyzed at the generic level rather than at the species level, and undescribed taxa were treated as outlined above.
Statistical analyses
All statistical tests and plots were run in R (V 1.4) (R Core Development Team 2012), using the packages “vegan” (Oksanen et al. Reference Oksanen, Guillaume Blanchet, Kindt, Legendre, Minchin, O’Hara, Simpson, Solymos, Stevens and Wagner2011), “gplots” (Warnes Reference Warnes2011), and “venndiagram” (Chen Reference Chen2012). Microsoft Excel was used for data handling (Microsoft 2007). In order to standardize or make comparisons between the datasets, abundance data are presented as absolute abundance, log abundance or proportional abundance, depending on the analysis. Proportional abundances were calculated by dividing the absolute abundance of a taxon, phylum, or ecological mode by the total number of specimens for that locality. Scaled Venn diagrams are used to illustrate the variation in overall sample sizes of the Tulip Beds and Walcott Quarry datasets, as well as the overall taxonomic diversity and number of shared taxa between the two datasets. To examine the effects of sample size on diversity of the three most diverse and abundant phyla/groups at each of the localities (Arthropoda, Porifera, and unknown), rarefaction analyses were preformed on both the complete Tulip Beds and Walcott Quarry datasets, as well as on subsets of the datasets.
Whittaker plots were used to examine the interplay between abundance and diversity, as well as the evenness/dominance of taxa, at each locality. A linear regression (Ordinary Least Squares) was fitted to the relative abundance data, and the slope of this line used as a relative indication of evenness. To understand the distribution patterns of the datasets, the Akaike Information Criterion (AIC) was used to assess which distribution best described the data. The best fitting distribution line was added to the plots. Correspondence analysis was used to visualize the relationship of the complete Tulip Beds assemblage to the 26 most abundant bedding assemblages of the Walcott Quarry (Caron and Jackson Reference Caron and Jackson2008) (Supplementary Appendix 3).
The raw numbers of specimens of individual taxa on each slab were tested for quantitative evidence of clustering, that is, whether individuals within certain taxa, or taxa in certain phyla or ecological strategies, are grouped together on slabs more often than expected (Supplementary Appendix 4). Similar data was not available for the Walcott Quarry. Kruskal Wallis tests were used to test for differences in the variances of the number of times specimens of the same taxon occur on the same slab, between subsets (grouped by taxa, phyla or ecological strategy). Mann Whitney Wilcoxon tests were used to generate pairwise comparisons testing how these subsets differ from each other in terms of specimen clustering. To examine the potential effects of sample size on these analyses, the residuals of the regression line (OLS) are calculated by plotting the mean number of specimens per slab against total abundance; each bar on the residual plot represents a single taxon. These taxa were grouped together by phylum, ecological tier, degree of motility, or feeding strategy to test for significant clustering. Trophic tiering is used herein to refer to the position of a taxon relative to the sediment water interface. This is similar to the usage of tiering in Bambach et al. Reference Bambach, Bush and Erwin2007 rather than tiering sensu stricto (Bottjer and Ausich, Reference Bottjer and Ausich1986). Clustering due to high abundance was factored out by using residuals.
To test Caron and Jackson’s (Reference Caron and Jackson2008) hypothesis that the abundance of a taxon at one locality could be a reasonable predictor of its recurrence and potential widespread geographic distribution, the abundances of the taxa occurring at both localities (i.e., shared taxa) were regressed against each other. Pearson’s r 2 was used to quantify how well the abundance at one locality predicts the abundance at the other locality. A Pearson’s correlation test was used to establish whether correlations in abundances were statistically significant. These analyses were performed for the complete shared taxa data set and for subsets of this dataset with minimum combined abundances of ten, 50, 100, 500, and 1000. Similar analyses were also performed for the ecological groups of shared taxa.
Results
Diversity and Abundance of Taxa at the Tulip Beds
Diversity
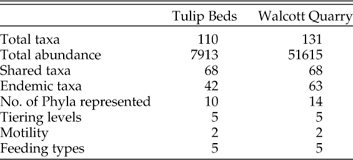
The Tulip Beds assemblage is diverse, with 110 taxa distributed over ten phyla (not including Algae/Cyanobacteria and unknown taxa) based on a count of 7913 identified specimens (from ~10,000 fossils) (Table 1, Figs. 1–3). Twenty one new and unnamed taxa represent 19% of the taxa at the Tulip Beds. The rarefaction curve for the Tulip Beds has not yet reached an asymptote, suggesting that additional species may be recovered with additional sampling (Fig. 4). Arthropoda represents the most diverse group in the Tulip Beds followed by Porifera, Algae/Cyanobacteria, taxa of unknown affinity and Brachiopoda (Fig. 3A).
Scaled Venn diagrams of the Tulip Beds and Walcott Quarry assemblages. A) Total number of specimens illustrating the sample sizes, B) Number of taxa found in each assemblage.

Sample of taxa from the Tulip Beds. A, Laenigma aff. striatum (ROM 62326), B, Waphia insolens (ROM 62327), C, Choia carteri (ROM 62328), D, Petaloptyon danei (ROM 53556), E, Vauxia gracilenta (ROM 62329.3), F, Wapkia elongata (ROM 53544), G, Dictyonina sp. with setae preserved (ROM 62330), H, Ptychagnostus praecurrens in an empty Selkirkia columbia tube (ROM 62331.1-2), I, Odontogriphus omalus (ROM 62338), J, Perspicaris sp. (ROM 62332), K, Dinomischus isolatus (ROM 62333), L, a cluster of Tubulella flagellum (ROM 62334), M, Habelia? brevicauda (ROM 62335), N, Burgessochaeta sp. (ROM 61831.2), O, Amplectobelua stephenensis claw (ROM 59496), P, Poliella prima (ROM 62336), Q, Branchiocaris sp. (ROM 62337), R, pair of Laggania cambria claws (ROM 59596), S, four specimens of Siphusauctum gregarium (ROM 61423). Scale bars: 20 mm (L), 10 mm (A–F, I–J, M, O, Q-S), 5 mm (G, H, K, N), 2.5 mm (P).
Comparison of the relative diversity (A) and abundance (B) per phylum between the Tulip Beds (bars with no outline) and Walcott Quarry (outlined bars). A, Arthropoda represents the most diverse group in the Tulip Beds with 38.2% of the proportional diversity (42 taxa), followed by: Porifera (19.1%), Algae/Cyanobacteria (10.0%), taxa of unknown affinity (9.1%) and Brachiopoda (6.4%). The remaining seven phyla, spread over 19 taxa, each individually represent less than 5% of the proportional diversity, but collectively account for 17.3% of species. B, Taxa of unknown affinity dominate in terms of abundance, accounting for 48.9% of the total abundance, followed by Algae/Cyanobacteria (13.9%), Arthropoda (13.8%), Porifera (11.4%), and Cnidaria (5.1%). The remaining seven phyla comprise just 6.9% of the proportional abundance.
Rarefaction curves for the Tulip Beds and Walcott Quarry. Rarefaction curves for the full dataset (Supplementary Appendix 3) from the Tulip Beds and Walcott Quarry assemblages (A) and for subsets of the same dataset: Arthropoda (B), Porifera (C), and unknown affinity (D). Error bars represent the standard deviation of the replicate (1000) means. The insets indicate a close up of their respective plots.
The number of taxa, specimens, phyla, and ecological modes (tiering levels, motility and feeding types) represented in both the Tulip Beds (Supplementary Table 1) and the Walcott Quarry (Supplementary Table 2, modified from Caron and Jackson Reference Caron and Jackson2008). Additional to the phyla are categories of algae/cyanobacteria and unknown. Unknown is also a category in each of the ecological modes.
Abundance
Taxa of unknown affinity account for about half the total number of specimens, followed by Algae/Cyanobacteria, Arthropoda, Porifera, and Cnidaria (Fig. 3B). The core species comprise 57.7% of the total abundance (Table 2). The two most abundant taxa (Undet. Taxon TB-A and S. gregarium) are responsible for 41.3% of the total abundance and 84.3% of the abundance of taxa with unknown affinity. Despite Arthropoda being the most diverse phylum, there are only three arthropods among the top 25 most abundant taxa: Anomalocaris canadensis (ranked sixth, with 270 specimens, representing 3.4% of all specimens), Indet. agnostid (ranked eighth, 186 specimens, 2.4% of specimens), and Canadaspis sp. (ranked 17th, 81 specimens, 1.0% of specimens). The slopes of the linear regression lines fitted to the Whittaker plots are shallow when all taxa are used (−0.025), or when only Arthropoda are included (−0.058), but steeper for Porifera (−0.242) and Unknown (−0.343) (Fig. 5B–E). Shallow slopes indicate greater evenness and steeper slopes indicate greater dominance in the datasets, that is, the presence of one or a few species with particularly high numbers of individuals. A log normal abundance model best fits the distribution of the complete assemblage (Fig. 6A), indicating a well sampled assemblage with few very abundant taxa and few very rare taxa (Tokeshi Reference Tokeshi1993).
Whittaker plots showing log10 abundance vs. rank abundance, for the complete Tulip Beds (grey) and Walcott Quarry (black) datasets (A), and three of the most abundant phyla in the Tulip Beds (B), and in the Walcott Quarry (C). Lines represent linear regressions (OLS), with slopes indicated.
Whittaker plots showing relative abundance vs. rank abundance, for the complete Tulip Beds (grey) and Walcott Quarry (black) datasets (A), and three of the most abundant phyla in the Tulip Beds and Walcott Quarry: Arthropoda (B), Porifera (C) and unknown affinity (D). Lines for A represent the best fitting distribution models. Lines for B–D represent linear regressions (OLS).
Core species of the Tulip Beds and Walcott Quarry.
CS=Core species, #=number of specimens in the assemblage, %=percentage of the total abundance.
Comparisons with the Walcott Quarry
The Tulip Beds shares 68 taxa with the Walcott Quarry (endemic: Tulip Beds 43, Walcott Quarry 63), and although the sample size of the Walcott Quarry is much greater than that of the Tulip Beds (Fig. 1), the diversity patterns per phylum are similar (Fig. 3A). Rarefaction curves also suggest similar overall diversity, although the potential diversity of the Tulip Beds may be higher (Fig. 4A). Both localities have log normal distributions of diversity, with similar evenness, as indicated by the slopes of the Whittaker plots (Tulip Beds=−0.025, Walcott Quarry=−0.024) (Figs. 5A, 6A). The abundances of major phyla at each locality also exhibit similar slopes, with the exception of the taxa of unknown affinity, for which the Tulip Beds taxa exhibit less evenness and a higher slope, indicative of the dominance of a few taxa (Undet. Taxon TB-A and S. gregarium) (Fig. 6B–E).
The relative diversity, and, to a lesser extent, the relative abundance within phyla, is generally similar at the two localities (Fig. 3), with the exception of Arthropoda and unknown taxa. Whereas arthropods are the most diverse phylum at both, the relative abundance of arthropods in the Walcott Quarry is much higher than in the Tulip Beds. The converse is true for the unknown taxa, which are more diverse but less abundant in the Walcott Quarry and less diverse in the Tulip Beds where they are the most abundant group of taxa (Fig. 3). In total there are more phyla at the Walcott Quarry, however this may reflect a sampling bias, as unknown taxa contribute very little to the relative diversity and abundance of organisms at that site. As the rarefaction curves demonstrate (Fig. 4), additional taxa are likely to be discovered with more sampling at the Tulip Beds.
There are large differences in the relative diversities and abundances of endemic and shared taxa at the phylum level between the Tulip Beds and Walcott Quarry (Fig. 7, Supplementary Fig. 1). The most diverse and abundant shared taxa are all Arthropoda. Within phyla, the Arthropoda, Porifera, Mollusca, and Brachiopoda each have more taxa that are shared than endemic. Conversely, there is a greater diversity of endemic unknown taxa, Annelida, Lobopodia, Priapulida, and Algae/Cyanobacteria at each of the two localities than there are shared between the two localities. Taxa of five phyla—Echinodermata, Chordata, Hemichordata, Hyolitha, and Chaethognatha—are not shared between the Walcott Quarry and Tulip Beds (Fig. 7, inset). Taxa of unknown affinity are much more likely to be endemic than shared. Generally, patterns of abundance reflect diversity patterns for endemic and shared taxa, except for Arthropoda. This trend is driven by the low abundance of arthropods at the Tulip Beds and high abundance at the Walcott Quarry (Fig. 7).
Comparison of the diversity (A) and abundance (B) of shared and endemic taxa at the Tulip Beds and Walcott Quarry. Inset indicates how many more taxa are endemic or shared per phylum (i.e., the further a phylum is from 1, the more endemic or shared it is). W=Walcott Quarry (solid line), S=Shared (dashed line), T=Tulip Beds (no line), e=endemic.
Supplementary Figure 1 illustrates the patterns of endemicity and abundance at the generic level in both the Tulip Beds and Walcott Quarry. At the Tulip Beds, Arthropoda, Algae/Cyanobacteria, and Porifera account for the majority of endemic genera. However, when the relative number of individuals per genus is taken into account, the most abundant groups are, in descending order, unknown, Algae/Cyanobacteria, Arthropoda, and Porifera. At the Walcott Quarry, the most diverse endemic taxa are Arthropoda, unknown, Annelida, and Hemichordata, and the most abundant are Arthropoda, unknown, and Algae/Cyanobacteria (Supplementary Fig. 1). The most abundant and diverse taxa that occur in both localities are Arthropoda and Porifera (Supplementary Fig. 1).
The abundance of a shared taxon at one locality does not strongly predict its abundance at the other locality (Table 3). Some taxa, e.g., Nisusia burgessensis and Pirania muricata, have similar relative abundances at both localities, but other taxa have a much higher abundance at either the Tulip Beds (e.g., A. canadensis and Marpolia spissa) or at the Walcott Quarry (e.g., Yohoia tenuis and Waptia sp.).
The correlation statistics of relative abundance of the taxa common to the Tulip Beds and Walcott Quarry (i.e., shared taxa).
When using multivariate data (number of species and specimens together), the Tulip Beds plot largely outside the range of variations in the Walcott Quarry along the first axis of the correspondence analysis (Supplementary Fig. 2), suggesting that the composition of genera at the two localities are distinct. The first axis likely represents the variation in species composition between the Tulip Beds and Walcott Quarry assemblages (i.e., long term species turnover), with the Walcott Quarry assemblages clustering far apart from the Tulip Beds. The second and third axes of the correspondence analysis have similar patterns to the ones identified along the first and second axes, respectively, in Caron and Jackson (Reference Caron and Jackson2008), where axis one was considered to be an environmental gradient and axis two a reflection of short term ecological turnover (see discussion in that paper for further interpretation).
Ecology
Trophic tiering levels and lifestyle
The Tulip Beds generally feature one or two phyla in each trophic tier, with the exception of epibenthic forms, which represent nearly two thirds of taxa (Fig. 8A) and almost half the number of specimens (Fig. 8B), followed by nektobenthic and nektonic taxa. Mobile taxa account for half of the diversity (Fig. 8C), represented by less than 20% of specimens (Fig. 8D), followed by sessile and unknown taxa (Fig. 8C). About half the specimens are sessile (Fig. 8D). Suspension feeders represent a third of taxa and specimens (Fig. 8E–F), followed by carnivores, deposit feeders, primary producers, unknown feeding type, and herbivores (Fig. 8E).
Relative diversity (top) and relative abundance (bottom) of ecological modes in the Tulip Beds (bars with no outline) and Walcott Quarry (outlined bars). A, B, Trophic tiering, C, D, Motility, E, F) Feeding type. Primary p=Primary producers. A, B, Epibenthic taxa dominate in diversity (60.9% of taxa) and abundance (46.9% of taxa), followed by nektobenthic (16.4% diversity; 4.5% abundance), and nektonic taxa (10.0% diversity; 5.2% abundance). Unknown, endobenthic and planktonic tiers comprise less than 5.5% of taxa but unknown tiers alone comprise 29.5% of specimens, followed by planktonic (11.2%), and endobenthic taxa (2.7%). C, D, Mobile taxa account for 51.0% of the diversity, followed by sessile (43.6%), and unknown taxa (5.5%) while the majority of specimens are sessile (50.9%), followed by unknown motility (29.5%) and mobile taxa (19.5%). E, F, Suspension feeders account for 32.7% of diversity and 36.6% of abundance, followed by carnivores (27.3% diversity; 14.0% abundance), deposit feeders (16.4% diversity; 5.3% abundance), primary producers (16.45% diversity; 13.9% primary producers), unknown feeding type (10% diversity; 29.8% abundance), and herbivory (3.6% diversity; 0.2% abundance).
The abundance of phyla in each ecological tier is similar to the diversity patterns in lifestyles described above, except for the epibenthic taxa, where the relative abundance is dominated by taxa of unknown affinity (41.4%), Porifera (24.3%), and Cnidaria (10.9%); the other six phyla account for the remaining 24.2% of individuals (Supplementary Fig. 3A–F).
Arthropods represent the most diverse group in the Tulip Beds in terms of trophic tiering strategies. In terms of diversity nektobenthic arthropods dominate, accounting for 42.9% of the diversity, followed by epibenthic, and nektonic taxa. When taking into account the number of specimens, arthropods are evenly spread among nektonic, nektobenthic, and epibenthic taxa (Supplementary Fig. 4B). Half of all arthropods taxa are carnivores, followed by deposit feeders, with unknown feeding types, and suspension feeders both being marginal (Supplementary Fig. 4). Similarly, arthropod specimens are predominantly carnivores, with a lesser amount of deposit feeders, and marginal number of unknown feeding types and suspension feeders (Supplementary Fig. 4D).
Ecological patterns between the Tulip Beds and Walcott Quarry
Generally, ecological patterns of diversity, but not abundances, are mirrored in the two localities (Fig. 8, Supplementary Fig. 3). Both localities are dominated by epibenthic taxa in diversity and abundance, with ten phyla in the Tulip Beds and 11 in the Walcott Quarry. Whereas the diversity of nektobenthic taxa at both localities is relatively low, there is a greater abundance of mobile nektobenthic taxa at the Walcott Quarry (Fig. 8, Supplementary Fig. 3), due largely to its greater diversity of arthropods (Supplementary Fig. 4). The abundance of sessile organisms (e.g., S. gregarium and Porifera) at the Tulip Beds contributes to differences in motility and trophic tiering between the two sites. Other notable differences in the trophic tiering categories are the diversity and abundance of Annelida in the Walcott Quarry that is not present at the Tulip Beds.
Comparison of the diversity and abundance of feeding types illustrates that although the diversity of feeding types follows similar patterns at both localities, there are also large differences in relative abundance patterns (Fig. 8). Suspension feeders and animals of unknown feeding type dominate in the Tulip Beds, whereas deposit feeders and carnivorous taxa tend to be more abundant in the Walcott Quarry (Fig. 8).
The relative diversity of trophic tiering and feeding types among the Arthropoda is almost identical at the two localities, with nektobenthic and carnivorous taxa dominating, although there is a lower diversity of suspension feeders at the Tulip Beds (Supplementary Fig. 4). In terms of relative abundance, while the trophic tiering categories (epibenthic, nektobenthic and nektonic) for the Tulip Beds have similar abundances, the Walcott Quarry is dominated by nektobenthic taxa and features only a few nektonic taxa. The diversity and abundance of dinocarids at the Tulip Beds, and the diversity and abundance of other arthropods at the Walcott Quarry account for these differences. These differences are also reflected in the feeding levels, i.e. there is a higher relative abundance of carnivores in the Tulip Beds and a higher relative abundance of deposit feeding arthropods at the Walcott Quarry.
When comparing the relative diversity of the endemic and shared ecological modes, similar patterns emerge across taxa endemic to the Tulip Beds, taxa endemic to the Walcott Quarry, and taxa at both localities. In contrast, there is more variation in the relative abundances across the ecological modes. Suspension feeders, carnivores, and herbivores—mostly represented by Porifera and Arthropoda—are more often in both localities than in only one. Taxa of unknown motility, unknown trophic tiering and unknown feeding type occurring in only one locality are more abundant than those occurring in both localities due to the diversity of unknown taxa unique to each locality. However, taxa that are nektonic or endobenthic and herbivorous are more abundant at both localities than taxa with the same ecological characteristics occurring at only one locality. Interestingly, sessile taxa, rather than mobile taxa, appear to be both more diverse and more abundant in both localities than in only one locality.
Clustering
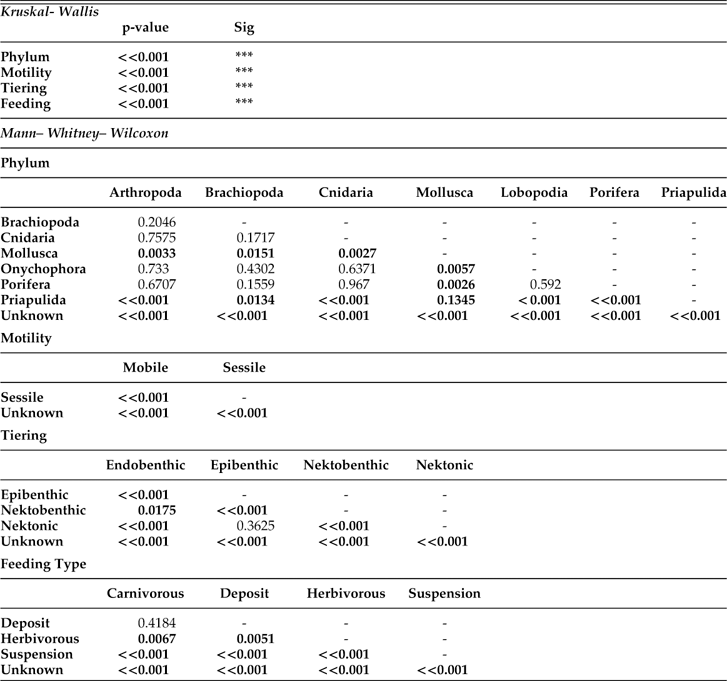
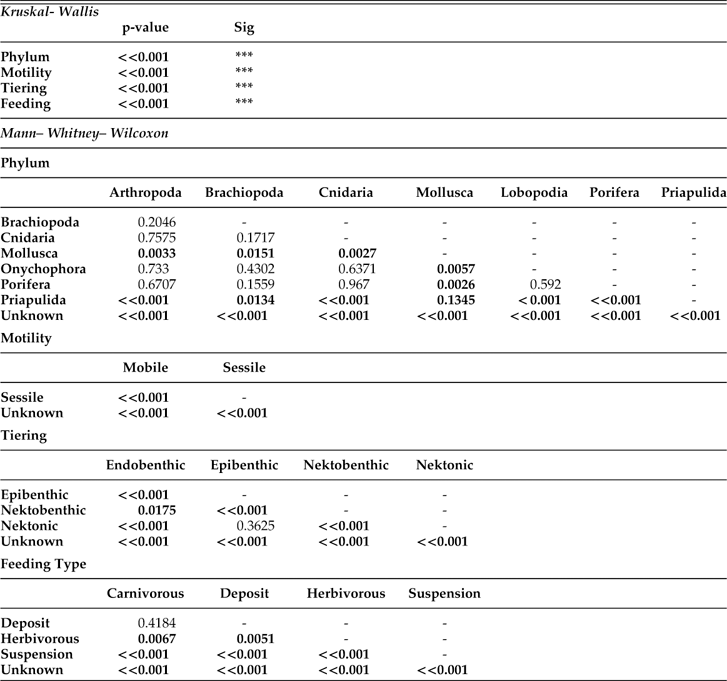
A large majority of specimens in the Tulip Beds have no (n=46, 46%), or limited (n=45, 45%) clustering (Fig. 9). However, eight taxa (8%) appear to be strongly clustered, in that they commonly occur as multiple individuals on a slab (Fig. 9). Because four of the five taxa with the highest mean clustering are of unknown affinity and these four taxa are endemic to the Tulip Beds, it is perhaps not surprising that Kruskal Wallis and Mann Whitney Wilcoxon tests indicate that taxa from the unknown taxonomic group that are also of unknown ecology are more likely to be clustered than any other taxonomic group. Therefore, taxa of unknown ecological tiering levels, unknown motility group, and unknown feeding type all tend to be more clustered (Table 4, Fig. 10B–D). Such tests also confirm that sessile and suspension feeding taxa from known phyla are more likely to be clustered together. There is also more evidence of clustering when taxa are grouped by ecological modes than by phylogenetic clades, suggesting that these relationships may be a function of the abundance of taxa alone. In other words, it could be that abundant taxa are more likely to cluster because they tend to be represented by more than one specimen per slab (Fig. 10A). We tested this hypothesis by running the same analyses, adjusting for abundance; the residuals give an indication of which taxa are most likely to be clustered. After adjustment, some taxa are both abundant and tend to cluster (e.g., Undet. Taxon TB-A and S. gregarium), but some taxa with large abundances do not cluster more than expected (e.g., A. canadensis, Indet. Agnostid, Wapkia sp., Olenoides serratus and Isoxys sp.). Also, some taxa have lower abundances but are possibly clustering (Undet. Taxon TB-E, Elrathina sp., Takakkawia lineata) (Fig. 11).
Median and mean number of specimens of each taxon per slab; the greater the mean, the more the taxon clusters. The 16 most clustered taxa are highlighted in the inset, with mean, median, upper and lower quartiles, whiskers and outliers. Width of box is scaled to abundance. The numbered taxa refer to numbers in Fig. 11A, B.
Main phyletic and ecological groups based on pooled mean number of co occurring specimens of the same taxon per slab attributable to that group. A, Clustering by phylum, B, clustering by trophic tiering level, C, clustering by motility group, D, clustering by feeding type. For statistical comparisons see Table 2. Bold and “*” indicate statistically significant clustering. For parameters of box plots see figure caption Fig. 9.
Correlation of clustering and abundance. A, Regression (OLS) of mean number of specimens per slab against total abundance for the taxon. B, Residuals of A. C–F, Distribution of the residuals per phylum (C), by trophic tiering level (D), by motility (E), by feeding type (F). For statistical comparisons see Table 2. The numbers associated with plots in A and B correspond to the numbered taxa (Fig. 9). For parameters of box plots see caption of Figure 9.
Statistical comparison of the distributions of clustering of the main phyla and ecological modes from Figure 10.
One possible explanation for clustering is gregarious behavior in the original community, which was already suggested for one of the most common fossils from the Tulip Beds, Siphusauctum gregarium (O’Brien and Caron Reference O’Brien and Caron2012), albeit without the statistical evidence presented in this study. Original life habits may be reflected in the assemblage, even though some transportation of certain members of the community may have occurred (O'Brien et al. Reference O’Brien, Caron and Gaines2014). If clustering is biologically mediated, e.g., in the case of gregarious taxa, testable hypotheses can be generated about which taxa, phyla, and ecological modes are most likely to cluster. Conversely, if clustering is not biologically mediated, no clustering patterns should be observable, regardless of taxon level or ecology. Furthermore, if clustering is due to physical sorting before or during deposition, clustering patterns should reflect factors such as body size or composition, irrespective of the animals’ taxonomy or ecology. O’Brien et al. (Reference O’Brien, Caron and Gaines2014) illustrated that there is little evidence of size sorting in the Tulip Beds, and any transport of specimens was likely minimal.
As mentioned above, not all abundant taxa in the Tulip Beds exhibit clustering, and of those taxa that cluster less than expected, the majority are arthropods (e.g., A. canadensis, Indet. agnostid, Hurdia sp., Oryctocephalus sp., and Olenoides serratus) (Fig. 9, 11A–B). Despite being some of the most abundant taxa on some slabs (e.g., almost 200 A. canadensis claws on one slab, see O’Brien et al. Reference O’Brien, Caron and Gaines2014), the majority of occurrences of most arthropods is low on individual slabs, i.e., most arthropods are singletons. Haug et al. (Reference Haug, Caron and Haug2013) suggested that some large accumulations of arthropods at the Walcott Quarry are probably the result of mass molting events. Although the local concentration of A. canadensis claws in the Tulip Beds could be the result of a mass molting event as well, the fact that most claws are disarticulated and not arranged in pairs, as in the A. canadensis material preserved from other localities, makes this interpretation unlikely. Therefore, the accumulations of A. canadensis claws at the Tulip Beds are not typical of the way this taxon is usually preserved, suggesting taphonomic bias and possibly time averaging, further discussed in O’Brien et al. (Reference O’Brien, Caron and Gaines2014).
Discussion
Comparison Between the Tulip Beds and the Walcott Quarry
Diversity patterns
The overall patterns of diversity of the Tulip Beds and the Walcott Quarry are very similar despite variations in taxonomic identity at the genus level, age, paleoenvironment and sample sizes (i.e., number of specimens collected) (Fig. 1). Both localities exhibit similar relative diversities of the main taxonomic groupings and in a similar rank order (Fig. 3A). The arthropods and sponges are the two most diverse groups in both localities, followed by taxa of unknown affinity, but these unknown taxa may belong to several different high level clades. Algae and cyanobacteria are abundant in both assemblages. However, like the taxa of unknown affiliation, their taxonomy is in need of revision and such revisions will likely better inform comparisons in the future. In general, the conserved proportions of taxa in the two localities suggest similar environmental/taphonomic constraints at local or regional scales, as well as similar ecological factors, such as the dispersal ability of species, controlling community settlement and assembly during the time interval separating the two localities.
Taxonomic diversity—genus richness—at the two localities is very similar, with rarefaction curves for the localities falling within the same range of error (Fig. 4). As neither of the taxon richness curves for either locality has reached an asymptote, it is expected that the number of taxa to be discovered with increased sampling will also increase, especially at the Tulip Beds, which has not been sampled as intensively as the Walcott Quarry. Because the rarefaction curve for the arthropods—the richest taxonomic group—is on a steep upward trajectory in the Tulip Beds, whereas the Walcott Quarry curve has almost reached an asymptote, it is expected that, with increased sampling at the Tulip Beds, the number of arthropods should also increase, although these will most likely be rare taxa with little impact on overall abundance levels (Fig. 4B). Additionally, the number of phyla at the Tulip Beds is likely to increase with sampling, because many of the phyla at the Walcott Quarry are very rare (i.e., known from only a few specimens usually representing a single species, e.g., the chordate Pikaia gracilens).
Although the numbers of taxa per phylum are similar at both the Tulip Beds and Walcott Quarry, there are differences in the precise taxonomic composition of these phyla. For example, the Tulip Beds has the highest diversity of dinocarids of any known Burgess Shale locality (Daley and Budd Reference Daley and Budd2010), with at least six identified genera, and the Walcott Quarry has both a lower diversity and abundance of dinocarids. The phyla with the highest diversity of species shared by both localities are arthropods and sponges (Fig. 3A). In terms of endemic species at both sites, Arthropoda and taxa of unknown phyla, are among the most diverse phyla (Supplementary Fig. 1). However, the next most diverse phylum at each locality are different, that is, annelids at the Walcott Quarry, and algae/cyanobacteria at the Tulip Beds, suggesting some differences in community structure. Differences in taxonomic identity also occur within phyla and most likely reflect turnover patterns of species, as demonstrated by the first axis of the correspondence analysis (Supplementary Fig. 2). Taxonomic turnover was demonstrated at the Walcott Quarry within a relatively short (seven meter thick) stratigraphic interval (Caron and Jackson Reference Caron and Jackson2008), and therefore it is likely that there is a much greater degree of taxonomic turnover between the Tulip Beds and the younger Walcott Quarry. The two localities are stratigraphically separated by the thickness of the Wash Limestone Member (~9 meters) at the base of the Walcott Quarry plus tens of meters of strata representing the thickness of the upper section of the Campsite Shale Member immediately above the Tulip Beds (Fletcher and Collins Reference Fletcher and Collins1998, Reference Fletcher and Collins2003). Turnover within the Walcott Quarry was interpreted as potentially reflecting variations at ecological to sub evolutionary temporal scales (Caron and Jackson Reference Caron and Jackson2008), whereas taxonomic variations between the Tulip Beds and the Walcott Quarry more likely reflect a combination of ecological and evolutionary changes between two temporally distinct communities adapted to similar, but not identical, environmental settings. Whereas differences in taxon identity occur between the two localities, the ecological functions that these taxa occupy in their communities are comparable (see below, under Ecological structure).
Abundance patterns
Although diversity patterns follow a similar trend between localities, relative abundance patterns are drastically different (Fig. 3B). The four most abundant phyla at the Walcott Quarry follow the same order as the relative diversity within phyla; however, for the Tulip Beds, the order of the four most abundant phyla is almost the reverse of the relative diversity within the phyla, so that the unknown taxa are the most abundant, followed by the algae/cyanobacteria, arthropods, and sponges.
The abundance patterns at both localities feature high abundances of a few taxa in different taxonomic groups, most remarkably, the unknown taxa, S. gregarium and Undet. Taxon TB-A at the Tulip Beds, and the arthropods Ptychagnostus praecurrens and Liangshanella burgessensis at the Walcott Quarry (Supplementary Fig. 1). These high abundances probably reflect original population differences, albeit some taphonomic and sampling biases cannot be ruled out. Both localities have a similar pattern of distribution in the Whittaker plots, following a log normal distribution indicative of well sampled assemblages with a few abundant taxa and many less abundant and rare taxa (Fig. 5). The slopes of the plots are similar, suggesting similar evenness of taxa in the Tulip Beds and Walcott Quarry localities. The slopes of the complete datasets for the Walcott Quarry and the Tulip Beds are also similar to the slopes for the bedding assemblages that were interpreted as having high richness and evenness in the Walcott Quarry (Caron and Jackson Reference Caron and Jackson2008: Fig. 9).
Caron and Jackson (Reference Caron and Jackson2008) reported that some taxa, particularly numerically abundant ones, tend to recur in bedding assemblages at the Walcott Quarry. Based on studies comparing temporal and spatial patterns of animal communities (Rosenzweig Reference Rosenzweig1995), they hypothesized that such taxa might be “eurytopic,” i.e., taxa adapted to a wide range of environmental conditions or taxa with wider geographic distributions, at a regional scale. Caron and Jackson (Reference Caron and Jackson2008) also assumed that potential distribution patterns of taxa could be detected by comparing assemblages of a similar age across space, a view that is not necessarily applicable here when comparing two stratigraphically distinct localities. Of the 29 taxa considered to be core species in the Walcott Quarry (Caron and Jackson Reference Caron and Jackson2008: Fig. 4), 20 are present in the Tulip Beds. However, these taxa tend to be numerically rare in the Tulip Beds and do not belong to the core species at this locality. Marrella is an example of a very common (core) species in the Walcott Quarry that is also known from the Tulip Beds, albeit represented by only a few individuals. Marrella also occurs regionally (García-Bellido and Collins Reference García-Bellido and Collins2006) and is also known from the Kaili Biota of China (Zhang et al. Reference Zhang, Liu and Zhao2008), suggesting that this genus had a global distribution. Many other taxa present in both localities are not necessarily recurrent in multiple horizons at the Walcott Quarry. This suggests that, while some taxa might be adapted to ecological/environmental variations at a local scale, these taxa might not necessarily be adapted to the range of ecological/environmental variations that existed more regionally.
Ecological structure
As with relative taxonomic diversity, the Tulip Beds and the Walcott Quarry are similar in their relative ecological diversity, suggesting that the constituent taxa from these two fossil assemblages occupy a similar ecospace (Fig. 8A). However, when the relative abundance of specimens belonging to different ecological categories is taken into account, ecological patterns differ greatly between the localities due to the large fluctuations in the sampled population sizes between taxa (Fig. 8B). Like all Burgess Shale-type deposits, nektonic and pelagic organisms are vastly outnumbered by nektobentic and benthic organisms and form a negligible part of the fossil assemblages. It remains unclear whether this pattern reflects a strong ecological signal or whether it is largely influenced by a common mode of sediment deposition and burial of specimens that favor the preservation of taxa that live within or close to the benthos (Caron and Jackson Reference Caron and Jackson2006; O’Brien et al. Reference O’Brien, Caron and Gaines2014).
A few taxa account for much of the ecological abundance at the two sites. The most abundant taxa from the Walcott Quarry are predominantly detritivores (e.g., Liangshanella burgessensis, Burgessia bella, Haplophrentis carinatus and Spartobranchus tenuis), whereas suspension feeders are more abundant in the Tulip Beds, represented mostly by S. gregarium, a large epibenthic sessile organism unknown at the Walcott Quarry (O’Brien and Caron Reference O’Brien and Caron2012). A schematic comparison of the Tulip Beds and Walcott Quarry assemblages as reconstructed communities is provided in Figure 12.
Schematic community reconstruction illustrating most abundant/representative taxa in (A) the Tulip Beds and (B) the Walcott Quarry. Key: 1-Hurdia sp., 2-Ctenorhabdotus capulus, 3-Anomalocaris canadensis, 4-Perspicaris spp., 5-Siphusauctum gregarium, 6-Leptomitus lineatus, 7-Tuzoia burgessensis, 8-Tubulella flagellum, 9-Eiffelia globosa, 10-Hazelia sp., 11-Diagoniella cyathiformis, 12-Wahpia insolens, 13-Vauxia sp., 14-Nisusia burgessensis, 15-Olenoides serratus, 16-Choia carteri, 17-Marpolia spissa, 18-Micromitra burgessensis, 19-Undet Worm TB-A, 20-Habelia? brevicauda, 21-Leanchoilia spp., 22-Hallucigenia spp., 23-Elrathina sp., 24-Dinomischus isolatus, 25-Wiwaxia sp., 26-Ottoia prolifica, 27-Canadaspis perfecta, 28-Pikaia gracilens, 29-Isoxys spp., 30-Marrella splendens, 31-Liangshanella spp., 32-Chancelloria? spp., 33-Odontogriphus omalus, 34-Burgessia bella, 35-Canadia setigera, 36-Herpetogaster collinsi, 37-Spartobranchus tenuis, 38-Gogia? sp.
Both the endemic and shared taxa have a wide range of ecological modes. Generally, the relative ecological diversity of the endemic taxa at one locality mirrors the relative ecological diversity of the other, with the exception of the taxa of unknown affiliation (Fig. 13). This pattern of similar relative ecological diversity suggests that, although there is a large shift in taxonomic identity between the localities, the Walcott Quarry taxa are filling similar ecological roles as the ones present in the older Tulip Beds.
Comparison of the diversity (A) and abundance (B) of ecological modes for the shared taxa (dashed lines) and endemic taxa at the Tulip Beds (bar with no outline) and Walcott Quarry (bars with solid outline). T=Tulip Beds, S=Shared, W=Walcott Quarry, e=endemic, Primary p=Primary producers.
Implications for paleoenvironmental reconstructions
The Cathedral Escarpment has been traditionally regarded as a key geological feature in the formation and preservation of the Burgess Shale (McIlreath Reference McIlreath1977; Collins et al. Reference Collins, Briggs and Conway Morris1983; Aitken and McIlreath Reference Aitken and McIlreath1984). Previous Burgess Shale deposits in the Canadian Rocky Mountains were preserved next to the Cathedral Escarpment (Collins et al. Reference Collins, Briggs and Conway Morris1983), but there are now some important exceptions to that trend (Caron et al. Reference Caron, Gaines, Mãngano, Streng and Daley2010). Whereas it is now clear that Burgess Shale type preservation occurs in various settings across the globe and follows a common mode of preservation (Gaines et al. Reference Gaines, Briggs and Yuanlong2008; Gaines et al. Reference Gaines, Hammarlund, Hou, Qi, Gabbott, Zhao, Peng and Canfield2012a), some authors still suggest that the Cathedral Escarpment probably offered some of the best paleoenvironmental conditions for the preservation of the Burgess Shale biota at a local to regional scale (e.g., Gaines Reference Gaines2011). In our study, the distance from the Cathedral Escarpment does not appear to have had a significant effect on either the relative diversity within phyla or the ecological modes present at the two localities. Our study demonstrates that a fossil assemblage comparable to the Walcott Quarry community can be preserved even at great distances from the escarpment, suggesting that the conditions for the settlement and preservation of a rich Burgess Shale assemblage are not restricted to the escarpment in the Canadian Rockies. Therefore, it is unclear what role, if any, the Cathedral Escarpment had in the formation of the Burgess Shale.
The greater distance of the Tulip Beds from the Cathedral Escarpment might be directly correlated with the thinner beds that entombed soft-bodied organisms (O’Brien et al. Reference O’Brien, Caron and Gaines2014). Although the frequency of burial events in the Burgess Shale is unknown, the absence of any stratigraphic discontinuities and lack of clear background sedimentation suggest that no major gap in sedimentation occurred at either locality. The main influx of sediment came from event beds at both localities, although some background sedimentation has been recognized at the Walcott Quarry (Gabbott et al. Reference Gabbott, Zalasiewicz and Collins2008). Caron and Jackson (Reference Caron and Jackson2008) demonstrated that, despite variation in the thickness of event beds, the community structure in each successive bedding assemblage in the Walcott Quarry remained remarkably similar. However, the presence of very thin bedding at the Tulip Beds may have allowed some ecological groups, especially the swimmers and nektobenthic organisms, to potentially escape burial more easily than at the Walcott Quarry where the beds are generally considerably thicker and presumably would have affected nektobenthic mobile organisms more readily. The very large variation in relative abundances of suspension feeders (more abundant at the Tulip Beds) and detritivores (more abundant at the Walcott Quarry) suggest some possible environmental/ecological differences between the two localities which could be related, in part, to the variations in burial regime or even subtle differences in oxygenation levels. As explained above, detritivores are represented by mobile animals, which could more easily escape burial under very thin bedding, such as the bedding present in some layers at the Tulip Beds. Possible variations in paleo redox conditions also merit attention. As there are very few trace fossils in either the Tulip Beds (O’Brien et al. Reference O’Brien, Caron and Gaines2014) or Walcott Quarry (Caron and Jackson Reference Caron and Jackson2006), it is likely that oxygen availability may have limited infaunal activity within the sediment. Trace metal ratios indicative of weak oxygenation have been proposed to have occurred in the near bottom zone in the Burgess Shale (Powell et al. Reference Powell, Johnston and Collom2003), however; paleo redox analysis for other Burgess Shale-type deposits suggest that assemblages are deposited in dynamic redox conditions and more distal deposits are likely to have experienced anoxic conditions (Gaines and Droser Reference Gaines and Droser2010). Williams et al. (Reference Williams, Vannier, Corbari and Massabuau2011) suggested that bradoriids (e.g., Liangshanella burgessensis), which occur in most other Burgess Shale localities and in other Burgess Shale type deposits worldwide, may have been intolerant of low oxygen conditions. Liangshanella burgessensis plots within species that may be adapted to higher oxygen levels in the Walcott Quarry (Caron and Jackson Reference Caron and Jackson2008), therefore its absence from the Tulip Beds may be linked to periods of low oxygenation at that locality. The fact that the Tulip Beds has a high proportion of sponges and relatively few priapulid worms presumably adapted to lower oxygen conditions also support this interpretation (see discussion in Caron and Jackson Reference Caron and Jackson2008). However, the reputed effects of paleo redox conditions on the Burgess Shale biota remains highly speculative (see also Mángano Reference Mángano2011 for discussion on the difficulties in interpreting oxygen levels at Burgess Shale localities). Other environmental factors, such as turbidity, as well as ecological or evolutionary factors, could have also contributed to the patterns observed. Without additional independent data, such as geochemical analyses, it is not possible to pinpoint any major environmental factors that could explain the apparent ecological differences observed between the two assemblages.
Comparisons with Other Burgess Shale-Type Localities
The Chengjiang biota in China is the only other biota with Burgess Shale-type localities that have been quantitatively examined, allowing for comparisons to the Burgess Shale localities. Dornbos and Chen (Reference Dornbos and Chen2008) examined the community structure of the Shankou fossil assemblage, and the Mafang area has been extensively studied (Zhao et al. Reference Zhao, Caron, Hu and Zhu2009, Reference Zhao, Zhu and Hu2010, Reference Zhao, Hu, Caron, Zhu, Yin and Lu2012, Reference Zhao, Caron, Bottjer, Hu, Yin and Zhu2013). Comparison with assemblages from the Chengjiang localities poses some interesting questions, as the depositional environment is generally shallower but varies extensively at a regional scale (Zhao et al. Reference Zhao, Hu, Caron, Zhu, Yin and Lu2012). About 10 million years older than the Burgess Shale, the Chengjiang biota also offers an opportunity to see community variations over an evolutionary time scale.
Despite the differences in age, depositional setting, and species identity, the overall diversity and number of taxa per phylum in Shankou (Dornbos and Chen Reference Dornbos and Chen2008) and Mafang (Zhao et al., Reference Zhao, Caron, Bottjer, Hu, Yin and Zhu2013) are comparable to the Walcott Quarry and Tulip Beds. However, the diversity patterns in the Chengjiang localities are more similar to each other than any of them are to the Burgess Shale, and, likewise, the diversity patterns in the Burgess Shale localities are more similar to each other than either is to any Chengjiang locality (Fig. 14). Excluding the algae and cyanobacteria, which have not been included in quantitative studies of the Chengjiang biota, some of the main differences between the Chengjiang and Burgess Shale localities include the apparent lack of polychaete worms (Conway Morris and Peel Reference Conway Morris and Peel2008) and echinoderms (Clausen et al. Reference Clausen, Hou, Bergström and Franzén2010) in Chengjiang and a reduced diversity and lower abundance of priapulid worms in the Burgess Shale. Priapulids are dominant in the Shankou locality and are the second most abundant group at Mafang (Zhao et al. Reference Zhao, Caron, Bottjer, Hu, Yin and Zhu2013; Dornbos and Chen Reference Dornbos and Chen2008). The effect of the abundance of priapulids at Chengjiang is also a factor in the ecological structure of the localities, as the endobenthic trophic tier is the second most dominant after the epibenthic trophic tier, although endobenthic is generally the rarest trophic tier in terms of both diversity and abundance at the Burgess Shale localities (Fig. 15). The variation in the diversity and abundance of the priapulids may be due to a combination of differences in depositional settings, sampling biases, ecology and/or evolutionary trends. It is worth pointing out that in some bedding assemblages in both the Burgess Shale and Chengjiang localities, priapulids are very abundant, potentially reflecting local fluctuations in population sizes. For example, Ottoia is one of the most abundant genera at level “−120” in the Walcott Quarry (Caron and Jackson Reference Caron and Jackson2008: Appendix A) and is also very abundant in the Raymond Quarry (Vannier Reference Vannier2012). Chengjiang deposits also have large variations in population sizes of various species, including priapulids, commonly with monospecific accumulations within particular bedding assemblages (Han et al. Reference Han, Shu, Zhang, Liu, Zhang and Yao2006). Because the range of variations in abundance of priapulids in the Burgess Shale can, at short temporal scales, fit within the range of species abundances from the Chengjiang assemblages as a whole, it is likely that the ecological role of priapulid worms was retained in younger Burgess Shale-type communities, such as the Burgess Shale. Overall, the similarities in diversity and structure of the Burgess Shale and Chengjiang localities suggests that the main developmental, evolutionary, and ecological processes regulating Burgess Shale-type communities through time probably remained relatively constant after the onset of the Cambrian Explosion, a pattern also observed using food web models (Dunne et al. Reference Dunne, Williams, Martinez, Wood and Erwin2008).
Comparison of the relative diversity (A) and relative abundance (B) per phylum for the two Burgess Shale localities (Tulip Beds and Walcott Quarry) and two Chengjiang localities (Mafang, modified from Zhao et al. 2014, and Shankou, modified from Dornbos and Chen Reference Dornbos and Chen2008). Phyla are ordered in decreasing proportion.
Comparison of the relative diversity (A–C) and relative abundance (D–F) per ecological mode for the two Burgess Shale localities (Tulip Beds and Walcott Quarry) and two Chengjiang localities (Mafang, modified from Zhao et al. 2014, and Shankou, modified from Dornbos and Chen Reference Dornbos and Chen2008). Phyla are ordered in decreasing proportion.
Wider Implications
One of the most interesting questions in paleoecology is how ecospace use has changed through time and how this relates to functional and taxonomic diversity (Bambach et al. Reference Bambach, Bush and Erwin2007; Novack-Gottshall Reference Novack-Gottshall2007; Bush and Bambach Reference Bush and Bambach2011; Villéger et al. Reference Villéger, Novack-Gottshall and Mouillot2011). Whereas there is an appreciation for how ecospace use and complexity has changed from the Ediacaran to modern eras, our current understanding of the complexity of Cambrian ecospace use in the aftermath of the Cambrian Explosion has been limited by the data available. It is recognized that comparing the abundances of ecological strategies at local levels across geological time is one of the best ways to identify potential difference in ecospace use (Bush and Bambach Reference Bush and Bambach2011).
Studies comparing ecological diversity over large geological ranges, however, tend to only include material that has a good fossil record, i.e., biomineralized taxa (Bush and Bambach Reference Bush and Bambach2011; Villéger et al. Reference Villéger, Novack-Gottshall and Mouillot2011). Using only biomineralized taxa, or taxa with a good fossil record, may lead to biased conclusions when assessing ecological complexity over time. The vast majority of organisms today have little potential for preservation, as was undoubtedly the case in the past, and as the Cambrian Burgess Shale-type deposits demonstrate. Bush and Bambach (Reference Bush and Bambach2011) suggested that the higher than expected abundance of mobile taxa in the Cambrian may be due to the instability of ecosystems until the Ordovician, when ecosystems became dominated by sessile taxa. However, as most sessile Cambrian taxa are soft-bodied, and many Ordovician taxa are biomineralized, this difference in abundance may be the result of a taphonomic bias inherent in the dataset.
Future work may be able to better incorporate data from localities with exceptional preservation into these types of studies as new localities with Burgess Shale-type preservation are found outside of the Cambrian (e.g., the Ordovician Fezouata biota, Van Roy et al. Reference Van Roy, Orr, Botting, Muir, Vinther, Lefebvre, Hariri and Briggs2010). Although collection of and research into this material may be in its infancy, it may provide a good point of reference for future comparisons with Burgess Shale-type assemblages. These types of comparisons are particularly interesting as they can address hypotheses regarding the fate of Burgess Shale type biotas into the Ordovician. It has been proposed, for example, that the Cambrian fauna suffered an extinction at the Ordovician boundary (Bush and Bambach Reference Bush and Bambach2011); however, this proposed extinction event may instead reflect the closing of a taphonomic window such that the exceptional preservation of soft bodied taxa became less common than it had been during the Cambrian. This interpretation is supported by recent work on sites with exceptional preservation that demonstrate the continuation of Cambrian fauna beyond the Cambrian (Botting Reference Botting2007; Van Roy et al. Reference Van Roy, Orr, Botting, Muir, Vinther, Lefebvre, Hariri and Briggs2010; Van Roy and Briggs Reference Van Roy and Briggs2011; Gaines et al. Reference Gaines, Briggs, Orr and Van Roy2012b; Haug et al. Reference Haug, Mayer, Haug and Briggs2012).
Moving forward with these types of studies, it is also important that we understand the potential issues with using abundance data from a single locality to represent all localities, either at a regional spatial scale or on a larger temporal scale. As evidenced here, the relative taxonomic and ecological diversities at the Tulip Beds and the Walcott Quarry remain very similar, but the sites’ relative abundance patterns are very different. Further investigations and discoveries in the field will permit a better understanding of regional and temporal variations of the Burgess Shale biota and will help refine our understanding of its ecological structure.
Acknowledgments
We thank W. I. Ausich and anonymous reviewers for constructive remarks. Parks Canada provided collection and research permits (to D. Collins and J.B. Caron) and we thank R. Gaines, M. Streng and M. Smith for field assistance, P. Fenton for assistance in the collections, C. Brown for illustrations, and S. Scharf for editorial suggestions. This work was derived from the Ph.D. thesis of L.J. O’Brien, and research was supported by fellowships from the University of Toronto (Department of Ecology and Evolutionary Biology) and J.B. Caron’s Natural Sciences and Engineering Research Council Discovery Grant #341944. This is Royal Ontario Museum Burgess Shale project number 49.
Supplementary Material
Supplemental materials deposited at Dryad: doi: 10.5061/dryad.j18qs