

1. Introduction
The enrichment of trace elements in organic-rich sediments has received much attention (e.g. Algeo & Maynard, Reference Algeo and Maynard2004; Wei et al. Reference Wei, Chen, Wang, Yu and Tucher2012; Dai et al. Reference Dai, Zhang, Seredin, Ward, Hower, Song, Wang, Li, Zhao, Kang, Zheng, Wang and Zhou2013; Fu et al. Reference Fu, Wang, Tan, Feng and Zeng2013). Studies of the concentrations of redox-sensitive trace elements in marine sediments and sedimentary rocks can be used to infer palaeoredox conditions (Algeo & Maynard, Reference Algeo and Maynard2004; Tribovillard et al. Reference Tribovillard, Algeo, Lyons and Riboulleau2006; Pattan & Pearce, Reference Pattan and Pearce2009; Hetzel et al. Reference Hetzel, März, Vogt and Brumsack2011; Westermann et al. Reference Westermann, Stein, Matera, Fiet, Fleitmann, Adatte and Föllmi2013; Fu et al. Reference Fu, Tan, Feng, Wang, Chen, Song and Zeng2014). The geochemical anomalies in coal and oil shale may also give rise to some health problems during their exploration and utilization (Bencko & Symon, Reference Bencko and Symon1977; Finkelman, Belkin & Zheng, Reference Finkelman, Belkin and Zheng1999; Dai et al. Reference Dai, Tian, Chou, Zhou, Zhang, Zhao, Wang, Yang, Cao and Ren2008, Reference Dai, Ren, Chou, Finkelman, Seredin and Zhou2012; Zhao et al. Reference Zhao, Zhang, Huang, Wang, Li, Song, Zhao and Zheng2008). Anomalous trace elements in coal are usually related to volcanic ashes, groundwater, magmatic/hydrothermal fluids and detrital source rocks (e.g. Baruah et al. Reference Baruah, Kotoky, Baruah and Bora2005; Dai et al. Reference Dai, Ren, Tang, Yue and Hao2005, Reference Dai, Tian, Chou, Zhou, Zhang, Zhao, Wang, Yang, Cao and Ren2008, Reference Dai, Zhang, Seredin, Ward, Hower, Song, Wang, Li, Zhao, Kang, Zheng, Wang and Zhou2013; Seredin & Finkelman, Reference Seredin and Finkelman2008; Seredin & Dai, Reference Seredin and Dai2012; Zhao et al. Reference Zhao, Ward, French and Graham2012). Strong enrichments of redox-sensitive elements in organic-rich shales are possibly related to anoxic bottom waters (Algeo & Maynard, Reference Algeo and Maynard2004; Hetzel et al. Reference Hetzel, März, Vogt and Brumsack2011). However, the mechanisms that control the enrichment of trace elements in anoxic sediments are still uncertain or incompletely understood.
The Bilong Co. oil shale is located in the southern part of the Qiangtang Basin (Fig. 1a), and the proved oil shale reserves are estimated to be 90.6 million tonnes (Liu et al. Reference Liu, Yang, Dong, Zhu, Guo, Ye, Liu, Meng, Zhang and Gan2009). This oil shale zone, together with the Shengli River – Changshe Mountain oil shale zone found in the North Qiangtang Depression (Fu et al. Reference Fu, Wang, Tan and Zeng2009), represents a large marine oil shale resource in China. The Bilong Co. oil shale has been subjected to many geological studies owing to its economic significance (Wang & Zhang, Reference Wang and Zhang1987; Fu et al. Reference Fu, Wang, Zeng, Tan and Feng2011, Reference Fu, Wang, Zeng, Tan and Feng2012) and potential as a hydrocarbon source rock (Fu et al. Reference Fu, Liao, Wang and Chen2008). Previous studies have described the content and vertical distribution of trace elements in the Bilong Co. oil shale (Fu et al. Reference Fu, Wang, Zeng, Tan and Feng2011). However, a detailed study of the mechanisms controlling the enrichment of trace elements in the oil shale of this area is not available in the literature.
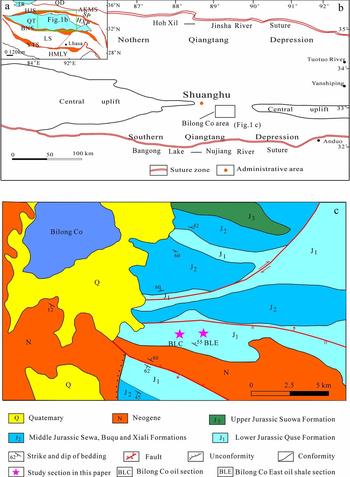
(a) Map of the Tibetan plateau showing major terranes (modified from Fu et al. Reference Fu, Wang, Tan, Chen and Chen2010). (b) Generalized map, showing location of study area (modified from Fu et al. Reference Fu, Wang, Tan, Chen and Chen2010). (c) Simplified geological map of the Bilong Co. area, showing location of the oil shale section (modified from Fu et al. Reference Fu, Wang, Zeng, Tan and Feng2011). TR – Tarim Basin; KLQD – Kunlun–Qaidam terrane; AKMS – Anyimaqen–Kunlun–Muztagh suture; HJS – Hoh Xil – Jinsha River suture; SP – Songpan–Ganzi flysch complex; HXP – Hoh Xili piedmont zone; QT – Qiagtang terrane; BNS – Bangong Lake – Nujiang River suture; LS – Lhasa terrane; YTS – Yarlung Tsangpo suture; HMLY – Himalayas.
The Bilong Co. oil shale is enriched in Li, F, V, Co, Ni, Cu, As, Se, Mo, Cd, Cs, Hg and Bi (see Section 4.d below). The organic-rich sediments in the Bilong Co. oil shale can be correlated with those of the early Toarcian anoxic black-shale events in Europe (Chen et al. Reference Chen, Yi, Hu, Zhong and Zou2005; Yi et al. Reference Yi, Chen, Jenkyns, Da, Xia, Xu and Ji2013; Fu et al. Reference Fu, Tan, Feng, Wang, Chen, Song and Zeng2014). Thus, the Bilong Co. oil shale provides a valuable reference for understanding the mechanisms of trace-element accumulation in the lower Toarcian anoxic sediments and in marine oil shale generally. The present study describes a detailed investigation of the concentrations of trace elements and minerals in the marine oil shale of the Bilong Co. area. The aims are to assess which factors controlled the enrichment of trace elements in the lower Toarcian anoxic sediments, and also in marine oil shale more generally.
2. Geological setting
The Qiangtang Terrane is one of three main E–W-trending continental terranes (i.e. Kunlun–Qaidam Terrane, Qiangtang Terrane and Lhasa Terrane) in the Qinghai–Tibet Plateau (Fig. 1a). It is bounded by the Hoh Xil – Jinsha River Suture Zone to the north and the Bangong Lake – Nujiang River Suture Zone to the south, respectively (Fig. 1b). The Qiangtang Terrane consists of the South Qiangtang Depression, the central uplift and the North Qiangtang Depression (Fig. 1b), which together form the Qiangtang Basin. The Qiangtang Basin is a residual Mesozoic marine sedimentary basin in which Jurassic sediments are the most widely distributed marine strata (Otto, Reference Otto1997; Ding et al. Reference Ding, Wan, Su and He2011); Palaeozoic marine sedimentary sequences are locally preserved in the central uplift (Fu et al. Reference Fu, Wang, Tan, Feng and Zeng2013).
The Bilong Co. oil shale is located in the northern part of the South Qiangtang Depression, where the Jurassic marine deposits are most complete and extensive (Wang et al. Reference Wang, Tan, Li, Li, Chen, Wang, Guo, Wang, Du and Zhu2004). These include the Lower Jurassic Quse Formation, Middle Jurassic Sewa, Buqu and Xiali formations, and Upper Jurassic Suowa Formation (Fu et al. Reference Fu, Wang, Zeng, Tan and Feng2011). The Bilong Co. oil shale was formed in Early Jurassic time (i.e. Quse Formation strata) (Fu et al. Reference Fu, Wang, Zeng, Tan and Feng2011). The sedimentary rocks in this unit are mainly made up of shale, marl, micritic limestone, mudstone and oil shale.
3. Materials and methods
The study area and section location are presented in Figure 1c. Thirty-two oil shale samples were taken from two sampling sections (Fig. 1c). Oil shale samples 11NO.20 were sampled from the Bilong Co. oil shale section, while oil shale samples 11BL20 were taken from the Bilong Co. East oil shale section (Fig. 2). In the Bilong Co. oil shale section, ten oil shale samples (11NO.20-1–11NO.20-10) were taken from the c. 4.0 m thick upper oil shale bed with a uniform sampling interval of c. 40 cm (Fig. 2). The other ten samples (11NO.20-11–11NO.20-20) in the Bilong Co. oil shale section were taken from a c. 5.0 m thick lower oil shale bed with a uniform sampling interval of c. 50 cm. In the Bilong Co. East oil shale section, 12 oil shale samples were collected from a c. 5.5 m thick oil shale bed with a uniform sampling interval of c. 50 cm (Fig. 2). Samples from these areas were collected from surface exposures. All collected samples were immediately stored in plastic bags to minimize contamination.
Sampling sections in the Bilong Co. oil shale showing sampling locations.

Total organic carbon (TOC) was determined using a LECO CS-200 carbon-sulfur analyser with crushed samples (120 mesh) heated from ambient temperature to 1200°C in an induction furnace after removing carbonate by hydrochloric acid. Analytical procedures are described more fully by Yeomans & Bremner (Reference Yeomans and Bremner1988).
A scanning electron microscope (SEM) (Hitachi S-3400N), in conjunction with an energy-dispersive X-ray spectrometer (SEM-EDX), was used to study the morphology of the minerals, and also to determine the distribution of some elements in the oil shale samples, using a 20-kV accelerating voltage and a 10−10 –A beam current. The SEM images were taken from polished sections (polished blocks rather than grain mounts) of the oil shale samples.
The mineralogy was determined by optical microscopic observation and by X-ray powder diffraction (XRD). XRD analysis was performed on a D8 ADVANCE powder diffractometer equipped with a Cu-target tube and a curved graphite monochromator. The XRD pattern was recorded over an interval of 2θ (3°–70°), with a step size of 0.01°. The analytical procedures were taken from Chinese National Standard SY/T 6210-1996 (1996). XRD results were subjected to quantitative mineralogical analysis using Diffrace Plus Eva, an interpretation software developed by Bruker Instrument Co. Ltd based on the reference intensity ratio (RIR) approach (Hillier, 2000). The proportion of clay minerals was based on particular phases.
Samples were crushed and ground to less than 200 mesh (75 μm) for geochemical analysis. X-ray fluorescence spectrometry (XRF) was used to determine the oxides of major elements in the oil shale (850°C), including SiO2, Al2O3, CaO, K2O, Na2O, Fe2O3, MnO, MgO, TiO2 and P2O5. FeO was determined by titration with potassium dichromate (K2Cr2O7). Inductively coupled plasma mass spectrometry (ICP-MS) was used to determine trace elements in the oil shale samples, following the Chinese National Standard method DZ/T 0223-2001 (2001). The oil shale samples for ICP-MS analysis were digested in a microwave furnace using HF+HNO3 (HF:HNO3 = 1:2). Arsenic, Se and Hg were determined by atomic fluorescence spectrometry, using the Chinese Standard method DZG 20.10-1990 (1990).
4. Results
4.a. TOC values
The TOC contents of 32 oil shale samples from the Bilong Co. area range from 3.73 to 15.2% (Table 1). The Bilong Co. oil shale section shows slightly higher concentrations of organic matter (5.17–15.2%) compared with the Bilong Co. East oil shale section (3.73–9.27%) (Table 1).
Concentrations of TOC and major-element oxides and CIA values in oil shale samples from the Bilong Co. oil shale (units in %)

TOC – total organic carbon; M – moisture; A – ash yield; St – total sulfur; ad – air-dry basis; d – dry basis; CIA – chemical index of alteration.
4.b. Minerals
The minerals identified from the XRD data in the whole-oil shale samples are abundant calcite, quartz and illite, minor quantities of feldspar, dolomite and mixed-layer illite/smectite (I/S) (Fig. 4a), and trace amounts of siderite, magnesite, halite, haematite, zeolite, amphibole, gypsum and anhydrite (Table 2). Apatite, pyrite, sphalerite and barite were also identified in some oil shale samples by SEM-EDX, but were below the detection limit of the XRD.
Mineral content as inferred from semi-quantitative XRD analysis in the Bilong Co. oil shale (units in %)

Carbonate minerals are the most common phase including calcite, dolomite, siderite and magnesite. They mainly occur as disseminated grains (Figs 3a, b) and banded (Fig. 3c), and partly as fracture-fillings (Fig. 3d). Microscopic observation suggests that the calcite bands represent algal bodies in the oil shale. Clay minerals were identified in the oil shale samples. They generally occur as irregular masses (Fig. 4a). Quartz occurs as fine particles forming a matrix (Fig. 4b) or as fine grains restricted to the haematite (Fig. 4b). Pyrite is the most common S-bearing mineral in the Bilong Co. oil shale. It was found mainly as nodular (Fig. 5a) and framboidal forms (Figs 4b, 5b), and partly as replacement forms (Figs 5c, d), indicating that the pyrite in the Bilong Co. oil shale is mainly of syngenetic or early diagenetic origin. Additionally, fracture-filling pyrite (Fig. 5e, f) was also found in some oil shale samples, indicating an epigenetic origin. Other S-bearing minerals, including sphalerite (Fig. 6), were found in several of the oil shale samples.
SEM and back-scattered electron image of carbonate minerals in the oil shale samples. (a) Disseminated-grain calcite, sample 11NO.20-2; (b) disseminated-grain calcite and dolomite, sample 11NO.20-3; (c) banded calcite, sample 11NO.20-3; and (d) fracture-filling calcite and barite, sample 11BL20-3.

Modes of occurrence of clay and quartz in the oil shale samples. (a) Irregular-filling mixed-layer (I/S) clay minerals with a colloform texture, sample 11NO.20-9; (b) fine-grained quartz restricted to the haematite and fine-grained quartz forming a matrix, sample 11NO.20-6 (SEM and back-scattered electron image).

Pyrite identified by SEM (back-scattered images) and EDX spectra in the Bilong Co. oil shale. (a) Nodular pyrite, 11NO.20-4; (b) framboidal-pyrite and organic matter, sample 11NO.20-7; (c) replacement pyrite, sample 11NO.20-6; (d) shell-replacement pyrite, sample 11BL20-4; (e, f) fracture-filling pyrite, samples 11NO.20-15 and 11BL20-8; and (g, h) pyrite identified by EDX spectra in the oil shale samples.

Sphalerite identified by SEM (back-scattered images) and EDX spectra in the Bilong Co. oil shale, sample 11NO.20-18.

Apatite was identified in almost all oil shale samples by SEM analysis, and occurs mainly as fracture-fillings (Figs 7a, b). Other minerals including haematite (Fig. 4b) and barite (Fig. 8), were also identified in some oil shale samples using SEM-EDX analysis.
Apatite in oil shale samples from the Bilong Co oil shale. (a, b) Fracture-filling apatite, samples 11NO.20-13 and 11BL20-5; (c) banded apatite, sample 11NO.20-5; (d) disseminated-grain apatite, sample 11BL20-6 (SEM and back-scattered electron image).

Barite identified by SEM (back-scattered images) and EDX spectra in oil shale samples from the Bilong Co. oil shale, samples 11NO.20-12 and 11BL20-8.

4.c. Major-element geochemistry
The major oxides in oil shale samples from the Bilong Co. oil shale are CaO (21.3–35.1%), SiO2 (16.5–28.1%) and Al2O3 (5.72–10.1%). Fe2O3, FeO and K2O are the second most abundant oxides, while all other oxides (MgO%, Na2O%, TiO2%, P2O5% and MnO%) have concentrations of < 1.0% (Table 1).
The high CaO content probably reflects the abundant calcite and dolomite in the Bilong Co. oil shale samples, although Ca may also be partly present as zeolite, gypsum, anhydrite (Table 2) and apatite. Aluminium and Si also show high abundances in the Bilong Co. oil shale, which is consistent with the abundant clay minerals and quartz identified by XRD (Table 2) and SEM-EDX analyses (Fig. 4). Additionally, Si and Al may also be partly associated with zeolite and/or amphibole (Table 2). The high Fe2O3 and FeO contents probably reflect the Fe-bearing minerals, including pyrite (Fig. 5), haematite (Fig. 4b) and siderite (Table 2). A significant positive correlation between Al2O3 and TiO2 (r = 0.98) and K2O (r = 0.97) indicates that these elements have similar carriers. Mg is probably contained in the dolomite, the clay minerals and magnesite, and P is probably contained in apatite observed by SEM-EDX analyses.
4.d. Trace elements in the Bilong Co. oil shale
The concentrations of trace elements in the 32 samples from the Bilong Co. oil shale are presented in Table 3. Based on average values, the most abundant trace elements are F (average 823 μg/g), V (average 126 μg/g), Sr (average 396 μg/g) and Ba (average 285 μg/g).
Concentrations of trace elements in samples from the Bilong Co. oil shale (units in μg/g)

Av – the average value; UCC – the upper continental crust value; EF – the ratio of element content in oil shale to the upper continental crust.
Compared to the average concentration in the upper continental crust (UCC) reported by Taylor & McLennan (Reference Taylor and Mclennan1995), trace elements Se, Mo, Cd, As and Ni are enriched in the Bilong Co. oil shale, with enrichment factors (EF, the ratio of element content in the oil shale to the UCC) of 48.4, 30.0, 13.1, 6.53 and 4.15, respectively. Elements Li, F, V, Co, Cu, Cs, Hg and Bi have enrichment values > 1.52, while Be, Zr, Nb, Sn, Hf, Ta and W are depleted, with an EF less than 0.5. All other elements studied show more or less the same concentration as the UCC values, with an EF between 1.48 and 0.52.
The Bilong Co. oil shale samples are enriched in Li, Be, Sc, V, Co, Ni, Zn, Ga, Se, Rb, Zr, Nb, Mo, Cd, Sn, Cs, Ba, Hf, Ta, W, Hg, Pb, Bi, Th, U and rare earth elements (REEs) in comparison with the average for marine oil shale from China, as reported by Fu et al. (Reference Fu, Wang, Tan, Feng, Zeng, Chen and Wang2015) (Table 3). Averages for F, As and Sr are lower, and those of Cr and Cu are close to the arithmetic means for the corresponding elements in Chinese marine oil shale samples (Fu et al. Reference Fu, Wang, Tan, Feng, Zeng, Chen and Wang2015).
5. Discussion
Seawater and stream water usually contain very low concentrations of trace elements. Thus, the water alone could not have accounted for the high concentrations of these elements observed in the Bilong Co. oil shale. Elevated concentrations of trace elements in the Bilong Co. oil shale are possibly related to input from volcanic ashes, groundwater, magmatic/hydrothermal fluids and the sediment-source rocks. Three processes were probably responsible for the geochemical anomalies found in the Bilong Co. oil shale: (1) the characteristics of the detrital materials from the sediment-source region, (2) marine influence during deposition, and (3) multi-stage hydrothermal activities.
5.a. Detrital materials from the sediment-source region
The modes of occurrence of quartz particles in the Bilong Co. oil shale (Fig. 4b), occurring mainly as fine particles forming a matrix, indicate that they were from detrital materials of terrigenous origin.
Clay minerals are common minerals in the Bilong Co. oil shale, and exhibit high concentrations in some oil shale samples (e.g. 11NO.20-2, 11NO.20-5, 11NO.20-15, 11NO.20-18, 11BL20-1 and 11BL20-3, Table 2). They occur mainly as irregular masses (Fig. 4a) as mentioned in Section 4.b above, and are probably of clastic origin.
Feldspars in sediments are mostly detrital minerals of terrigenous origin (e.g. Moore & Esmaeili, Reference Moore and Esmaeili2012; Dai et al. Reference Dai, Zhang, Seredin, Ward, Hower, Song, Wang, Li, Zhao, Kang, Zheng, Wang and Zhou2013). Feldspar apparently derived from epigenetic hydrothermal fluids, however, has been found in a number of coal deposits (Zhao et al. Reference Zhao, Ward, French and Graham2012), mostly associated with igneous activity. In the Qiangtang Basin, the igneous activity and emplacement ages are at about 205–220 Ma during early Mesozoic time (Fu et al. Reference Fu, Wang, Tan, Chen and Chen2010), which are earlier than the age of the process of oil shale deposition (Early Jurassic). Additionally, feldspars occur mainly as disseminated grains identified by optical microscopy analyses, indicating a clastic origin.
The sediment-source region for the Bilong Co. oil shale is the central uplift, which is composed of the Late Triassic Nadi Kangri Formation volcanic-volcaniclastic rocks (Fu et al. Reference Fu, Wang, Zeng, Tan and Feng2012). The chemical compositions of the oil shale samples included in the present study further support this point of view. Al2O3/TiO2 ratios have also been used to interpret the provenance of sedimentary rocks (e.g. Hayashi et al. Reference Hayashi, Fujisawa, Holland and Ohmoto1997; He et al. Reference He, Xu, Zhong and Guan2010; Dai et al. Reference Dai, Zhang, Seredin, Ward, Hower, Song, Wang, Li, Zhao, Kang, Zheng, Wang and Zhou2013), because of the similar ratios of these effectively immobile elements in sedimentary rocks to those in their parent rocks (Hayashi et al. Reference Hayashi, Fujisawa, Holland and Ohmoto1997). Typical Al2O3/TiO2 ratios are from 3–8, 8–21 and 21–70 for sediments derived from mafic, intermediate and felsic igneous rocks, respectively (Hayashi et al. Reference Hayashi, Fujisawa, Holland and Ohmoto1997). In the Bilong Co. oil shale, the Al2O3/TiO2 ratios of the oil shale samples are from 23.8 to 30.5 (Table 4) indicating a mainly felsic source. Other ratios, such as La/Sc, Th/Sc, Cr/Th and (La/Lu)N are also significantly different in mafic and felsic source rocks and can, therefore, provide information about the provenance of sedimentary rocks (Armstrong-Altrin et al. Reference Armstrong-Altrin, Lee, Verma and Ramasamy2004). The (La/Lu)N, La/Sc, Th/Sc and Cr/Th ratios for the oil shale samples from the Bilong Co. oil shale are similar to those of the Nadi Kangri felsic volcanic source rocks (Table 4), consistent with input of detrital materials of terrigenous origin from those felsic volcanic rock materials.
Range of elemental ratios of the oil shale samples from the Bilong Co. oil shale compared to the ratios in the Nadi Kangri Formation felsic rocks and UCC

a – this study; b – Fu et al. (Reference Fu, Wang, Tan, Chen and Chen2010), Wang et al. (2008); c – Taylor & McLennan (Reference Taylor and Mclennan1995).
REE distribution patterns have also been used as tracers to identify sources of oil shale sediments (Fu et al. Reference Fu, Wang, Zeng, Tan and Feng2011). The oil shale samples from the Bilong Co. area have slightly positive or negligible Eu anomalies (average δEu = 1.02), which is typical for the REE characteristics of the felsic volcanic rocks in the Nadi Kangri Formation (Table 4). The REE distribution patterns in the Nadi Kangri felsic volcanic rocks are similar to those in the oil shale samples (Fig. 9), indicating that the REEs in the Bilong Co. oil shale were probably derived from the Nadi Kangri felsic volcanic rock materials. Input of sediments from these sources may have led to the enrichment of trace elements Li, Cr and Cs in the oil shale. However, the enrichment factor is low with the EF between 1.40 and 1.82 (Table 3).
Distribution patterns of rare earth elements in oil shale samples from the Bilong Co. oil shale. Note the similarity in REE patterns for oil shale samples and the Nadi Kangri felsic volcanic rocks.

Elevated concentrations of trace elements in the Bilong Co. oil shale are also possibly related to weathering. The chemical index of alteration (CIA) is a method of quantifying the degree of source weathering (Nesbitt & Young, Reference Nesbitt and Young1982). CIA was defined as (Al2O3/(Al2O3+CaO*+Na2O+K2O))×100 following Nesbitt & Young (Reference Nesbitt and Young1982, Reference Nesbitt and Young1989), Fedo, Nesbitt & Young (Reference Fedo, Nesbitt and Young1995) and Fedo, Eriksson & Krogstad (Reference Fedo, Eriksson and Krogstad1996). The oxides are expressed as molar proportions. The molar CaO is corrected for the presence of carbonate and apatite as for the CIA (Fedo, Nesbitt & Young, Reference Fedo, Nesbitt and Young1995) to consider only the silicate-bound Ca (CaO*). In the present study, the CIA values of the oil shale samples range from 71 to 79, with an average of 76 (Table 1). These values indicate a moderate degree of chemical weathering of the source area. The elements of the alkaline earth group are the most mobile during continental weathering (Nesbitt, Markovics & Price, Reference Nesbitt, Markovics and Price1980). A weakly positive correlation between CIA and alkaline earth group elements (Fig. 10) indicates a slight or negligible influence of weathering.
Relationship between CIA and alkaline earth elements (a) Be and (b) Sr.

5.b. Marine influence during the oil shale deposition
The Bilong Co. oil shale was deposited in lagoonal environments (Fu et al. Reference Fu, Tan, Feng, Wang, Chen, Song and Zeng2014), and thus the influence of marine conditions on the geochemical characteristics of the oil shale samples appears to have been significant. As mentioned in Section 4.b above, calcite and dolomite occur mainly as grains (Figs 3a, b), indicating an authigenic origin from seawater. Therefore, the high concentrations of Ca and Mg in the Bilong Co. oil shale were probably derived from seawater. The nodular and framboidal occurrences of pyrite (Figs 4b, 5) indicate that the minerals with such modes of occurrence were of syngenetic or early diagenetic origin. The Fe in these minerals was probably derived from seawater.
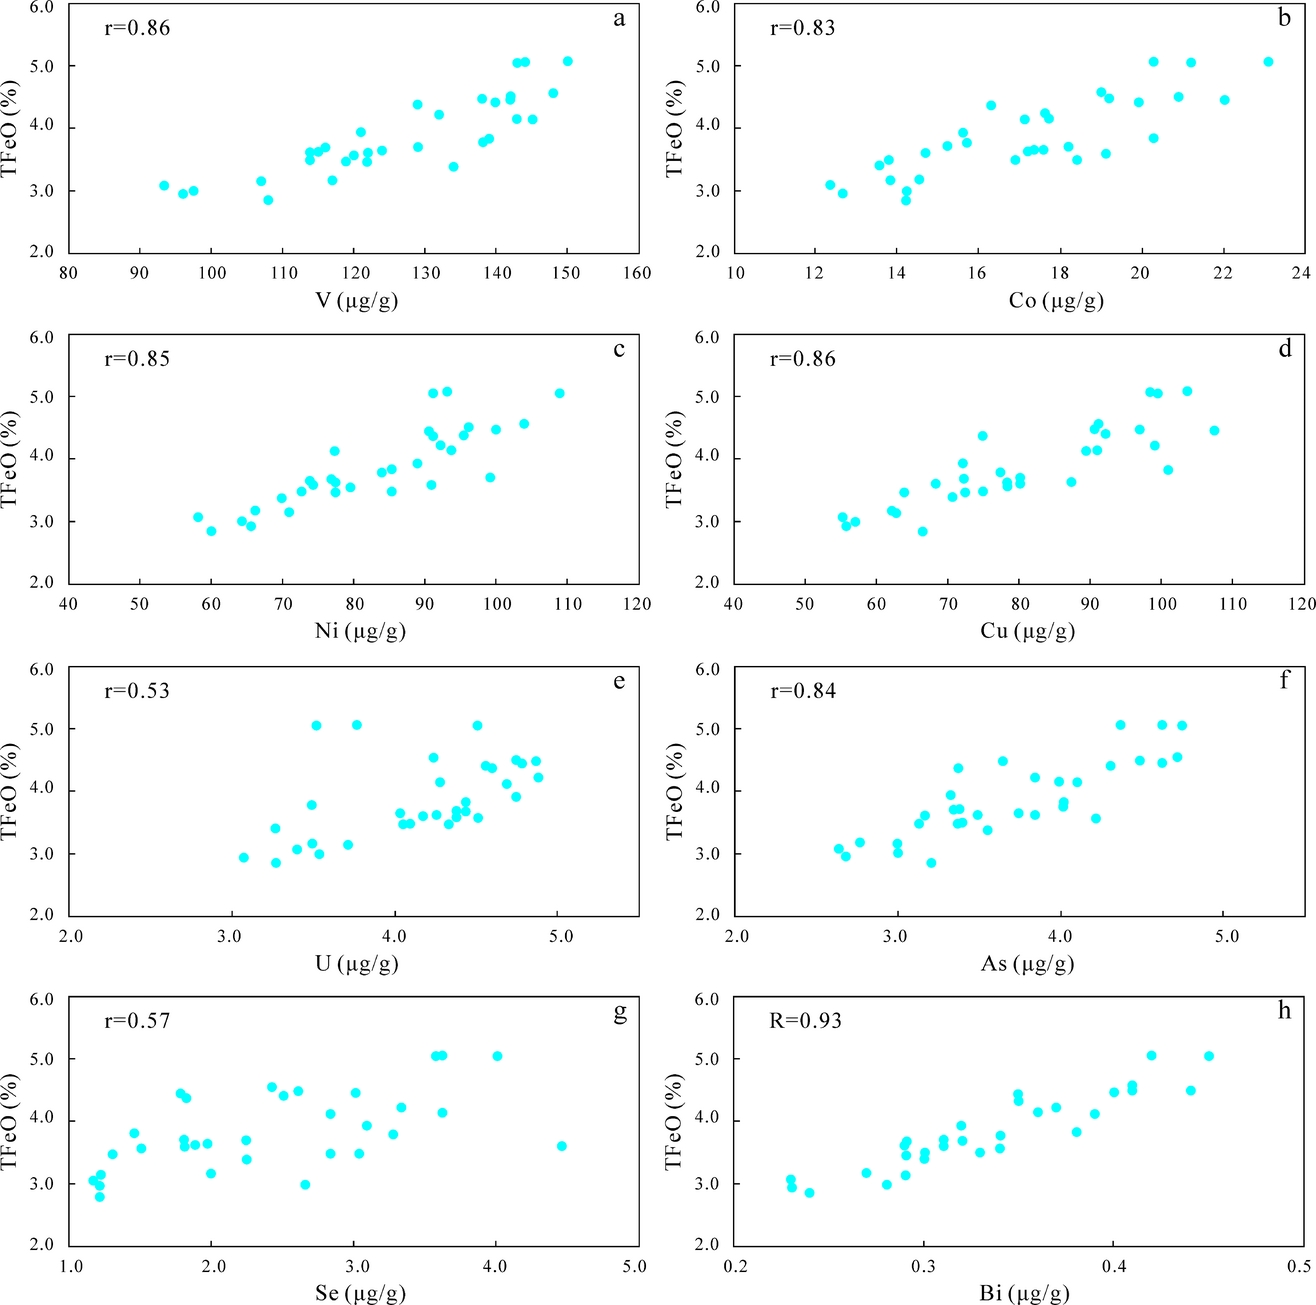
The Bilong Co. oil shale was deposited in anoxic conditions (Fu et al. Reference Fu, Tan, Feng, Wang, Chen, Song and Zeng2014). This point of view is supported by the high concentration of redox-sensitive trace elements (e.g. V, Co, Ni, Cu, Mo and U), which are higher in anoxic marine facies than in deposits formed under oxic marine conditions (Hetzel et al. Reference Hetzel, März, Vogt and Brumsack2011). In such a setting, these trace elements were probably taken up by authigenic mineral phases and/or organic matter (Algeo & Maynard, Reference Algeo and Maynard2004). The TFeO (TFeO = FeO+0.9×Fe2O3) values can be correlated very well with the V (Fig. 11a), Co (Fig. 11b), Ni (Fig. 11c) and Cu (Fig. 11d) concentrations in the studied oil shales, and exhibit moderate positive correlations with U (Fig. 11e), suggesting that these trace elements may be related to the Fe-sulfides (pyrite). Additionally, As, Se and Bi may also occur as Fe-sulfides (pyrite) in the Bilong Co. oil shale as evidenced by the positive relationships between TFeO and the As (Fig. 11f), Se (Fig. 11g) and Bi (Fig. 11h) contents. Previous studies have shown that Mo has high concentrations in oil shale seams of this deposit compared with the adjacent roof and floor strata (Fu et al. Reference Fu, Tan, Feng, Wang, Chen, Song and Zeng2014). The enrichment of Mo may thus be attributed to its links with pyrite and sulfur-rich organic matter (Tribovillard et al. Reference Tribovillard, Riboulleau, Lyons and Baudin2004).
Relationship between TFeO and trace elements (a) V, (b) Co, (c) Ni, (d) Cu, (e) U, (f) As, (g) Se and (h) Bi.
The high Sr content of the oil shale also seems to indicate the influence of seawater on the oil shale, because Sr is deposited directly from seawater (Reimann & de Caritat, Reference Reimann and de Caritat1998). The high ratio of Sr/Ba (average 1.48) in the Bilong Co. oil shale further supports the above observations.
5.c. Hydrothermal fluid influence
Hydrothermal fluid is another important factor that may be responsible for the trace-element and mineral characteristics of the Bilong Co. oil shale. This is supported by mineralogical and geochemical evidence.
As mentioned in Section 4.b above, barite was identified in some oil shale samples. Barite can precipitate in a variety of settings, such as marine, hydrothermal, cold seep and diagenetic environments (Paytan et al. Reference Paytan, Mearon, Cobb and Kastner2002). The various environments of formation result in a range of saturation conditions and precipitation rates, thus resulting in differences in crystal sizes and morphologies of barite (Griffith & Paytan, Reference Griffith and Paytan2012). In the Bilong Co. oil shale, the relationships between barite and calcite (Fig. 8a) indicate that barite was formed later than the associated calcite. The barite contains trace amounts of Ca (Figs 8c, d), which further supports the above observations. The Ca was probably leached from the nearby limestones by hydrothermal fluids.
Sphalerite was also detected by SEM-EDX analysis in the Bilong Co. oil shale, and occurs mainly as shell replacements (Fig. 6a), suggesting an epigenetic hydrothermal origin. Deposition of sphalerite may take place over wide temperature ranges including low-, medium- and high-temperature hydrothermal stages, and its chemical composition is a function of the formation temperature (Ramdohr, Reference Ramdohr1980). Low-temperature sphalerite commonly has a low Fe content with relatively high concentrations of Cd (Ye et al. Reference Ye, Cook, Ciobanu, Liu, Zhang, Liu, Gao, Yang and Danyushevskiy2011). The sphalerite from the Bilong Co. oil shale is depleted in Fe and has relatively high concentrations of Cd, indicating a low-temperature hydrothermal origin.
Fracture-filling pyrite (Figs 5e,f) and shell-replacement pyrite (Figs 5d) were also found in some of the oil shale samples as discussed in Section 4.b above. The relationships between pyrite and calcite (Fig. 5f) indicate that the pyrite was formed later than the associated calcite. The pyrite contains trace amounts of Ca (Figs 5g, h), which supports a hydrothermal origin. Calcium was also probably leached from the nearby limestones by hydrothermal fluids (Dai et al. Reference Dai, Zhang, Seredin, Ward, Hower, Song, Wang, Li, Zhao, Kang, Zheng, Wang and Zhou2013).
The geochemical evidence for the hydrothermal activities is the enrichment of Cd in the oil shale samples. A significantly positive correlation between Cd and Zn (Fig. 12) indicates that Cd is associated mainly with Zn-bearing minerals. The sphalerite is the main carrier of Cd identified by SEM-EDX analysis (Fig. 6b). These data suggest that Cd was derived from hydrothermal fluids.
Concentration of Cd v. Zn, showing a significantly positive correlation.

In addition to high Cd of hydrothermal fluid origin, the high concentration of F in the Bilong Co. oil shale was also derived from hydrothermal fluids. The apatite is the main carrier of F. The relationships between calcite and apatite (Fig. 7b) suggest that apatite was formed later than the associated calcite. The calcite is of authigenic origin as mentioned in Section 5.b above, but the apatite is of epigenetic hydrothermal origin. Fracture-filling occurrences of apatite (Fig. 7a) were also identified by SEM-EDX analysis, which is thought to have been derived from hydrothermal solutions. These data suggest that F has hydrothermal sources, although banded (Fig. 7c) and disseminated grains (Fig. 7d) in a small proportion of the apatite may indicate a seawater origin.
6. Conclusions
(1) The minerals identified in the Bilong Co. oil shale include calcite, quartz, illite, feldspar and dolomite, and trace amounts of siderite, magnesite, halite, haematite, zeolite, amphibole, gypsum, anhydrite, apatite, pyrite, sphalerite, barite and mixed-layer illite/smectite. The clay minerals, quartz and feldspar are detrital materials of terrigenous origin; the carbonate minerals and nodular- and framboidal-pyrite were authigenic or biogenic deposits from seawater; and barite, sphalerite and fracture-filling pyrite were derived from hydrothermal solutions.
(2) The most enriched trace elements in the Bilong Co. oil shale relative to the UCC are Se (48.4×), Mo (30.0×), Cd (13.1×), As (6.53×) and Ni (4.15×); Li, F, V, Co, Cu, Cs, Hg and Bi also have high concentrations, with enrichment factors from 1.52 to 3.44, compared to UCC values. The Bilong Co. oil shales are richer in many trace elements, including Li, Be, Sc, V, Co, Ni, Zn, Ga, Se, Rb, Zr, Nb, Mo, Cd, Sn, Cs, Ba, Hf, Ta, W, Hg, Pb, Bi, Th, U and REEs, in comparison to averages for marine oil shale in China.
(3) Elements thought to be of terrigenous origin in the Bilong Co. oil shale appear to have originated from the Nadi Kangri felsic volcanic rocks. Input of sediments from this source may have also led to the enrichment of trace elements Li, Cr and Cs in the oil shale. However, if so, the enrichment factor is low.
(4) It seems that seawater and hydrothermal activities influenced the geological compositions of the Bilong Co. oil shale. The enrichment of V, Co, Ni, Cu, Mo, As, Se, Bi and U in the oil shale samples was due to marine influence, while F, Zn and Cd were mainly derived from hydrothermal fluids.
Acknowledgements
This work was supported by the National Natural Science Foundation of China (Nos. 41172098 and 40972087), the Sichuan Youth Science & Technology Foundation (No. 09ZQ026-006) and the Chinese National Oil and Gas Special Project (No.XQ-2009-01). We thank two unknown reviewers for their constructive comments on the manuscript.



