INTRODUCTION
Light is one of the most important factors influencing the growth and physiology of zooxanthellate scleractinian corals due to their symbiotic relationship with phototrophic microalgae, the zooxanthellae. When exposed to light, zooxanthellae perform photosynthesis, hereby producing oxygen and organic compounds. When their own respiratory needs are satisfied, zooxanthellae translocate the excess photosynthetic products to the coral host (Muscatine & Cernichiari, Reference Muscatine and Cernichiari1969; Muscatine et al., Reference Muscatine, McCloskey and Marian1981). Zooxanthellae can thus provide a considerable proportion of the resources needed for coral growth, both for soft tissue growth and for skeletal growth. The latter process is commonly referred to as light enhanced calcification. On average, calcification in light is found to be 3–4 times higher than in darkness (Gattuso et al., Reference Gattuso, Allemand and Frankignoulle1999). Although the exact mechanisms of this enhancement are still a matter of debate (Gattuso et al., Reference Gattuso, Allemand and Frankignoulle1999; Furla et al., Reference Furla, Galgani, Durand and Allemand2000; Allemand et al., Reference Allemand, Ferrier-Pagès, Furla, Houlbrèque, Puverel, Reynaud, Tambutté, Tambutté and Zoccola2004; Moya et al., Reference Moya, Tambutté, Tambutté, Zoccola, Caminiti and Allemand2006, Reference Moya, Ferrier-Pagès, Furla, Richier, Tambutté, Allemand and Tambutté2008), the importance of light for coral growth is beyond doubt. Indeed, several studies have shown that a higher photon flux density (i.e. irradiance) results in increased skeletal growth (Marubini et al. (Reference Marubini, Barnett, Langdon and Atkinson2001) for Porites compressa (80–700 µE m−2 s−1), Reynaud-Vaganay et al. (Reference Reynaud-Vaganay, Juillet-Leclerc, Jaubert and Gattuso2001) for Stylophora pistillata and Acropora sp. (130–260 µE m−2 s−1), Reynaud et al. (Reference Reynaud, Ferrier-Pagès, Boisson, Allemand and Fairbanks2004) for Acropora verweyi (100–400 µE m−2 s−1), Schutter et al. (Reference Schutter, Van Velthoven, Janse, Osinga, Janssen, Wijffels and Verreth2008) for Galaxea fascicularis (40–400 µE m−2 s−1)).
However, the quantity of light that is available for the zooxanthellae is not only determined by the photon flux density, but also by the length of the photoperiod. Until now, there have been no studies available that evaluate effects of increased photoperiod duration on coral growth under controlled conditions. If the enhancing effect of light on coral growth is related only to the amount of photons (i.e. light flux) received per day, then it can be expected that: (1) increasing irradiance will result in increased daily growth rates; (2) increasing photoperiod will result in increased daily growth rates; and (3) increasing daily light flux will result in increased daily growth rates.
The first aim of the current work was to test these hypotheses. For this, a series of nine genetically identical, 28-weeks-old, equal sized coral colonies of Galaxea fascicularis were cultured for a period of 18 weeks at different photoperiod durations (8 hours 150 µE m−2 s−1:16 hours dark, 12 hours 150 µE m−2 s−1:12 hours dark, 16 hours 150 µE m−2 s−1:8 hours dark, 24 hours 150 µE m−2 s−1:0 hours dark) and different photon flux densities (8 hours 150 µE m−2 s−1:16 hours dark, 8 hours 225 µE m−2 s−1:16 hours dark and 8 hours 300 µE m−2 s−1:16 hours dark), of which some treatments were comparable in daily light flux (6.48 E/m2/day: 8 hours 225 µE m−2 s−1:16 hours dark and 12 hours 150 µE m−2 s−1:12 hours dark, and 8.64 E/m2/day: 8 hours 300 µE m−2 s−1:16 hours dark and 16 hours 150 µE m−2 s−1:8 hours dark).
Second, the acclimation of corals to different photoperiod durations (8 versus 16 hours light) was studied by measuring net photosynthetic rate, dark respiration, daily P/R ratio, zooxanthellae density and chlorophyll content. Whereas photo-acclimation to different photon flux densities has been studied extensively (Chalker et al., Reference Chalker, Dunlap and Oliver1983; Iglesias-Prieto & Trench, Reference Iglesias-Prieto and Trench1994; Titlyanov & Titlyanova, Reference Titlyanov and Titlyanova2002; Anthony & Hoegh-Guldberg, Reference Anthony and Hoegh-Guldberg2003a), information on physiological adaptations to changes in the photoperiod duration remains scarce. It was expected that photosynthetic rates would not change under increased photoperiod duration, which would consequently result in higher daily photosynthetic rates with increased photoperiod duration. Considering the hypothesis that light enhanced calcification is mediated by photosynthesis, increased photoperiod duration was therefore expected to result in higher daily growth rates. To the best of our knowledge, this is the first description of acclimation of a zooxanthellate scleractinian coral to variation in photoperiod duration in a closed aquarium system.
MATERIALS AND METHODS
Experimental setup
PREPARATORY PHASE
Coral nubbins (single polyp clones) were created from G. fascicularis colonies that were grown at a light intensity of 60 µE m−2 s−1 (70W HQI) in a closed-circuit coral aquaculture system ‘Quarantine system QU3’ of Burgers Ocean, Arnhem, The Netherlands. QU3 is a 6000 l system consisting of four 1000 l aquaria and two 800 l sumps. The circulation system cycles 24 m3 h−1 and the system is connected to a 23.5 l self made calcium reactor (pH 6.2–6.4; Q = 24 l h−1), and a Schuran Aquafloater AQ250 protein skimmer.
Each coral nubbin was fixed to a 7 × 7 × 0.4 cm PVC plate using Reef Construct (Aquamedic). Nine PVC plates with coral nubbins were fixed to one single square plate and maintained for 28 weeks (7 months) in coral culture system QU3 at an irradiance of 150 µE m−2 s−1 which was provided by ATI lighting armatures containing 10.000K T5 Coral Light (Korallenzucht) bulbs. A light: dark cycle of 10L:14D was applied.
EXPERIMENTAL PHASE
After 7 months (28 weeks), each plate containing 9 small coral colonies was assigned to each of the following experimental light regimes (see also Table 1): 8 hours 150 µE m−2 s−1:16 hours dark, 12 hours 150 µE m−2 s−1:12 hours dark, 16 hours 150 µE m−2 s−1:8 hours dark, 24 hours 150 µE m−2 s−1:0 hours dark, 8 hours 225 µE m−2 s−1:16 hours dark and 8 hours 300 µE m−2 s−1:16 hours dark, and cultured for a period of 18 weeks. In addition to each plate containing 9 coral colonies, another 3 coral colonies were kept in each treatment explicitly for experimental use within respirometric flow cells. To facilitate adaptation to the new light regimes, all regimes were adapted in gradual steps (maximum 100 µE m−2 s−1 per day or 2 hours difference per day) during a time span of 7 days.
Description of experimental treatment (irradiance, photoperiod and daily light flux) and the average values for irradiance and water flow that were measured during the 18 week experimental period in each experimental treatment. Note: differences in water flow between treatments were not significantly different (P > 0.10).

Lighting was provided by six ATI lighting armatures containing T5 Coral Light (Korallenzucht) bulbs (colour temperature: 10.000K, i.e. blue-end spectrum lighting) and adjusted to irradiance and light duration using a Profilux aquarium computer. Irradiance was measured weekly and adjusted if needed. Average values per treatment are shown in Table 1.
Experiments were done in semi-enclosed compartments that were constructed inside the coral aquaculture system QU3, to prevent lighting from one treatment to contaminate the other. As a consequence, no free movement of the water surface between experimental treatments and the overflow was possible. Skim boxes, connected to powerful circulation pumps (Aqua Medic Ocean runner 3500 and 6500, respectively 3500 and 6500 l h−1), were installed and adjusted individually to allow for surface skimming (i.e. to keep the water surface free from algae). The water volume in each experimental treatment (~75 l) was estimated to be replaced every 5 minutes.
Within each experimental treatment, water flow was created by two small Eheim pumps (Type 1002; 1000 l h−1) connected to a perforated PVC pipe. Flow velocity was measured weekly using a SENSA-RC2 electromagnetic current meter (Aquadata) and maintained around 15 cm/s. Average values per treatment are shown in Table 1.
Each experimental treatment was fed indirectly by daily feeding of the entire coral culture system (4000–8000 Artemia l−1) and additionally twice a week directly inside each experimental treatment (approximately 250 Artemia l−1). Artemia were hatched on site and subsequently enriched using Easy DHA Selco for 24 hours. Seawater was made up from Tropic Marine salt (Zoomix without bromide).
Temperature in the system was maintained at 25.8 ± 0.3 SD °C, salinity at 34.1 ± 0.1 SD ppt and pH 8.1 ± 0.1 SD. Water quality parameters were monitored on regular basis. During the experiment, the alkalinity in the system was 4.6 ±1.0 SD mEq l−1, calcium concentration 395.9 ± 17.7 SD mg l−1, magnesium concentration 1203 ± 63.7 SD mg l−1, nitrate concentration 0.195 ± 0.077 SD mg NO3-N l−1 and phosphate concentration 0.018 ± 0.015 SD mg PO43- l−1.
Growth parameters
Growth was measured as increased buoyant weight (i.e. an approximation of skeletal weight), according to Schutter et al. (Reference Schutter, Van Velthoven, Janse, Osinga, Janssen, Wijffels and Verreth2008). Specific growth rates for buoyant weight were calculated between week 4 and week 18 (in weeks after the adjustment to the new light regimes), since it was assumed that corals need approximately 4 weeks to adapt to a new light regime (Falkowski & Dubinsky, Reference Falkowski and Dubinsky1981; Anthony & Hoegh-Guldberg, Reference Anthony and Hoegh-Guldberg2003b).
Respirometric measurements
NET PHOTOSYNTHESIS AND RESPIRATION
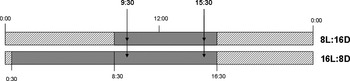
Net photosynthesis and dark respiration were determined for corals maintained at a photoperiod of 8 hours light and at a photoperiod of 16 hours light (irradiance: 150 µE m−2 s−1). Three coral colonies of each treatment were measured on three different days by means of intermittent flow respirometry in a 1616 ± 5 ml respirometric flow cell, according to Schutter et al. (Reference Schutter, Van Velthoven, Janse, Osinga, Janssen, Wijffels and Verreth2008). The coral colonies in the 8 hour treatment were measured at the beginning and end of their photoperiod, while the coral colonies in the 16 hour treatment were only measured at the middle and end of their photoperiod due to restricted access to the experimental facilities of the public aquarium outside of normal working hours (see Figure 1).
Scheme explaining the time of respirometric measurements (see arrows at 9:30 and 15:30) relative to the experimental photoperiod duration (8L:16D and 16L:8D).

Net photosynthetic oxygen production was measured at an irradiance of 150 µE m−2 s−1 (i.e. corresponding to the irradiance in the experimental treatment). Respiratory consumption of oxygen was measured in the dark. Lighting was provided by a T5 lighting system (ATI) containing eight 24 W coral light bulbs (Korallenzucht). A flow speed of ±10 cm s−1 was applied to ensure adequate mixing for respirometry.
DAILY P/R RATIOS
Daily P/R ratios were calculated to indicate whether the corals were self-supporting with respect to carbon. To be able to calculate daily P/R ratios, net photosynthetic and dark respiratory rates were converted to carbon equivalents, using the following equations:


where Pc is net photosynthetic rate in carbon equivalents (µmol C min−1 cm−2), Pnet is net photosynthetic rate in oxygen equivalents (µmol O2 min−1 cm−2) and the factor (12/32) is the molar conversion factor to convert oxygen equivalents (O2) to carbon equivalents (C). Analogously, Rc is dark respiratory rate carbon equivalents (µmol C min−1 cm−2) and, Rdark is the dark respiratory rate in oxygen equivalents. Since we do not know the exact composition of substances that are produced during photosynthesis and that are respired during respiration, no further corrections were applied using metabolic quotients (Gattuso & Jaubert, Reference Gattuso and Jaubert1990).
Daily P/R ratios were calculated using the following equation:

where Pc and Rc are expressed in mg C/hour/cm2, and L and D correspond respectively to the number of hours of light and dark per day. Although interpretation of daily P/R ratios that are derived from short-term measurements is not justified according to Muscatine et al. (Reference Muscatine, McCloskey and Marian1981), it is used here as an approximation.
Analysis of coral tissue
TISSUE REMOVAL
At the end of the experiment, between 13:00 and 14:00, all corals were removed from their treatments, snap-fixed in formaldehyde (3 minutes 10% formaldehyde in 0.22 µm filtered seawater (FSW) 34ppt), rinsed shortly in 0.22 µm FSW 34 ppt, wrapped in tin foil and frozen at –20°C until further processing (Broadbent et al., Reference Broadbent, Jones and Jones2002).
Corals (N = 9) from two treatments (8 hours light/150 µE m−2 s−1 and 16 hours light/150 µE m−2 s−1) were taken from the freezer and soaked in Ca2+-Mg2+-free artificial seawater (ASW) with ethylene diamine tetracetic acid (EDTA) in a slowly moving water bath at 50°C overnight in order to facilitate tissue removal. This solution was prepared according to Rinkevich et al. (Reference Rinkevich, Avishai and Rabinowitz2005). Tissue was removed the next day using high pressured N2 (maximum 1.5 bar within plastic bag). Cell suspensions were collected, diluted with 34 ppt ASW and centrifuged three times for 10 minutes at 4°C at 4000 rpm. The final tissue pellets of each coral were collected in one tube and total volume was determined using a 5 ml pipette. After homogenization using a LABOCAT X1030, samples were taken to count the number of zooxanthellae (200 µl) and for chlorophyll analysis (1 ml).
CHLOROPHYLL ANALYSIS AND ZOOXANTHELLAE COUNT
Chlorophyll was extracted by adding 9 ml 100% acetone to 1 ml tissue homogenate and storing it at –20°C overnight. The next day, this suspension was homogenized again using a LABOCAT X1030. After settlement of the pellet, the absorbance of the extract was measured in triplicate using a Beckman Coulter DU 530 Spectrophotometer at 750, 664 and 630 nm. 90% acetone in demiwater was used as a blank. The concentrations of chlorophyll-a and chlorophyll-C2 were computed according to the equations given by Jeffrey & Humphrey (Reference Jeffrey and Humphrey1975) for dinoflagellates. Each extinction value (OD664 and OD630) was corrected for the absorbance at 750 nm, which is a correction for the turbidity of the sample.
Zooxanthellae were counted using a Bürker–Turk counting chamber. Zooxanthellae density was expressed in amount of zooxanthellae per cm2 surface area. Using the chlorophyll data, the amount of chlorophyll per zooxanthellae was also calculated.
Data analysis
Normality (P > 0.05) and homogeneity of variance (P > 0.05) of the growth and respirometry data were tested using the Shapiro–Wilk test and Levene's test in SAS 9.1. Since our growth, photosynthesis and respiration data did not satisfy the assumptions for analysis of variance testing, we used Kruskal–Wallis as a non-parametric test to detect statistical differences between treatments. A Student's t-test was used to detect statistical differences in chlorophyll content and zooxanthellae density between the 8 hours light and 16 hours light treatment.
RESULTS
Effect of photoperiod duration, irradiance and daily light flux on skeletal growth
PHOTOPERIOD
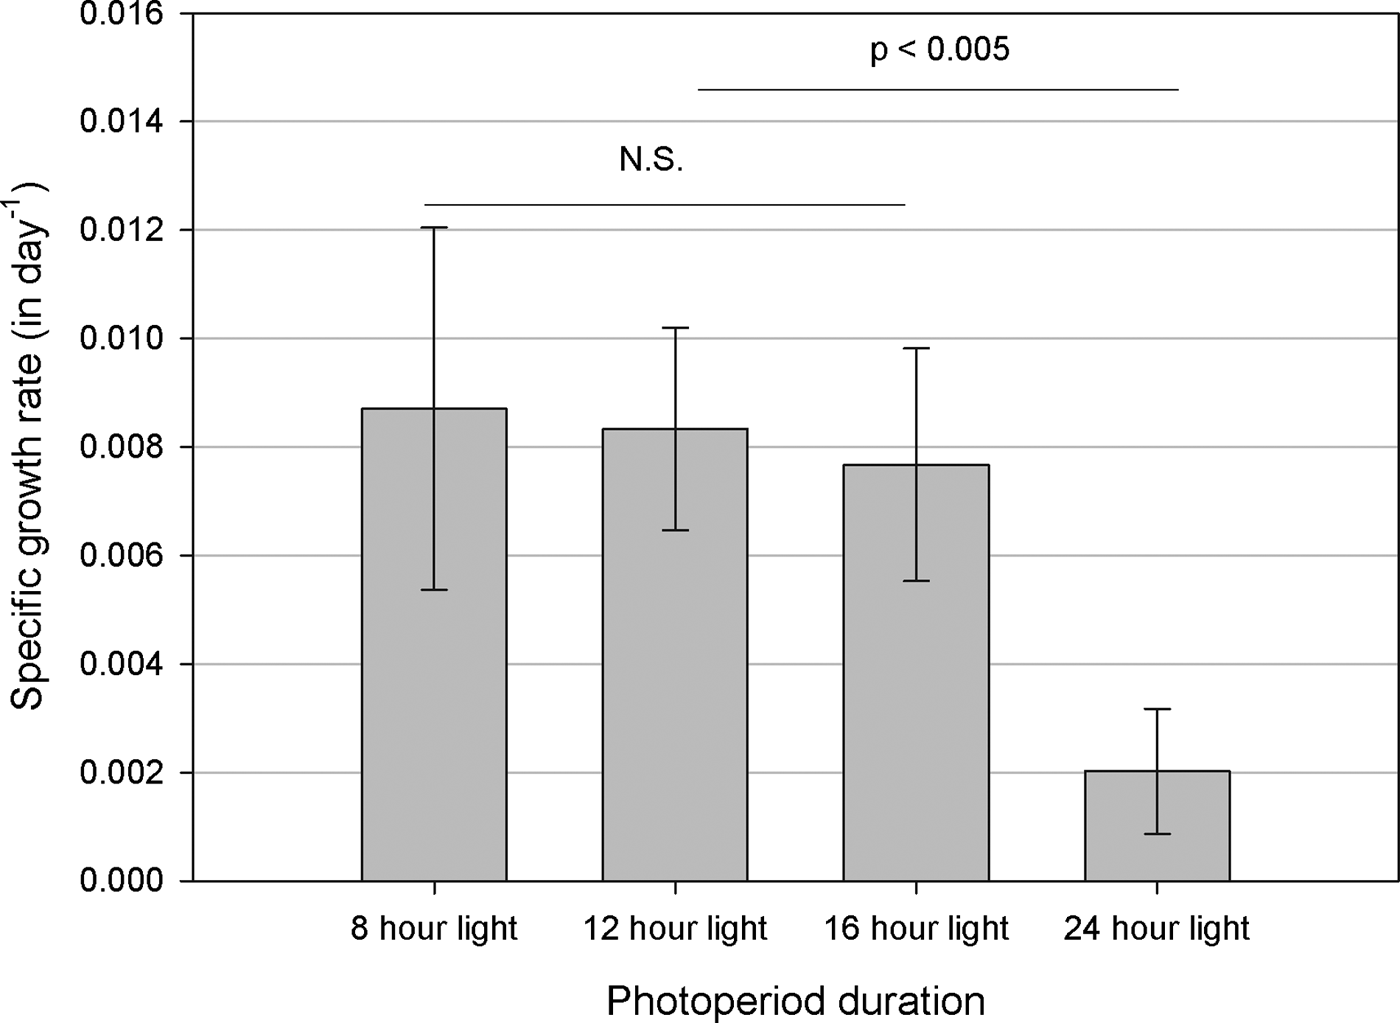
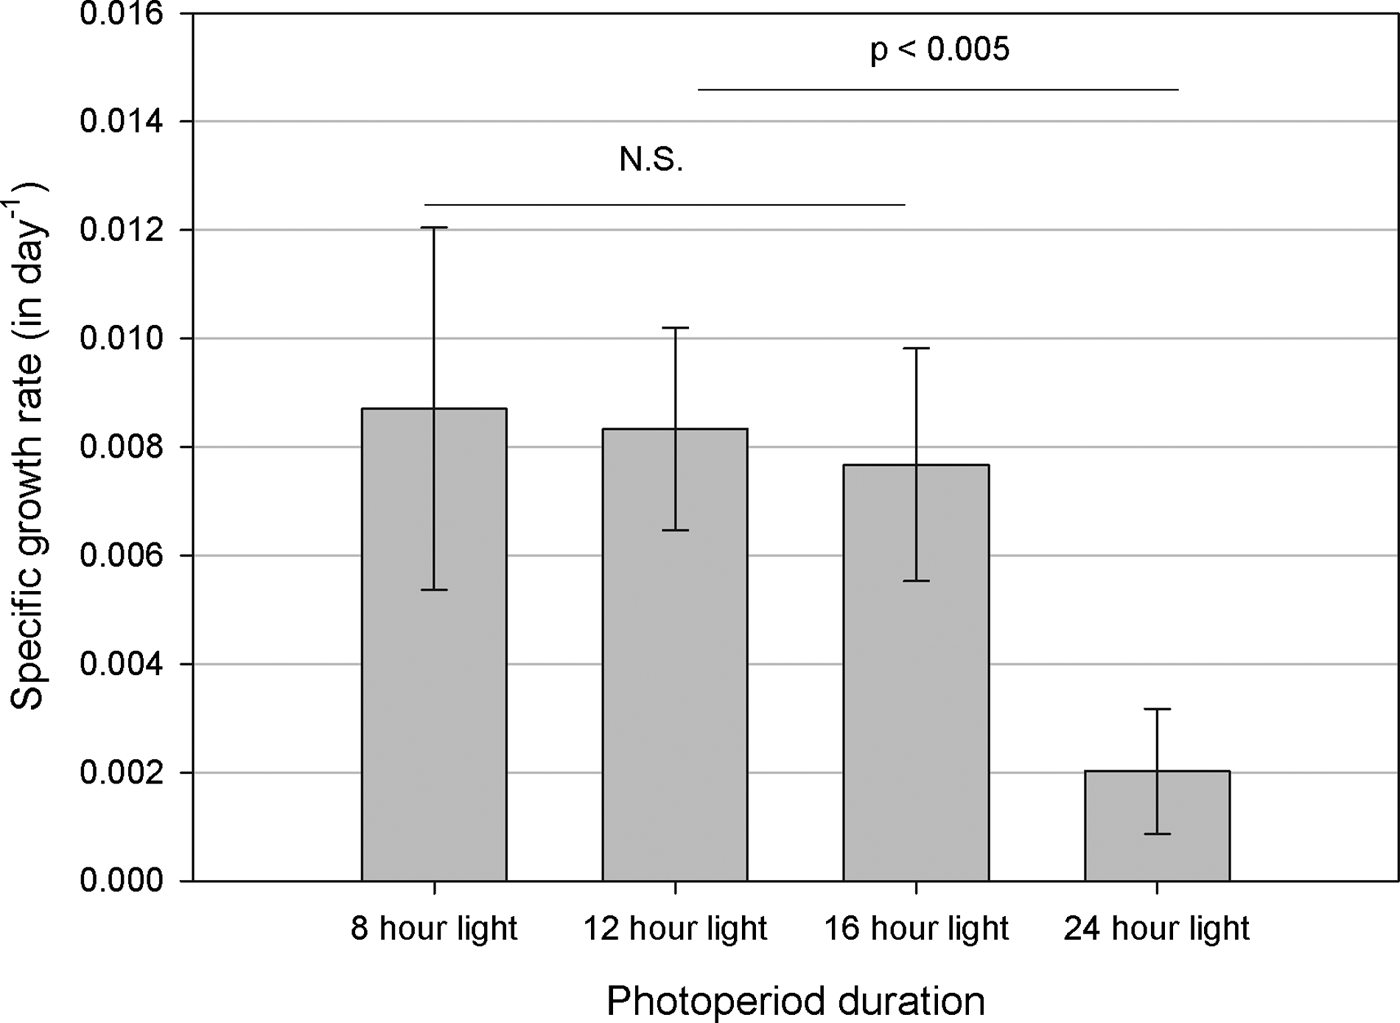
Specific growth rate did not change significantly with increasing photoperiod duration (8 hours, 12 hours and 16 hours). The corals in the 24 hours light treatment started bleaching after the change to the new light regime, but managed to stay alive and to keep growing until week 8. They died finally after week 14. Their specific growth rate (4–14 weeks) was significantly lower than the corals in the other light treatments (P ≤ 0.0005) (Figure 2).
Effect of photoperiod on the specific growth rate in terms of buoyant weight of Galaxea fascicularis between week 4 and week 18 of the experiment. Values are mean ± SD. N = 9.

IRRADIANCE
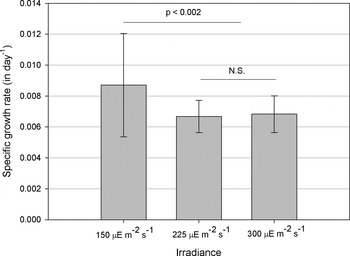
Specific growth rate decreased with increasing irradiance (150 µE m−2 s−1, 225 µE m−2 s−1, 300 µE m−2 s−1). The corals in the 225 µE m−2 s−1 and 300 µE m−2 s−1 light treatment had a significant lower specific growth rate as buoyant weight compared to the 150 µE m−2 s−1 light treatment (P < 0.002) (Figure 3).
Effect of irradiance on the specific growth rate in terms of buoyant weight of Galaxea fascicularis between week 4 and week 18 of the experiment. Values are mean ± SD. N = 9.
DAILY LIGHT FLUX
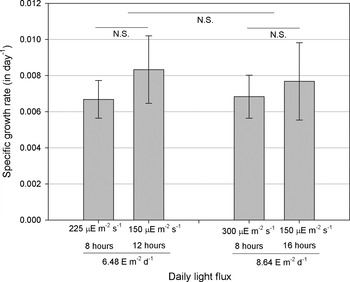
Specific growth rate did not change significantly with increasing daily light flux (6.48 E/m2/day, versus 8.64 E m−2 day−1) (Figure 4).
Effect of daily light flux on the specific growth rate in terms of buoyant weight of Galaxea fascicularis between week 4 and week 18 of the experiment. Values are mean ± SD. N = 9.

Respirometric measurements
No significant difference was found between our measurements of net photosynthesis and dark respiration measured at 9:30 and 15:30 for both the 8 hours light treatment and the 16 hours light treatment. Average net photosynthetic rate (in μmol O2 min−1 cm−2) was significantly higher for corals in the 8 hours light treatment compared to the 16 hours light treatment (P = 0.0005), while average dark respiratory rate was not significantly different (P = 0.24) (Table 2).
Overview of respirometric parameters of corals maintained at a photoperiod of 8 hours light (8 hours 150 µE m−2 s−1: 16 hours dark) and at a photoperiod of 16 hours light (16 hours 150 µE m−2 s−1: 8 hours dark). Values are mean ± SD. P values are given (Student's t-test).

Despite the fact that the corals in the 16 hours light treatment were exposed to light twice as long compared to the corals in the 8 hours light treatment, the total amount of oxygen produced per day (i.e. daily net photosynthesis) was found to be not significantly different between treatments (P = 0.48). However, the total amount of oxygen respired in the night was significantly higher for the corals in the 8 hours light treatment (P = 0.002). Consequently, the average daily P/R ratio was significantly higher for the corals in the 16 hours light treatment (P = 0.003), i.e. the average daily P/R ratio for the corals in the 16 hours light treatment was above 1 (1.59 ± 0.66 SD), while the average daily P/R ratio for the corals in the 8 hours light treatment was below 1 (0.90 ± 0.44 SD) (Table 2).
Chlorophyll and zooxanthellae
No significant difference in chlorophyll-a content (in µg Chl a cm−2) and chlorophyll-C2 content (in µg Chl C2 cm−2) was detected between the corals in the 8 hours light and 16 hours light treatment (Student's t-test, respectively P = 0.47 and P = 0.45), despite visual observation suggesting that the corals in the 16 hours light treatment were less pigmented.
Zooxanthellae density (zoox cm−2) and amount of chlorophyll per zooxanthellae (Chl a zoox−1) were also not significantly different between the corals in the 16 hours light treatment and the corals in the 8 hours light treatment (Table 3).
Overview of chlorophyll and zooxanthellae measurements of corals maintained at a photoperiod of 8 hours light (8 hours 150µE/m2/s: 16 hours dark) and at a photoperiod of 16 hours light (16 hours 150 µE/m2/s: 8 hours dark). Values are mean ± SD. P values are given (Student's t-test).

DISCUSSION
Coral growth: a matter of photons?
No increase in specific growth rate was found with increasing irradiance, photoperiod duration or daily light flux. Continuous lighting (24 hours 150 µE m−2 s−1:0 hours dark) resulted in immediate bleaching and death after 14 weeks. The specific growth rate of these corals was significantly decreased compared to the other treatments. Since several previous laboratory-based studies demonstrated that growth of scleractinian corals increases with increasing irradiance (Marubini et al. (Reference Marubini, Barnett, Langdon and Atkinson2001): between 80 and 700 µE m−2 s−1 for Porites compressa; Reynaud-Vaganay et al. (Reference Reynaud-Vaganay, Juillet-Leclerc, Jaubert and Gattuso2001): between 130 and 260 µE m−2 s−1 for Stylophora pistillata and Acropora sp.; Reynaud et al. (Reference Reynaud, Ferrier-Pagès, Boisson, Allemand and Fairbanks2004): between 100 and 400 µE m−2 s−1 for Acropora verweyi; Schutter et al. (Reference Schutter, Van Velthoven, Janse, Osinga, Janssen, Wijffels and Verreth2008): between 40 and 400 µE m−2 s−1 for Galaxea fascicularis), it can be concluded that light was not limiting for growth in this study. Rather it seems that light was in excess in certain experimental treatments, since the corals in the highest light treatments (225 and 300 µE m−2 s−1) exhibited a significantly lower specific growth rate than the corals lowest light treatment (150 µE m−2 s−1). Similar findings have been reported in field studies that measured coral growth rates along a depth gradient (Baker & Weber, Reference Baker and Weber1975; Bak, Reference Bak1976; Huston, Reference Huston1985). For many coral species, optimal growth rates are found at intermediate depths, indicating that light is in excess at shallower depths. It should be noted that the concept ‘saturating light intensity’ is a relative property that varies between coral species and depends on the physiological status of the coral examined.
Obviously, the availability of photons alone cannot enhance coral growth. Besides the amount of photons, also other factors may play a role in determining coral growth rate. Factors known to be limiting for the growth of stony corals include water flow (Lesser et al., Reference Lesser, Weis, Patterson and Jokiel1994, Schutter et al., Reference Schutter, Kranenbarg, Wijffels, Verreth and Osinga2011), aragonite saturation state (Gattuso et al., Reference Gattuso, Frankignoulle, Bourge, Romaine and Buddemeier1998; Leclercq et al., Reference Leclercq, Gattuso and Jaubert2000; Schneider & Erez, Reference Schneider and Erez2006) and its associated components (Marubini et al., Reference Marubini, Ferrier-Pagès, Furla and Allemand2008), the availability of essential trace metals such as copper and zinc (Ferrier-Pagès et al., Reference Ferrier-Pagès, Houlbreque, Wyse, Richard, Allemand and Boisson2005) and/or the availability of essential nutrients such as aspartic acid (Allemand et al., Reference Allemand, Tambutté, Girard and Jaubert1998) that are mostly supplied by heterotrophic feeding (Houlbreque & Ferrier-Pagès, Reference Houlbreque and Ferrier-Pagès2009). While factors known to have an inhibiting effect on coral growth include elevated nutrient concentrations (Ferrier-Pagès et al., Reference Ferrier-Pagès, Gattuso, Dallot and Jaubert2000; Fabricius, Reference Fabricius2005), increased iron concentration (Ferrier-Pagès et al., Reference Ferrier-Pagès, Schoelzke, Jaubert, Muscatine and Hoegh-Guldberg2001), increased temperatures (Jokiel & Coles, Reference Jokiel and Coles1990; Marshall & Clode, Reference Marshall and Clode2004), competition (Rinkevich & Loya, Reference Rinkevich and Loya1985; Tanner, Reference Tanner1995) and sedimentation (Rogers, Reference Rogers1990).
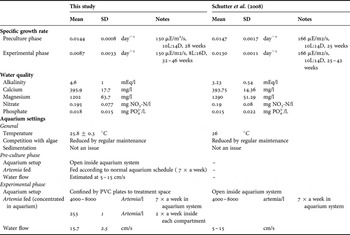
The fact that the specific growth rate of G. fascicularis colonies grown at 8 hours 150 µE m−2 s−1:16 hours dark was noticeably lower compared to G. fascicularis colonies grown at 10 hours 166 µE m−2 s−1:14 hours dark during a similar time period in a previous study (0.0087 ± 0.0033 day−1 versus 0.0130 ± 0.0011 day−1, based on data Schutter et al. (Reference Schutter, Van Velthoven, Janse, Osinga, Janssen, Wijffels and Verreth2008)), suggests that one or more factors were limiting or inhibiting in the current study. However, despite our efforts (see Table 4), the factor(s) limiting or inhibiting coral growth in this study could not be conclusively determined.
Comparison of growth (pre-culture and experimental phase) and aquarium parameters (experimental phase) during the present study with those during a previous study using the same genetic line of Galaxea fascicularis (Schutter et al., Reference Schutter, Van Velthoven, Janse, Osinga, Janssen, Wijffels and Verreth2008). Specific growth rate refers to specific growth rate as buoyant weight.

On the other hand, the unexpected response of our corals during the experimental phase of this experiment could also be due to the transition from the open aquarium system to the experimental setup (i.e. confinement of the corals, albeit within the same aquarium system) and/or the ‘sudden’ change in light regime. This seems plausible because of two observations: firstly, growth rates during the experimental phase of this experiment (0.0087 ± 0.0033 day−1 at 8h 150 µE m−2 s−1:16h dark) were noticeably lower compared to G. fascicularis grown at 10 hours 166 µE m−2 s−1:14 hours dark during a similar time period in a previous study (0.0130 ± 0.0011 day−1, based on data from Schutter et al. (Reference Schutter, Van Velthoven, Janse, Osinga, Janssen, Wijffels and Verreth2008)); and secondly, growth rates during the experimental phase of this experiment were notably reduced compared to the pre-culture phase (0.0144 ± 0.0008 day−1 at 10 hours 150 µE m−2 s−1: 14 hours dark; see Table 4). It is possible, for example, that the sudden change in light duration in the photoperiod treatments caused a disturbance in the timing and phasing of cell division of zooxanthellae and/or coral host cells (Hoegh-Guldberg, Reference Hoegh-Guldberg1994; Fitt, Reference Fitt2000), which could potentially result in decreased growth rates.
At any rate, it seems that the corals were under stress, which could explain their sensitivity to increased available light. It is well-known that different stressors can interact to reduce the tolerance to each individual stressor, e.g. temperature, salinity and light stress (Coles & Yokiel, Reference Coles and Jokiel1978), temperature and light stress (Lesser & Farell, Reference Lesser and Farrell2004), and thermal stress and ocean acidification (Anthony et al., Reference Anthony, Kline, Diaz-Pulido, Dove and Hoegh-Guldberg2008; Muehllehner & Edmunds, Reference Muehllehner, Edmunds, Riegl and Dodge2009). It is recommended for future studies to use a longer experimental time (as in Schutter et al., Reference Schutter, Van Velthoven, Janse, Osinga, Janssen, Wijffels and Verreth2008) to cancel out potential stress effects due to (sudden) changes in light regime and transition between different systems.
Photo-acclimation to prolonged light duration
GROWTH AND PHOTOSYNTHESIS
Since light was not limiting for coral growth, corals in the 16 hours light treatment probably received excess light. Despite receiving excess light, the corals in the 16 hours light treatment managed to retain growth rates comparable to the corals in the 8 hours light treatment. Our respirometric data suggest that the corals in the 16 hours light treatment acclimatized to a longer photoperiod by decreasing their hourly rate of photosynthesis compared to the corals in the 8 hours light treatment. As a result daily net photosynthesis was not significantly different between treatments; this is in agreement with their similar specific growth rates. These results are in line with our original expectations that—if photosynthetic rates did not change with increased photoperiod duration—more hours of photosynthesis per day would result in a higher daily growth rate. Therefore, this result fits with the view that enhancement of calcification is mediated by photosynthesis (Gattuso et al., Reference Gattuso, Allemand and Frankignoulle1999; Allemand et al., Reference Allemand, Ferrier-Pagès, Furla, Houlbrèque, Puverel, Reynaud, Tambutté, Tambutté and Zoccola2004), since neither growth nor daily net photosynthesis were significantly different between the two treatments. Although no photosynthesis was measured in the different irradiance treatments, it is plausible that these treatments acclimatized to excess light by adjusting their photosynthetic rate accordingly. Photosynthesis was probably reduced with increasing irradiance levels, resulting in lower daily photosynthetic rates and—as we observed—lower daily growth rates at higher irradiance levels (225 µE m−2 s−1 and 300 µE m−2 s−1). However, this remains to be demonstrated in future studies.
Davies (Reference Davies1991) reported a higher total photosynthetic energy fixation of corals in the field on sunny days compared to cloudy days. On sunny days, total photosynthetic energy fixation was more than required for respiration and growth, while energy expenditure exceeded photosynthetic energy fixation on cloudy days. Although the daily amount of sunny hours is not the same as photoperiod duration, it can be said that the extra hours of light resulted in a higher daily net photosynthesis in the study of Davies (Reference Davies1991), which is in contrast to what we found in the present study. It is possible that receiving ‘continuous lighting’ (i.e. without occasional decreases in light intensity) for a prolonged period triggers a different physiological response and acclimation mechanism of the coral. Additionally, the 16 hours photoperiod duration that we applied in the present study is unnatural (i.e. never occurs in nature) and was only applied for aquaculture purposes.
Light stress is known to reduce photosynthetic rates as a result of oxidative stress (Lesser, Reference Lesser1996; Nakamura & Van Woesik, Reference Nakamura and Van Woesik2001; Finelli et al., Reference Finelli, Helmuth, Pentcheff and Wethey2006), potentially impairing light-enhanced calcification. In response to excess irradiance, in general, corals will engage in mechanisms for photo-protection and limit their light capture to prevent photo-inhibition. Either by limited light availability or by photo-inhibition, this response will result in reduced photosynthetic rates (Titlyanov et al., Reference Titlyanov, Bil', Fomina, Titlyanova, Leletkin, Eden, Malkin and Dubinsky2000; Anthony et al., Reference Anthony, Hoogenboom and Connolly2005). Moreover, light stress can also reduce coral growth rates (e.g. Baker & Weber, Reference Baker and Weber1975; Bak, 1979; Huston, Reference Huston1985) due to the allocation of energy to (costly) stress responses, such as the synthesis of heat shock protein and protecting pigments (Anthony et al., Reference Anthony, Connolly and Willis2002), instead of to coral growth. In fact, we found that the corals in the 16 hours light treatment had a significantly higher availability of photosynthetic carbon (i.e. higher daily P/R ratio) compared to the corals in the 8 hours light treatment, which did not make a difference for their growth. Possibly, the increased availability of photosynthetic carbon was allocated towards defence mechanisms against photo-oxidative stress instead of towards skeletal growth, explaining the absence of increased growth with increasing availability of photosynthetic carbon. Energy allocation to photo-protective mechanisms remains to be studied in future investigations.
ACCLIMATION MECHANISM
Based on zooxanthellae density and chlorophyll content, it is not possible to distinguish whether the adaption (photo-acclimation) to the longer light duration was host-controlled or symbiont-controlled, since neither a difference in zooxanthellae density nor in chlorophyll content was found. Generally, corals acclimate to increased light by regulating their light capture. This can occur either by limiting light harvest and utilization of their photosystems (i.e. by decreasing the amount of photosynthetic pigments per zooxanthellae, decreasing the zooxanthellae density in polyp tissue, or increasing non-photochemical quenching) and/or limiting light capture by self-shading of their photosynthetic surfaces (i.e. by changes in morphology and anatomy of coral colony) (Titlyanov et al., Reference Titlyanov, Bil', Fomina, Titlyanova, Leletkin, Eden, Malkin and Dubinsky2000; Anthony et al., Reference Anthony, Hoogenboom and Connolly2005). Self-shading can be either a morphological response (i.e. expressed in colony architecture, long-term response) or a behavioural response (i.e. expressed as tissue retraction, short-term response). Tissue retraction is often a response to stress, e.g. in response to sub-aerial exposure, bright light or increased iron concentrations (Brown et al., Reference Brown, Tudhope, Le Tissier and Scoffin1991) and can be expressed as polyp retraction or withdrawal of tentacles (Brown et al., Reference Brown, Le Tissier and Dunne1994, Reference Brown, Downs, Dunne and Gibb2002). It is also known to occur in G. fascicularis (Brown et al., Reference Brown, Le Tissier and Dunne1994). Since self-shading does not involve the loss of either zooxanthellae or photosynthetic pigments (Brown et al., Reference Brown, Le Tissier and Dunne1994), it is possible that this occurred in the present study. Moreover, due to the sudden change in light regime, the corals in the present study neither had the time for morphological changes of the skeleton that normally occur during growth in a certain light regime (Anthony et al., Reference Anthony, Hoogenboom and Connolly2005). The reduced photosynthetic rates might therefore be explained by lower light levels as a result of self-shading, and are hence host-controlled. Tissue retraction is likely an effective mechanism to keep irradiance within a physiologically optimal range, just like self-shading through morphological plasticity of skeletal architecture (Anthony et al., Reference Anthony, Hoogenboom and Connolly2005).
The mechanism to adapt to excess light might be the same for excess light received as irradiance and as light duration. The only difference might be in the time of onset of photo-adaptation or photo-inhibition, since if the irradiance itself is not stressful, the amount of photons can accumulate to stressful amounts during the day. However, this remains to be demonstrated.
The growth and physiological response of corals to increased light duration under light conditions that are limiting for coral growth remains to be investigated. The use of photosynthesis–irradiance curves and/or pulse-amplitude modulation measurements during daytime will provide more insight into the photo-acclimative responses.
CONCLUSION
The enhancing effect of light on coral growth is not only a matter of photons. No positive correlation between light availability and growth was observed under the given experimental conditions. Neither with increasing photoperiod duration, nor with increasing irradiance, nor with increased daily light flux. This indicates that light was not the limiting factor for coral growth and was most probably in excess. Continuous lighting (24 hours) resulted in immediate bleaching and finally death of the corals.
Corals were able to adapt to prolonged light duration under light saturating conditions by decreasing their hourly rate of photosynthesis. As a result, daily net photosynthesis was not significantly different between corals grown at 8 hours light and 16 hours light. Photo-acclimation to prolonged photoperiod was not achieved by changes in zooxanthellae density or chlorophyll content. It is proposed that the corals exhibited a form of self-shading that reduced the amount of photons reaching the coral, thereby reducing their photosynthetic rates and specific growth rates.
Obviously, light was not limiting for growth in this experiment. Factor(s) limiting or inhibiting coral growth in this study could not be conclusively determined. Our results do show that corals are able to adapt to a prolonged light duration under stressful condition and that daily growth rates seem to be correlated to daily photosynthetic rates. Therefore, for coral aquaculture, increasing light availability still seems promising, but remains to be explored under light-limited conditions.
ACKNOWLEGDEMENTS
This research is part of the European CORALZOO project that aims at improving coral husbandry techniques for sustainable coral breeding in zoos and public aquaria. In this project, scientists and aquarists collaborated to provide a scientific basis for coral husbandry techniques. The experiment described in this paper was aimed to study the enhancing effect of light, presented either as irradiance or as light duration, on the growth of scleractinian corals. We thank the staff of Burgers Ocean for their help in setting up the experiment and Rachel Jones for performing the final English check of our manuscript. This work was funded by the European Commission (Project CORALZOO-012547).