


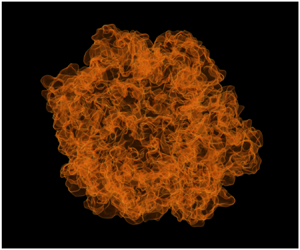


1. Introduction
Technical combustion devices operate in the turbulent regime in order to increase burning rates and achieve higher power densities than are otherwise possible in laminar flows. Turbulence modulates the reactive front surface area through wrinkling and the mean burning rate per unit area through modifications to the flame structure. The former effect dominates over the latter in the wrinkled and thin reaction zone regimes (Borghi Reference Borghi1985; Peters Reference Peters1988, Reference Peters1999) and is the focus of the present study.
The dimensionless turbulent burning velocity  $S_T/S_L$ depends on a variety of dimensionless parameters such as the ratios of length and velocity scales of flame and turbulence, Reynolds, Karlovitz and Damköhler numbers. Here,
 $S_T$ is the mean volumetric burning rate normalized by a density and a suitable reference area, while
 $S_L$ is the propagation speed for a freely propagating laminar flame. Understanding the dependence of the turbulent burning velocity on various dimensionless groups is vital to turbulent premixed combustion modelling.
Early experiments on turbulent burning rates focused primarily on their dependence on the ratios  $u'/S_L$ and
 $l/\delta _L$. Here
 $u'$ is the turbulent velocity fluctuation,
 $l$ the integral length scale of turbulence and
 $\delta _L$ the laminar flame thickness. Damköhler (Reference Damköhler1940) proposed a linear relation between
 $S_T/S_L$ and
 $u'/S_L$ for ‘large-scale turbulence’ (small
 $u'/S_L$). Pocheau (Reference Pocheau1992) later showed that a power law of the form
 $S_T/S_L = (1+(u'/S_L)^{n})^{1/n}$ satisfies scale invariance in the corrugated flame limit. A spectral closure of the level-set equation led Peters (Reference Peters1999) to propose an algebraic equation for the normalized burning velocity in terms of the ratios of both length and velocity scales. More recently, Kolla, Rogerson & Swaminathan (Reference Kolla, Rogerson and Swaminathan2010) also proposed an algebraic model for the burning rates based on the closure of terms in the Reynolds averaged Navier–Stokes (RANS) equation for the scalar dissipation rate of the progress variable.
Recent theoretical, experimental and numerical studies support the notion that the burning rate depends on the Reynolds number, although not necessarily uniquely on it. Kobayashi et al. (Reference Kobayashi, Tamura, Maruta, Niioka and Williams1996, Reference Kobayashi, Seyama, Hagiwara and Ogami2005) measured mean burning rates in pressurized Bunsen burners equipped with turbulence-generating grids, finding increasing values of  $S_T/S_L$ for increasing pressures at constant values of
 $u'/S_L$. When
 $u'/S_L$ was held constant alongside the geometry of the burner and grids, giving a nearly constant integral scale
 $l$ also, the increase in
 $S_T/S_L$ correlates with the increase in Reynolds number brought by the decreasing kinematic viscosity with increasing pressure. Experiments of turbulent spherical premixed flames at the University of Leeds postulated and explored the dependence of
 $S_T/S_L$ on
 ${Re} \sim u'l$ or
 ${Re}_{\lambda } \sim u' \lambda$ (Andrews, Bradley & Lwakabamba Reference Andrews, Bradley and Lwakabamba1975; Abdel-Gayed & Bradley Reference Abdel-Gayed and Bradley1977; Abdel-Gayed, Bradley & Gray Reference Abdel-Gayed, Bradley and Gray1981), where
 $\lambda$ is the transverse Taylor micro-scale (Taylor Reference Taylor1935).
Starting from the spectral closure of the level-set equation (Peters Reference Peters1992), Chaudhuri, Akkerman & Law (Reference Chaudhuri, Akkerman and Law2011) proposed and later confirmed experimentally (Chaudhuri et al. Reference Chaudhuri, Wu, Zhu and Law2012) a  ${Re}^{1/2}$ scaling for
 $S_T/S_L$ in turbulent spherical premixed flames, where
 ${Re}$ is based on the turbulent flame radius and the reactants’ thermal diffusivity. Subsequent experimental evidence corroborating the
 ${Re}^{1/2}$ scaling includes measurements for a variety of reactive mixtures, pressures and turbulence parameters (Chaudhuri, Wu & Law Reference Chaudhuri, Wu and Law2013; Wu et al. Reference Wu, Saha, Chaudhuri and Law2015; Jiang et al. Reference Jiang, Shy, Li, Huang and Nguyen2016). Some universality of the proposed scaling was also demonstrated by collapsing the data from Kobayashi et al. (Reference Kobayashi, Tamura, Maruta, Niioka and Williams1996, Reference Kobayashi, Seyama, Hagiwara and Ogami2005).
Liu et al. (Reference Liu, Shy, Peng, Chiu and Dong2012) investigated the dependence of turbulent flame speeds in pressurized premixed methane/air mixtures propagating in homogeneous isotropic turbulence up to  ${Re}_{\lambda } \approx 100$. By controlling independently
 $u'$ and
 $l$ (via fan speed) and the reactants’ kinematic viscosity
 $\nu$ (via pressure), the authors were able to measure burning rates for various values of
 $u'/S_L$, while holding
 ${Re}_{\lambda }$ constant and experiments were repeated for several values of the Reynolds number. The turbulent flame speed
 $S_T/S_L$ was found to increase with Reynolds number, remaining nearly constant as
 $u'/S_L$ varied at constant Reynolds number. Ahmed & Swaminathan (Reference Ahmed and Swaminathan2013, Reference Ahmed and Swaminathan2014) also reported
 $S_T/S_L \sim {Re}_T^{0.55}$ based on unsteady RANS simulations of methane/air and hydrogen/air flames, where
 ${Re}_T = u'l/\nu$ is the turbulent Reynolds number.
In this study we investigate the Reynolds dependence of burning rates of spherical turbulent premixed flames in decaying isotropic turbulence with direct numerical simulations (DNS). The simulations are conducted at increasing Reynolds number and low values of the Karlovitz number, so that turbulent combustion occurs in the flamelet limit (Libby & Bray Reference Libby and Bray1980; Libby & Williams Reference Libby and Williams1994; Peters Reference Peters2000), where modifications to flame propagation are negligible.
The statistical state of turbulence encountered by the propagating flame is characterized solely by the velocity fluctuation  $u'$, integral length scale
 $l$ and kinematic viscosity
 $\nu$. Statistics are a function of time and radial distance from the centre of the spherical flame only, so that ensemble averages are gathered over the polar and azimuthal angles at each instant in time.
Freely decaying isotropic turbulence was preferred to forced turbulence for this study due to the following considerations. Firstly, it is representative of many real devices in which turbulence decays spatially, such as in jets; or temporally, such as in an internal combustion engine. Secondly, decaying isotropic turbulence is well understood through a vast literature (Batchelor & Townsend Reference Batchelor and Townsend1948a; Baines & Peterson Reference Baines and Peterson1951; Comte-Bellot & Corrsin Reference Comte-Bellot and Corrsin1971; Huang & Leonard Reference Huang and Leonard1995), which allows us to identify and compensate transient effects consistently across simulations with varying Reynolds number and turbulence scales. We find the opportunity to compare against known results in decaying turbulence preferable to introducing a forcing term in the momentum equation as commonly done in isothermal flows, since theoretical results on forced variable density flows do not exist to our knowledge.
The rest of the article is organized as follows. Section 2 describes the governing equations and numerical methods. The configuration is presented in § 3. The temporal evolution of integral properties of the turbulent flames, such as burning rates, flame radius and flame surface area are discussed in § 4. Section 5 presents the analysis of the evolution of the peak surface density function and turbulent flame brush thickness. Scaling laws are proposed for both quantities separately in § 6 and a scaling law for the evolution of the flame area ratio as a function of the Reynolds number is discussed. The article concludes in § 7 with a summary of the results and prominent findings.
2. Governing equations
The evolution of the flow is described by the reactive multi-component Navier–Stokes equations in the low Mach number limit (Tomboulides, Lee & Orszag Reference Tomboulides, Lee and Orszag1997; Mueller Reference Mueller1999). The continuity and momentum equations read as
 \begin{equation} \frac{\textrm{D} \rho}{\textrm{D} t} = -\rho\boldsymbol{\nabla} \boldsymbol{\cdot} \boldsymbol{u} \end{equation}
and
 \begin{equation} \rho \frac{\textrm{D} \boldsymbol{u}}{\textrm{D} t} = -\boldsymbol{\nabla} {\rm \pi}+ \boldsymbol{\nabla} \boldsymbol{\cdot} {\boldsymbol{\mathsf{T}}}, \end{equation}
respectively. Here  $\textrm {D}/\textrm {D}t = \partial /\partial t + \boldsymbol {u} \boldsymbol {\cdot } \boldsymbol {\nabla }$ denotes the material derivative, where
 $\boldsymbol {u}$ is the mass averaged bulk velocity (Bird, Stewart & Lightfoot Reference Bird, Stewart and Lightfoot2006). In the momentum equation,
 ${\boldsymbol{\mathsf{T}}}$ is the viscous shear stress tensor and
 ${\rm \pi} = {\rm \pi}(\boldsymbol {x},t)$ is the hydrodynamic pressure, which is small compared to the spatially homogeneous background thermodynamic pressure
 $p=p(t)$. The mixture density
 $\rho$ obeys the equation of state for a mixture of ideal gases
 \begin{equation} p = \rho \mathcal{R} T/W, \end{equation}
where  $\mathcal {R}$ is the universal gas constant and
 $W$ the molar mass of the mixture and
 $T$ is temperature. Thus, spatial variations in density are related to spatial variations in temperature and mixture composition, but not in pressure.
A Newtonian fluid model is used for closure of the viscous shear stress tensor
 \begin{equation} {\boldsymbol{\mathsf{T}}} = \mu \left(\boldsymbol{\nabla} \boldsymbol{u} + (\boldsymbol{\nabla} \boldsymbol{u})^\textrm{T} \right) - \tfrac{2}{3} \mu (\boldsymbol{\nabla} \boldsymbol{\cdot} \boldsymbol{u} ){\boldsymbol{\mathsf{I}}}, \end{equation}
where  $\boldsymbol {\nabla } \boldsymbol {u}$ is the velocity gradient tensor and
 ${\boldsymbol{\mathsf{I}}}$ is the identity tensor. A mixture-averaged model is employed for the dynamic viscosity of the mixture
 $\mu$ (Wilke Reference Wilke1950; Bird et al. Reference Bird, Stewart and Lightfoot2006).
The species densities are  $\rho _i = \rho Y_i$, where
 $Y_i$ is the mass fraction of the
 $i$-th species, and obey the following transport equations (
 $i=1,\ldots ,M$):
 \begin{equation} \rho \frac{\textrm{D} Y_i}{\textrm{D} t} = - \boldsymbol{\nabla} \boldsymbol{\cdot} \left( \rho_i \boldsymbol{V}_i \right)+ \omega_i. \end{equation}
Here  $\omega _i$ and
 $\boldsymbol {V}_i$ refer to the net rate of production of species
 $i$ due to chemical reactions and the mass diffusion velocity, respectively. Diffusive transport of species is modelled with the Hirschfelder–Curtiss approximation (Hirschfelder et al. Reference Hirschfelder, Curtiss, Bird and Mayer1954; Poinsot & Veynante Reference Poinsot and Veynante2012)
 \begin{equation} \boldsymbol{V}_i X_i = - \mathcal{D}_{i} \boldsymbol{\nabla} X_i, \end{equation}
where
 \begin{equation} \mathcal{D}_i = (1 - Y_i)\left/\left(\sum_{\substack{j=1\\j\neq i}}^{M} X_j/\mathcal{D}_{ij}\right)\right.. \end{equation}
We denote by  $X_i$ the mole fraction of the
 $i$-th species. In the above equations,
 $\mathcal {D}_{ij}$ and
 $\mathcal {D}_i$ are the binary and species diffusion coefficients, respectively. Closure for the mass diffusion velocity reads as
 \begin{equation} \rho_i \boldsymbol{V}_i = -\rho \mathcal{D}_i \frac{Y_i}{X_i} \boldsymbol{\nabla} X_i = - \rho \mathcal{D}_i \frac{\boldsymbol{\nabla} \left(W Y_i\right)}{W}. \end{equation}
This approximation is complemented by a small correction velocity  $\boldsymbol {u}^{c}$ in order to ensure total mass conservation, yielding
 \begin{equation} \frac{\partial \rho_i}{\partial t} + \boldsymbol{\nabla} \boldsymbol{\cdot} \left(\rho_i \left(\boldsymbol{u} + \boldsymbol{u}^{c} \right) \right) = - \boldsymbol{\nabla} \boldsymbol{\cdot} \left( \rho_i \boldsymbol{V}_i \right)+ \omega_i, \end{equation}
where
 \begin{equation} \boldsymbol{u}^{c} = - \sum_{i=1}^{M} Y_i V_i = \sum_{i=1}^{M} \mathcal{D}_i Y_i \frac{\boldsymbol{\nabla} W}{W} + \sum_{i=1}^{M} \mathcal{D}_i \boldsymbol{\nabla} Y_i. \end{equation}
The equation for the conservation of enthalpy is manipulated into a differential equation for temperature:
 \begin{equation} \rho c_p \frac{\textrm{D} T}{\textrm{D} t} = \frac{\textrm{d}p}{\textrm{d}t} + \boldsymbol{\nabla} \boldsymbol{\cdot}(\varLambda \boldsymbol{\nabla} T) - \sum_{i=1}^{M} c_{p,i} \rho_i \boldsymbol{V}_i \boldsymbol{\cdot} \boldsymbol{\nabla} T - \sum_{i=1}^{M} h_i \omega_i. \end{equation}
The equation above assumes that viscous heating is negligible on account of the low speed of the fluid and the fact that the pressure field  $p$ is spatially homogeneous, albeit varying in time. A mixture-averaged model is employed for the thermal conductivity
 $\varLambda$ (Mathur, Tondon & Saxena Reference Mathur, Tondon and Saxena1967). The specific enthalpy and the specific heat at constant pressure for species
 $i$ are
 $h_i=h_i(T)$ and
 $c_{p,i}=c_{p,i}(T)$, respectively, and are evaluated from NASA tables (McBride, Gordon & Reno Reference McBride, Gordon and Reno1993).
Closure for the source terms  $\omega _i$ is provided by a skeletal chemical kinetics mechanism featuring 16 species and 73 elementary reactions of the Arrhenius type, obtained from GRI-mech 3.0 (Smith et al. Reference Smith, Golden, Frenklach, Moriarty, Eiteneer, Goldenberg, Bowman, Hanson, Song and Gardiner1999). The use of a skeletal kinetics mechanism reduces computational costs while modelling key properties accurately, such as ignition delay time, laminar flame speed and thickness. More details on the kinetics mechanism and a comprehensive suite of validation cases are given in Luca et al. (Reference Luca, Al-Khateeb, Attili and Bisetti2018a).
The configuration is a closed vessel of constant volume  $V$, so that the evolution of the background pressure
 $p(t)$ is obtained from the conservation of mass in the vessel,
 \begin{equation} p = \left( \int_V \frac{W}{T} \, \textrm{d}V\right)^{-1} m \mathcal{R}, \end{equation}
where  $m$ is the constant mass in the domain.
2.1. Numerical methods
Equations (2.1), (2.2), (2.5) and (2.11) are integrated in time with the finite difference solver ‘NGA’ on a homogeneous Cartesian grid (Desjardins et al. Reference Desjardins, Blanquart, Balarac and Pitsch2008). The convective and viscous terms in the momentum equation and the diffusive terms in the scalar equations are discretized with second-order centred finite difference formulas on a staggered grid. The third-order weighted essentially non-oscillatory scheme (Liu, Osher & Chan Reference Liu, Osher and Chan1994) is used for the convective terms in the scalar transport equations. Mass conservation is enforced by solving a Poisson equation for the hydrodynamic pressure  ${\rm \pi}$ instead of the continuity equation. The discrete form of the pressure equation is obtained with centred second-order finite difference formulas.
The advancement in time of the governing equations follows a splitting approach (Pierce Reference Pierce2001). The momentum and pressure equations are coupled with the classic pressure-correction method (Chorin Reference Chorin1968). The momentum equation is integrated in time with a semi-implicit method featuring the explicit second-order Adams–Bashforth method for the convective terms and the implicit Crank–Nicolson method for the linear viscous terms (Kim & Moin Reference Kim and Moin1985). The linear system ensuing from the viscous terms is solved in factored form with the alternating direction implicit (ADI) method (Peaceman & Rachford Reference Peaceman and Rachford1955). The time advancement of the temperature and mass fractions is performed with a first-order Lie splitting approach, whereby the integration of the convective and diffusive terms is performed first for each scalar field independently and that of the reactive source terms is handled at each grid point next. The temporal integration of the convective and diffusive terms is semi-implicit with the convective terms treated explicitly and the linear diffusive terms with the implicit Crank–Nicolson method and ADI factorization. The integration of the reactive source terms is performed pointwise with adaptive backward differentiation formula methods as implemented in the CVODE solver for systems of ordinary differential equations (Hindmarsh et al. Reference Hindmarsh, Brown, Grant, Lee, Serban, Shumaker and Woodward2005).
The variable coefficients pressure equation is solved with the library HYPRE (Falgout, Jones & Yang Reference Falgout, Jones and Yang2006) using the preconditioned conjugate gradient iterative solver coupled with the parallel alternating semi-coarsening multi-grid V-cycle preconditioner. All governing equations are coupled together with an outer iteration loop and convergence is found to be adequate after two iterations (Pierce Reference Pierce2001).
The grid is homogeneous and isotropic with spacing  $\varDelta = 20\ \mathrm {\mu }\textrm {m}$ and the time step size is constant at
 ${\rm \Delta} t = 0.2\ \mathrm {\mu }\textrm {s}$. The spatial and temporal resolutions are adequate, since
 $\eta /\varDelta \geqslant 0.5$ and
 $\tau _{\eta }/{\rm \Delta} t \geqslant 20$, where
 $\eta$ and
 $\tau _{\eta }$ are the Kolmogorov length and time scale, respectively. Moreover,
 $\delta _L/\varDelta \geqslant 6$, where
 $\delta _L$ is the thermal thickness of the flame, as defined later in § 3. Extensive numerical tests to confirm adequate spatial resolution for the reactive fronts were carried out for turbulent premixed jet flames (Luca et al. Reference Luca, Attili, Lo Schiavo, Creta and Bisetti2018b) and are not repeated here.
3. Flow configuration
The configuration consists of a cubic box filled with a reactive mixture and initialized with homogeneous isotropic turbulence. A spherical kernel of burnt gases is initialized at the centre of the domain and a turbulent flame propagates outward into freely decaying turbulence. Periodic boundary conditions are imposed in all three directions, so that the computational domain represents a closed vessel. As burnt gases are produced behind the flame, the background pressure increases and the mixture is compressed isentropically. A schematic of the configuration is shown in figure 1.
Turbulent spherical premixed flame in a cubic box of side  $2L$ with periodic boundary conditions. The instantaneous flame surface (orange colour) is surrounded by homogeneous isotropic turbulence, represented by isosurfaces of vorticity (blue colour). The flame surface corresponds to an isosurface of the progress variable. The kernel of burnt gases at the onset of the simulation is shown as a sphere of radius
 $R_0$ in the cut-out (red colour).

The reactants are a fully premixed mixture of methane and air with equivalence ratio  $0.7$. At the onset of the simulation, the temperature and pressure are 800 K and 4 atm, respectively. At these thermo-chemical conditions, the laminar flame speed is
 $S_L = 1\ \textrm {m} \ \textrm {s}^{-1}$, the thermal thickness is
 $\delta _L=(T_b-T_u)/max\{|\boldsymbol {\nabla } T|\}=0.11$ mm and the characteristic flame time
 $\tau _L = \delta _L/S_L = 0.11$ ms. Here,
 $T_b$ and
 $T_u$ are the temperatures of the products and reactants, respectively, and
 $max\{| \boldsymbol {\nabla } T |\}$ is the maximum value of the temperature gradient across the laminar flame.
In this study a set of three primary simulations, denoted by  $R1$,
 $R2$ and
 $R3$, are performed at increasing Reynolds number (see table 1). The Reynolds number is adjusted by varying the initial values of the fluctuation
 $u'$ and integral scale
 $l$. Thus, the initial Reynolds number increases due to both
 $u'$ and
 $l$ increasing from
 $R1$ to
 $R3$. On the other hand, the Kolmogorov length scale
 $\eta$, velocity scale
 $u_{\eta }$ and time scale
 $\tau _{\eta }$ are unchanged. Since the reactive mixture and associated flame scales
 $S_L$,
 $\delta _L$ and
 $\tau _L$ are unchanged also, this results in a constant initial Karlovitz number
 ${Ka} = \tau _L/\tau _{\eta } = 25$ for all three simulations.
Turbulence parameters at the onset of the simulations. Here  $N$ is the number of grid points. The effective domain radius
 $R_L = 2 (3/4{\rm \pi} )^{1/3} L \approx 1.24L$ is defined based on
 $L$, half the length of the side of the cubic domain. The flame properties are
 $\delta _L = 0.11$ mm,
 $S_L = 1\ \textrm {m} \ \textrm {s}^{-1}$ and
 $\tau _L = 0.11$ ms. The Karlovitz number is defined as
 ${Ka} = \tau _{L}/\tau _{\eta }$.

Turbulence decays freely as the flame front moves from the centre outwards. The statistical state of turbulence encountered by the propagating flame is characterized solely by the velocity fluctuation  $u'$, integral length scale
 $l = u'^{3}/\epsilon$ based on the mean dissipation rate
 $\epsilon$ of the turbulent kinetic energy
 $k$, and kinematic viscosity
 $\nu$, which all evolve in time. The eddy turnover time
 $\tau =k/\epsilon$ is taken to represent a characteristic time for the motion of the largest scales. The relevant Reynolds number characterizing turbulence is
 ${Re}_{\lambda }=u' \lambda /\nu$, based on the transverse Taylor micro-scale
 $\lambda ^{2} = 15 \nu u'^{2}/ \epsilon$.
All characteristic scales of turbulence are evaluated with samples gathered in the volume occupied by the reactants only. Fluctuations are evaluated by subtracting the mean from the instantaneous field and the mean is obtained by averaging along spherical shells as appropriate (see § 4.3). As turbulence decays freely while the flame propagates, the ratios  $u'/S_L$ and
 $l/\delta _L$ vary in time, as shown in figure 2. It is apparent that
 $u'/S_L$ decreases as time progresses, while
 $l/\delta _L$ increases slightly. The Karlovitz number decreases to
 ${Ka} \approx 4$. According to the Borghi–Peters classification (Peters Reference Peters2000), all turbulent premixed flames belong to the flamelet regime.
Instantaneous values of  $u'/S_L$ and
 $l/\delta _L$ on the Borghi–Peters diagram of turbulent premixed combustion (Peters Reference Peters2000):
 $R1$ (
 $\bigcirc$),
 $R2$ (
 $\square$),
 $R2a$ (
 $\Diamond$) and
 $R3$ (
 $\triangle$). The arrow points in the direction of increasing time. Also shown are lines of constant
 ${Re}_{\lambda } = u'\lambda /\nu$ and
 $Ka = \tau _L/\tau _{\eta }$.

The computational domain is a cube with side of length  $2 L$. For reasons that will become clear later, we define the radius of a sphere, whose volume is equal to that of the cubic domain,
 $R_L = 2 (3/4{\rm \pi} )^{1/3} L \approx 1.24L$. It is apparent from table 1 that the size of the computational domain is large compared to the integral length scale. For example,
 $2R_L/l \geqslant 30$ across all simulations. In particular, the extent of the domain is much larger than typically required for DNS of isothermal homogeneous isotropic turbulence at the same Reynolds number.
Because the computational domain is large, the extent of the flame's surface may be initialized (and later grow to be) large compared to the integral length scale  $l$. Although a rigorous quantitative definition will be given later in the article, the term ‘extent’ refers to
 $R$, the mean of the surface averaged radial distance of the turbulent flame from the centre of the domain. Since
 $R \gg l$ throughout the evolution of the flame, the flame is wrinkled by many eddies, the statistics are converged and spherically symmetric, and the flame remains centred in the middle of the domain (see § 4.3).
The fact that the flame is large compared to the integral scale of the flow allows for motions over the entire turbulent spectrum to interact with the surface and affect its evolution. In other words, the entire spectrum of turbulence contributes to flame wrinkling, folding and stretching. As articulated by Chaudhuri et al. (Reference Chaudhuri, Akkerman and Law2011), if the integral scale were larger than the spherical flame, it is reasonable to expect that the flame's linear extent would act as a cut-off scale, limiting the interaction between the flame and turbulence to those scales smaller than the flame itself.
In keeping with the requirement that the initial flame kernel be large compared to the integral scale, the radius of the spherical kernel of burnt gases at the onset of the simulations  $R_0$ is rescaled to be consistent with
 $l$, so that the ratio
 $2R_0/l \approx 7$ remains approximately constant across configurations. On the other hand, the domain size
 $R_L/l$ varies across simulations, although it is always large as discussed.
Two additional simulations, denoted by  $R2a$ and
 $R3s$, were conducted. Simulation
 $R2a$ features the same initial Reynolds number as
 $R2$, but the fluctuation
 $u'$ is lower, matching that of
 $R1$ and lowering the Karlovitz number. Comparisons between
 $R1$,
 $R2a$ and
 $R2$ explore the dependence of the turbulent burning rates on
 $u'/S_L$,
 $l/\delta _L$ and
 ${Re}_{\lambda }$. Moreover, in order to investigate the effect of domain size on the propagation of the turbulent spherical premixed flame, simulation
 $R3$ was repeated with a domain of half the size and labelled
 $R3s$. Simulation
 $R3s$ showed that the domain size
 $R_L/l$ does not have any noticeable affect on the statistics pertaining to the evolution of the flame surface, although the size does affect the mean radial velocity induced by combustion (see § 4.3).
3.1. Initial conditions and turbulence decay
The initial homogeneous isotropic turbulence (HIT) is generated as follows. First, preliminary HIT simulations at the target  ${Re}_{\lambda }$ are performed with the linear forcing scheme of Rosales & Meneveau (Reference Rosales and Meneveau2005). Second, the velocity and dimensions are scaled to obtain the desired values of
 $u'$ and
 $l$ and several independent realizations of the velocity field are patched together into a larger domain. The motivation for patching boxes of homogeneous isotropic turbulence, rather than simulating fluid flow in the larger box, is due to a well-known outcome of the forcing scheme, i.e. when a statistically stationary state is attained, the integral scale
 $l$ is approximately 20 % of the side of the cubic domain. Discontinuities in the velocity field across patches disappeared upon advancing the state over
 $2\tau _{\eta }$.
This patching strategy does not compromise the evolution of turbulence during decay as shown by previous studies (Albin Reference Albin2010; Albin & D'Angelo Reference Albin and D'Angelo2012) and all turbulence statistics are consistent with the theory of decaying turbulence. In particular, the decay of the turbulent kinetic energy follows the power law (Batchelor & Townsend Reference Batchelor and Townsend1948a,Reference Batchelor and Townsendb; Sinhuber, Bodenschatz & Bewley Reference Sinhuber, Bodenschatz and Bewley2015),
 \begin{equation} k/k_0 = (1 + t/t_0)^{-n}, \end{equation}
where  $t_0$ is the virtual origin,
 $k_0$ the turbulent kinetic energy at
 $t = 0$ and
 $n$ is the decay exponent.
Experimentally,  $n$ is found to lie between 1 and 1.5. For decaying turbulence behind passive grids, Batchelor & Townsend (Reference Batchelor and Townsend1948a) find
 $n=1$, Comte-Bellot & Corrsin (Reference Comte-Bellot and Corrsin1971) report
 $1.16 \leqslant n \leqslant 1.37$, while Baines & Peterson (Reference Baines and Peterson1951) find a higher value of
 $n = 1.43$. Mohamed & Larue (Reference Mohamed and Larue1990) report that
 $n = 1.25$ fitted their data best. Here, instead of fitting the parameters in (3.1) directly, we use the expression for the eddy turnover time
 \begin{equation} \tau = k/\epsilon = t_0/n(1+t/t_0) = t_0/n + t/n, \end{equation}
so that  $n$ and
 $t_0=n\tau _0$ are related to the slope and intercept of a least-squares fit to
 $\tau (t)$.
Figure 3(a) shows fits and power laws for  $k/k_0$ and
 $\epsilon /\epsilon _0$. In all simulations we find
 $n = 1.55$, which is slightly higher than the values reported in the literature. This discrepancy may be due to the low Reynolds number of our configurations or the dependence of the exponent on geometry, which differs between grid generated turbulence and simulations of homogeneous isotropic decaying turbulence.
Statistics of the decaying turbulence in the reactants. (a) Exponential decay of turbulent kinetic energy  $k/k_0$ and its mean rate of dissipation
 $\epsilon /\epsilon _0$ versus
 $1+t/t_0$, where
 $t_0 = n\tau _0$. Lines represent power law expressions with
 $n=1.55$. (b) Evolution of
 ${Re}_{\lambda } = u'\lambda /\nu$. Lines represent decay in isothermal simulations, symbols represent data from reactive simulations:
 $R1$ (
 $\bigcirc$),
 $R2$ (
 $\square$),
 $R2a$ (
 $\Diamond$),
 $R3$ (
 $\triangle$) and
 $R3s$ (
 $\triangledown$).

Figure 3(b) compares the decay of Reynolds number in reactive and isothermal simulations from the same initial conditions. Statistics in the isothermal simulations are consistent with the power law decay, while in the reactive simulations, the changes in the background pressure and temperature cause minor deviations. While higher pressure and temperature lead to modifications to the density and the viscosity of the mixture, they are minor on the account of the fact that the maximum pressure rise is less than 20 % across all simulations. Further, the differences at the end of the simulations are due in part to a decreasing number of samples available for statistics, since the reactants occupy a region that decreases in volume as time progresses. We conclude that, apart from minor differences that become more apparent at later times, the presence of a propagating flame does not change the decay of turbulence.
Finally, we notice that the data for simulations  $R3$ and
 $R3s$ prove that changes in the domain size do not have any noticeable effect on the statistics of decaying turbulence with or without a propagating flame.
4. Overview of the evolution of the turbulent premixed flames
4.1. Basic definitions
Within the scope of the present study, the flame surface corresponds to an isosurface of the reaction progress variable  $C(\boldsymbol {x},t)=c^{*}$, which is defined as
 \begin{equation} C = 1 - \frac{Y_{{\textrm{O}_{2}}} - Y^{b}_{{\textrm{O}_{2}}}}{Y^{u}_{{\textrm{O}_{2}}} - Y^{b}_{{\textrm{O}_{2}}}}, \end{equation}
where  $Y_{\textrm {O}_{2}}$ is the mass fraction of molecular oxygen and
 $Y^{u}_{{\textrm {O}_{2}}}$ and
 $Y^{b}_{{\textrm {O}_{2}}}$ are the mass fraction of oxygen in the reactants and products, respectively. We let the iso-level
 $c^{*} = 0.73$ define the flame surface. This particular value of the progress variable corresponds to the maximum value of the heat release rate, which is taken to mark the middle of the reaction zone. The normal to the flame surface is
 $\boldsymbol {n} = - \boldsymbol {\nabla } C/|\boldsymbol {\nabla } C|$, such that it points into the reactants. The flame propagates in the direction of the normal with a displacement speed
 $S$ relative to the local fluid velocity, given by (Pope Reference Pope1988; Chakraborty & Cant Reference Chakraborty and Cant2005)
 \begin{equation} S = \frac{1}{\lvert\boldsymbol{\nabla} C\rvert}\frac{\textrm{D} C}{\textrm{D}t} = \frac{1}{\lvert\boldsymbol{\nabla} C\rvert} \left( \frac{\partial C}{\partial t} + \boldsymbol{u}\boldsymbol{\cdot} \boldsymbol{\nabla} C\right). \end{equation}
The displacement speed is calculated from the progress variable field as follows. The temporal derivative  $\partial C/\partial t$ is computed at the intermediate time
 $t_{1/2} = t_n + {\rm \Delta} t/2$ with a central finite difference formula based on two solutions at
 $t_n$ and
 $t_{n+1}=t_n+{\rm \Delta} t$. The velocity and scalar fields are interpolated linearly in time to
 $t_{1/2}$, the staggered velocity components are interpolated linearly onto the centred grid used for the progress variable scalar field, and a high-order central finite difference formula is used to evaluate the gradient of
 $C$.
The displacement speed is calculated based on the material derivative instead of the sum of the reactive and diffusive terms for the sake of computational convenience. The use of mixture-averaged diffusion models make the numerical evaluation of the diffusive term cumbersome. Also, the operator splitting approach coupled with the semi-implicit time advancement leads to the evaluation of the reactive and diffusive terms at different physical times, leading to ambiguity. Conversely, the solution field  $C(\boldsymbol {x},t)$ is accurate to the method's order at each discrete time step.
4.2. The evolution of the turbulent premixed flames
Figure 4 illustrates the evolution of the turbulent spherical premixed flame during simulations  $R1$,
 $R2$ and
 $R3$. The surface of the flame is visualized by the isosurface
 $C(\boldsymbol {x},t)=c^{*}$, which marks the thin reaction zone of the flame. The flame, which is initialized as a spherical kernel of products centred in the middle of the computational domain, propagates radially outwards into the premixed reactants. Movies of the propagating flames are provided in the supplementary material available at https://doi.org/10.1017/jfm.2020.784.
Instantaneous flame surface shown at various dimensionless times for the simulations  $R1$,
 $R2$ and
 $R3$. The Reynolds number increases from top to bottom, while the simulation time increases from left to right. Since
 $\tau _{\eta }^{0}$ is the same for all three simulations, the flame surface is compared at the same physical time across simulations. The physical dimension is the same for all three flames also.

It is apparent that the flame surface is wrinkled and folded by turbulence as the flame propagates. Most patches of the flame surface are flat or posses only a slight curvature. Regions of high curvature are much less prevalent and appear as sharp cylindrical folds, while cusps are infrequent. These qualitative observations are consistent with established topological features of the surface of turbulent premixed flames (Cifuentes et al. Reference Cifuentes, Dopazo, Martin and Jimenez2014). If the flames are compared at times when they are of similar size, the flame at the greatest value of the Reynolds number ( $R3$) displays the highest density of folds and wrinkles. This is consistent with the qualitative interpretation that scale separation increases with increasing Reynolds number.
As reactants are converted into products inside the closed domain, the background pressure increases, leading to an increase in the reactants’ temperature  $T_u$ also. The compression is isentropic. The simulations terminate when the mass fraction of burnt gases is less than 25 % of the total, such that the effect of periodic boundary conditions is negligible. This ensures a small change in
 $T_u$ (
 ${\leqslant }3\,\%$) and
 $p$ (
 ${\leqslant }20\,\%$) for all simulations. Such small changes in pressure and temperature lead to negligible changes in the laminar flame speed
 $S_L$ (
 ${\leqslant }1\,\%$) and flame thickness
 $\delta _L$ (
 ${\leqslant }10\,\%$).
4.3. Mean velocity field
The statistical analysis that follows assumes flow ergodicity in the polar and azimuthal coordinates, allowing to gather samples on spherical shells from one simulation. Indeed, one expects that the statistics of the flame surface are spherically symmetric far from the periodic boundaries. Verification of such symmetry is thus critical to the analysis and is explored here briefly for the mean velocity field.
Away from the flame brush, the density field is homogeneous and the general solution of the Reynolds averaged continuity equation for a closed domain reads as
 \begin{equation} \langle u_r\rangle = - \frac{1}{3\gamma} \frac{1}{p} \dfrac{\textrm{d}p}{\textrm{d}t} r + C_1 r^{-2}, \end{equation}
where  $u_r = \boldsymbol {u}\boldsymbol {\cdot }\boldsymbol {e}_r$ is the radial component of velocity and
 $C_1$ is a constant. The first term in the equation above arises from the evolution of the reactants’ and products’ densities due to compression, which is found to be isentropic. In the region occupied by products,
 $C_1=0$ since
 $\langle u _r\rangle =0$ at
 $r=0$, yielding
 \begin{equation} \langle u_r\rangle = - \frac{1}{3 \gamma_b} \frac{1}{p} \dfrac{\textrm{d}p}{\textrm{d}t} r, \end{equation}
where  $\gamma _b$ is the ratio of specific heats of the burnt gases. Equation (4.4) shows that
 $\langle u _r\rangle$ is negative (
 $\textrm {d}p/\textrm {d}t>0$) and varies linearly with
 $r$ in the burnt gases.
At the domain boundary, the velocity is zero due to periodicity, but the boundaries’ radial location depends on the polar and azimuthal coordinates on the account of the domain being a cube. Yet, since the mean radial velocity decreases as  $1/r^{2}$, one expects the effect of geometry on the radial velocity to be negligible away from the boundary. Consequently, boundary conditions are imposed at an effective radial distance
 $R_L$, defined as the radius of a sphere with volume equal to that of the cubic domain
 \begin{equation} R_L = 2 (3/4{\rm \pi})^{1/3} L. \end{equation}
Then, the mean radial velocity component in the reactants reads as
 \begin{equation} \langle u_r\rangle = - \frac{ R_L }{3\gamma_u}\frac{1}{p}\dfrac{\textrm{d}p}{\textrm{d}t} \left[ \frac{r}{R_L} - \left( \frac{r}{R_L}\right)^{-2} \right], \end{equation}
where  $\gamma _u$ is the ratio of specific heats of the reactants.
Figure 5 shows  $\langle u _r\rangle$ at five instants in time during the
 $R2$ simulation. The mean is obtained by averaging over
 $\varTheta$ and
 $\varPhi$. The mean radial velocity matches the expressions in (4.6) and (4.6) closely at radial locations occupied by either products or reactants and away from the brush. In particular, on the reactants’ side, the theoretical expression for
 $\langle u _r\rangle$ is identical to the data from the simulation up to
 $r/L=1.0$ (or
 $r/R_L = 0.8$), which corresponds to the minimum distance between the centre and the faces of the cubic domain. We conclude that the mean flow retains spherical symmetry as if the computational domain were a spherical vessel with radius
 $R_L$.
Reynolds averaged radial velocity  $\langle u _r\rangle$ normalized by the initial turbulence intensity for simulation
 $R2$. Data at five times:
 $t/\tau _0=1.50$ (
 $\ast$),
 $2.23$ (
 $\bigcirc$),
 $3.35$ (
 $\square$),
 $4.10$ (
 $\triangle$) and
 $5.20$ (
 $\Diamond$). Thin lines represent the expressions in (4.4) and (4.6) evaluated with the instantaneous value of
 $p^{-1} \textrm {d}p/\textrm {d}t$. Data for
 $r/R_L \leqslant 0.8$ (
 $r/L \leqslant 1$), which corresponds to the minimum distance from the centre to the boundary.

The peak mean radial velocity within the brush increases at first. As the flame grows in size, boundary conditions cause the peak mean radial velocity to decrease due to confinement effects. The evolution of the peak mean radial velocity is qualitatively similar to that of the mean radial velocity at the leading edge of the brush, where (4.6) is applicable. While  $1/p \, \textrm {d}p/\textrm {d}t$ increases continuously in time, the term inside the square brackets decreases as
 $R/R_L$ increases and the product of the two is non-monotonic giving rise to the behaviour in figure 5. This conclusion is supported further by the observation that the peak mean radial velocity increases continuously for case
 $R3$, whereas it shows a non-monotonic behaviour for case
 $R3s$, which has a domain of half the size (not shown).
In the remainder of this article, turbulent statistics are assumed to be spherically symmetric and statistics are gathered accordingly.
5. Turbulent burning velocity, area ratio and correction factor
The relation between the flame's area and the fuel burning rate is of paramount importance to the understanding of the role of scale separation in turbulent premixed combustion applications.
The dimensionless turbulent burning velocity  $S_T/S_L$ is defined based on the mean volumetric fuel burning rate
 $\varOmega _f$ and a suitable reference area
 $A^{*}$,
 \begin{equation} \frac{S_T}{S_L} = \frac{ \varOmega_f}{\rho_u Y_f S_L A^{*} }, \end{equation}
where  $\rho _u$ is the reactants’ density and
 $Y_f$ the mass fraction of the fuel in the reactants.
The mean volumetric fuel burning rate is  $\varOmega _f(t) \equiv \langle \tilde {\varOmega }_f(t)\rangle$, where the brackets indicate statistical expectation and
 $\tilde {\varOmega }_f(t)$ is a random process representing the instantaneous volumetric burning rate at time
 $t$. Similarly, we define the mean flame radius
 $R(t) \equiv \langle \tilde {R}(t)\rangle$, which is referred to simply as flame radius henceforth, and reference area
 $A^{*} = 4{\rm \pi} R^{2}$. The random process
 $\tilde {R}(t)$ is the instantaneous surface averaged radial distance of the flame surface from the centre of the domain. Finally, we define the mean of the flame surface area
 $A(t) \equiv \langle \tilde {A}(t)\rangle$ as the expectation of the random process
 $\tilde {A}(t)$, which is the instantaneous flame area at time
 $t$.
Formal definitions of  $\varOmega _f(t)$,
 $R(t)$ and
 $A(t)$ are provided later in this section, while a comprehensive discussion of the relation between the random processes and their expectations is given in appendix A.
The dimensionless turbulent burning velocity may be written as a product of two quantities as
 \begin{equation} \frac{S_T}{S_L} = \frac{\varOmega_f}{\rho_u Y_f S_L A} \frac{A}{A^{*}} = \mathcal{I} \chi, \end{equation}
where  $\mathcal {I} = \varOmega _f / (\rho _u Y_f S_L A)$ is a correction factor and
 $\chi = A/A^{*}$ is the area ratio. In the thin reaction zone regime,
 $\mathcal {I} \approx 1$,
 $\chi \gg 1$, and the area ratio controls the enhancement of turbulent burning rates as quantified by the dimensionless turbulent burning velocity
 $S_T/S_L$.
Figure 6 shows the temporal evolution of  $S_T/S_L$,
 $\chi$ and
 $\mathcal {I}$ for the five simulations. We observe that the correction factor
 $\mathcal {I} \approx 1$ as expected. The temporal evolution of the area ratio is qualitatively similar across simulations, in that
 $\chi$ grows rapidly and reaches a plateau afterwards.
Dimensionless turbulent burning velocity  $S_T/S_L$ (
 $\bigcirc$), area ratio
 $\chi$ (
 $\square$) and correction factor
 $\mathcal {I}$ (
 $\triangle$). (a)
 $R1$ with error bars for the area ratio
 $\chi$ representing the variation across four simulations, (b)
 $R2$ (open symbols) and
 $R2a$ (filled symbols) and (c)
 $R3$ (open symbols) and
 $R3s$ (filled symbols).

When measured in units of eddy turnover time  $\tau _0$, the growth in
 $\chi$ lasts approximately
 $2\tau _0$ for all three simulations. The asymptotic value reached by
 $\chi$ for later times is smallest for
 $R1$ (
 $\chi \to 2.8$) and largest for
 $R3$ (
 $\chi \to 4.5$). Comparisons across
 $R3$ and
 $R3s$ indicate that the size of the domain does not affect the burning rates. As discussed later, the same is observed for all other pertinent statistics.
The comparison of turbulent burning rates from  $R1$,
 $R2$ and
 $R2a$ points to the role of the Reynolds number in controlling turbulent burning rates. Simulations
 $R1$ and
 $R2a$ feature the same turbulence intensity
 $u'/S_L$, and yet
 $R2a$ features higher burning rates than
 $R1$. On the other hand, simulations
 $R2$ and
 $R2a$ share the same Reynolds number, differing in both
 $u'/S_L$ and
 $l/\delta _L$, yet they feature identical area ratios
 $\chi$ when plotted versus
 $t/\tau _0$.
In (5.2) and related commentary above,  $\varOmega _f(t)$,
 $R(t)$ and
 $A(t)$ are time dependent expectations of random processes for which suitable estimators must be defined in a manner consistent with the ergodicity of the flow. In this work we adopt the mathematical framework of the flame surface density function (Pope Reference Pope1988; Vervisch et al. Reference Vervisch, Bidaux, Bray and Kollmann1995), which is the expectation of the flame surface area per unit volume and defined formally as
 \begin{equation} \varSigma(r,t) \equiv \langle |\boldsymbol{\nabla} C| \delta(C-c^{*}) \rangle, \end{equation}
where the surface density function  $\varSigma$ only depends on
 $(r,t)$ due to the spherical symmetry of the statistics of
 $C(\boldsymbol {x},t)$ and the norm of its gradient
 $|\boldsymbol {\nabla } C|$. Then, the mean flame surface area and the flame radius are
 \begin{gather} A(t) = \int_V \varSigma \, \textrm{d}V = 4 {\rm \pi}\int_0^{\infty} r^{2} \varSigma(r,t) \, \textrm{d}r, \end{gather}
 \begin{gather}R(t) = \frac{1}{A(t)} \int_V |\boldsymbol{x}| \varSigma \, \textrm{d}V = \frac{4 {\rm \pi}}{A(t)} \int_0^{\infty} r^{3} \varSigma(r,t) \, \textrm{d}r, \end{gather}
since  $|\boldsymbol {x}|=r$. The area ratio
 $\chi$ written in terms of
 $\varSigma$ is
 \begin{equation} \chi(t) = \int_0^{\infty} (r/R)^{2} \varSigma(r,t) \, \textrm{d}r, \end{equation}
using the definitions of  $A(t)$ and
 $A^{*}(t) = 4 {\rm \pi}R(t)^{2}$. The mean volumetric fuel burning rate is
 \begin{equation} \varOmega_f(t) = \int_V \langle \dot{\omega}_f(\boldsymbol{x},t)\rangle \, \textrm{d}V, \end{equation}
where  $\dot {\omega }_f(\boldsymbol {x},t)$ is the instantaneous local rate of consumption of fuel per unit volume.
In the present statistically unsteady flow, there are two manners of estimating expectations: ensemble averaging over  $\mathcal {N}$ repetitions (each simulation at the same nominal conditions providing independent random fields) and spherical averaging over the polar (
 $\varTheta$) and azimuthal (
 $\varPhi$) angles, which are coordinates over which the random fields are ergodic,
 \begin{equation} \varSigma(r,t) \equiv \langle |\boldsymbol{\nabla} C| \delta(C-c^{*}) \rangle \approx \langle \langle |\boldsymbol{\nabla} C| \delta(C-c^{*}) \rangle_{\varTheta \varPhi} \rangle_{\mathcal{N}}, \end{equation}
where  $\langle \cdot \rangle _{\mathcal {N}}$ denotes ensemble averaging and
 $\langle \cdot \rangle _{\varTheta \varPhi }$ denotes spherical averaging, and the
 $\approx$ sign indicates that the right-hand side of (5.8) is an estimate subject to statistical errors.
It is desirable to repeat each simulation  $\mathcal {N}$ times in order to improve statistical convergence. In the present study, we found that
 $\mathcal {N}=1$, i.e. one repetition, was sufficient to obtain rather accurate estimates for the expectations on the account that spherical averages have small variance. This is explained by the fact that the flame radius
 $R$ is large compared to the integral scale of the flow
 $l$ by design.
Repeating simulations was computationally prohibitive, except for the  $R1$ simulation, where the number of grid points was small enough to afford four repetitions at the same nominal conditions. In the rest of this article, all statistical quantities presented for
 $R2$,
 $R2a$ and
 $R3$ rely on one simulation, while statistics for
 $R1$ rely on four simulations. A more comprehensive discussion is included in appendix A.
5.1. Probability density function of radial distance of the flame surface
The remainder of this paper is concerned with the mechanisms responsible for the evolution of the area ratio  $A/A^{*}$ and its differences and similarities across simulations. Before presenting a model for the area ratio and its scaling, it is useful to associate a probability density function (PDF) to the distance of the flame surface, denoted by
 $\mathcal {P}_{\phi }$. Here
 $\phi$ is the random variable representing the radial distance of the flame surface from the origin. With this formalism, the mean flame radius
 $R$ and the thickness of the turbulent brush
 $\delta _T$ can be defined rigorously in terms of the moments of
 $\mathcal {P}_{\phi }$ and their governing equations be derived as shown later.
The expectation of the flame surface area inside a sphere of radius  $\varphi$ is
 \begin{equation} A_{\varphi} = 4 {\rm \pi}\int_0^{\varphi} r^{2} \varSigma(r,t)\, \textrm{d}r, \end{equation}
so that the ratio  $A_{\varphi }/A$ represents the probability
 $\mathbb {P}(\phi < \varphi )$ and describes the cumulative density function associated with
 $\mathcal {P}_{\phi }$. The PDF is obtained by differentiation with respect to the sample space variable
 $\varphi$,
 \begin{equation} \mathcal{P}_{\phi}(\phi = \varphi;t) = \textrm{d}(A_{\varphi}/A)/\textrm{d}\varphi = 4 {\rm \pi}A^{-1} \varphi^{2} \varSigma(r=\varphi,t), \end{equation}
with support  $\varphi \in [0,\infty )$. The mean
 $\mu$ and standard deviation
 $\sigma$ of
 $\phi$ are the mean radial distance and a scaled flame brush thickness:
 \begin{equation} \mu = \langle\phi\rangle = \int_0^{\infty} \varphi \mathcal{P}_{\phi}(\varphi;t)\, \textrm{d}\varphi = 4 {\rm \pi}A^{-1} \int_0^{\infty} r^{3} \varSigma(r,t)\, \textrm{d}r \end{equation}
and
 \begin{equation} \sigma^{2} = \langle ( \phi -\langle\phi\rangle)^{2}\rangle = \int_0^{\infty} ( \varphi -\langle\phi\rangle)^{2} \mathcal{P}_{\phi}(\varphi;t)\, \textrm{d}\varphi = 4 {\rm \pi}A^{-1} \int_0^{\infty} (r - R)^{2} r^{2} \varSigma(r,t)\, \textrm{d}r. \end{equation}
The flame radius and the turbulent brush thickness are defined based on  $\mu$ and
 $\sigma$ as
 $R = \mu$ and
 $\delta _T = \sqrt {2 {\rm \pi}} \sigma$, respectively. The proportionality constant
 $\sqrt {2 {\rm \pi}}$ is included in the definition of
 $\delta _T$ for consistency with the common definition of the flame brush thickness based on the mean gradient of the progress variable
 \begin{equation} \delta_T = \sqrt{2 {\rm \pi}} \sigma \approx 1/max\{ \textrm{d}\langle C\rangle/\textrm{d}r \}, \end{equation}
where  $\langle C \rangle (r,t)$ is the mean progress variable and
 $\textrm {d}\langle C \rangle /\textrm {d}r$ its gradient under the hypothesis of spherical symmetry. The two definitions of the brush thickness are equivalent under the assumption that
 $\mathcal {P}_{\phi }$ is normally distributed around the mean (e.g. see Chapter 4 in Lipatnikov Reference Lipatnikov2012).
The evolution equation for  $\mathcal {P}_{\phi }$ is derived starting from that for the flame surface density function. The flame surface density function
 $\varSigma$ evolves according to (Pope Reference Pope1988; Trouvé & Poinsot Reference Trouvé and Poinsot1994; Vervisch et al. Reference Vervisch, Bidaux, Bray and Kollmann1995)
 \begin{equation} \dfrac{\partial \varSigma}{\partial t} + \frac{1}{r^{2}}\frac{\partial }{\partial r} (\langle u_r + S n_r\rangle_w \varSigma ) = \langle K\rangle_w \varSigma, \end{equation}
where suitable simplifications due to spherical symmetry are made. Here,  $S$ is the displacement speed as defined in (4.2) and
 $u_r$ and
 $n_r$ represent the radial components of the velocity and normal vectors, respectively. The operator
 $\langle \cdot \rangle _w$ denotes the gradient weighted or surface average (Pope Reference Pope1988).
The flame stretch  $K = a - 2S\kappa$ contains two contributions: the tangential strain rate
 $a = - \boldsymbol {n}^{T} \boldsymbol {\nabla } \boldsymbol {u} \boldsymbol {n} + \boldsymbol {\nabla } \boldsymbol {\cdot } \boldsymbol {u}$ and the curvature-propagation term
 $- 2 S \kappa = S \boldsymbol {\nabla } \boldsymbol {\cdot } \boldsymbol {n}$. The tangential strain rate depends only on the velocity field
 $\boldsymbol {u}$ and the orientation of the velocity gradient tensor
 $\boldsymbol {\nabla } \boldsymbol {u}$ with respect to the flame normal
 $\boldsymbol {n}$. The curvature term is non-zero only for surfaces that propagate (
 $S\neq 0$) in the presence of curvature (
 $\kappa \neq 0$). In the case of a material surface,
 $K=a$ and surface stretch is due to tangential strain alone.
The rate of change of  $A$ is solely due to the stretch term of (5.14), as the volumetric integrals of the convective and propagation terms on the left-hand side are zero. The logarithmic time rate of change of the area
 $= (1/A) \,\textrm {d}A/\textrm {d}t$ is therefore called the global stretch and denoted by
 $K_G$.
In light of (5.10), the rate of change of  $\mathcal {P}_{\phi }$ reads as
 \begin{equation} \partial\mathcal{P}_{\phi}/\partial t = \left(4{\rm \pi} r^{2}/A\right) \left\{ \partial \varSigma/\partial t - (\varSigma/A) \, \textrm{d}A/\textrm{d}t\right\}. \end{equation}
Substituting  $\partial \varSigma /\partial t$ from (5.14) into (5.15) and simplifying, we obtain the evolution equation for the PDF
 \begin{equation} \partial \mathcal{P}_{\phi}/\partial t = -\partial/\partial r \left\{ \langle u_r + S n_r\rangle_w \mathcal{P}_{\phi}\right\} + (\langle K\rangle_w - K_G) \mathcal{P}_{\phi}. \end{equation}
5.2. Characterization of  $\mathcal {P}_{\phi }$ and $\varSigma$


The mathematical framework presented in § 5.1 demonstrates that the mean area  $A$, mean radius
 $R$, turbulent flame brush
 $\delta _T$ and area ratio
 $\chi$ are related functionally to the surface density function
 $\varSigma$. Further, (5.10) points to an equivalence between
 $\varSigma$ and the probability density function
 $\mathcal {P}_{\phi }$.
The temporal evolution of the flame radius and the turbulent flame brush thickness is shown in figure 7.
Evolution of (a) mean flame radius and (b) flame brush thickness for various simulations. The mean flame radius is normalized by the initial kernel size  $R_0$, while the brush thickness is normalized with the initial integral length scale
 $l_0$:
 $R1$ (
 $\bigcirc$),
 $R2$ (
 $\square$),
 $R2a$ (
 $\Diamond$),
 $R3$ (
 $\triangle$) and
 $R3s$ (
 $\triangledown$). Error bars shown for
 $R1$ simulation represent the sample variance based on four realizations.

The onset of a linear growth phase occurs at  $t/\tau _0 \approx 1$ for all configurations and the non-dimensional growth rate
 $R_0^{-1} \tau _0 \,\textrm {d}R/\textrm {d}t$ differs, being greatest for
 $R3$ and smallest for
 $R1$. The flame brush
 $\delta _T/l_0$ increases monotonically in time across simulations as shown in figure 7(b) and similar across simulations, which is a result of the scaling of the flame brush thickness with the integral length scale of the flow as discussed later in § 6.1.
The PDF  $\mathcal {P}_{\phi }$ is closely approximated by a Gaussian distribution. This is demonstrated in figure 8, which shows
 $\mathcal {P}_{\phi }$ at four times for three simulations. Here we plot the PDF normalized by
 $\sigma$ and against
 $\vartheta$, a sample space variable of the normalized brush coordinate
 $\theta = (\phi -\mu )/\sigma$. It is apparent that
 $\sigma \mathcal {P}_{\phi }$ is well described by a standard normal distribution
 $\mathcal {N}(0,1)$, consistently with previous data reported in the literature for various flame configurations (Lipatnikov & Chomiak Reference Lipatnikov and Chomiak2002). The inset shows that the tails of the PDF are also well approximated by the normal distribution, although the comparison becomes less satisfactory for
 $|\vartheta |>2$, possibly due to statistical convergence.
(a) Representative planar slices of the instantaneous flame surface for simulation  $R2$ at
 $t/\tau _0 = 4.2$. Here
 $x_1\text {--}x_2$ denotes a quadrant of the Cartesian planes
 $x\text {--}y$,
 $y\text {--}z$ and
 $x\text {--}z$. The mean flame radius (thick red line) and several
 $C = c^{*}$ isocontours (thin black lines) are shown alongside the shaded region
 $r=R \pm \sigma$. Also shown in (b) and (c) is the
 $\sigma \mathcal {P}_{\phi }$ at four times for simulations
 $R1$ (
 $\bigcirc$),
 $R2$ (
 $\square$) and
 $R3$ (
 $\triangle$) with the standard normal distribution for comparison (thick black lines).

Figure 9 shows  $\varSigma$ at select times for simulations
 $R1$,
 $R2$,
 $R3$ and
 $R2a$. The surface density function (SDF) is shown normalized by the initial thermal thickness
 $\delta _L^{0}$ and plotted versus
 $r/R_L$, where
 $R_L$ is the effective domain radius (see table 1). The SDF is transported radially outward, broadens, and its maximum value
 $\varSigma _m$ decreases with time. This behaviour is common across all cases. The broadening of
 $\varSigma$ is consistent with the increase in the flame brush and with experimental observations of spherical turbulent premixed flames evolving in freely decaying turbulence (Renou et al. Reference Renou, Mura, Samson and Boukhalfa2002; Fries et al. Reference Fries, Ochs, Saha, Ranjan and Menon2019). Since the area ratio
 $\chi$ is related to the volumetric integral of
 $\varSigma$, broadening appears to be closely related to the observed increase of
 $\chi$ in time. Yet, the peak of
 $\varSigma$ decreases in time, so that a more quantitative analysis is in order.
Surface density function at select times for (a)  $R1$, (b)
 $R2$, (c)
 $R3$ and (d)
 $R2a$. The normalized time
 $t/\tau _0$ is shown next to each profile. The surface density distribution broadens and the peak reduces as the time progresses. Symbols denote evaluation of
 $\varSigma$ using the definition directly, while solid lines show surface density estimation based on (5.10) and a normal distribution model for
 $\mathcal {P}_{\phi }$.

Using a Gaussian distribution as a model for  $\mathcal {P}_{\phi }$, the surface density function is obtained according to (5.10) and shown in figure 9 also. The surface density function
 $\varSigma$, obtained assuming that
 $\mathcal {P}_{\phi }$ is a normal distribution, is compared to its direct evaluation from the gradient of the progress variable. The comparison is very satisfactory, indicating that the two methodologies are consistent and further validating our approach. Nonetheless,
 $\varSigma$ computed from conditional statistics displays residual statistical noise, and, therefore, we rely on the model to analyse the peak value
 $\varSigma _m$ of the surface density function.
5.3. Model for the area ratio
We begin by noting that the surface density function admits a local maximum at radial location  $\hat {r}$, which is the root of the equation
 \begin{gather} \left. \frac{\partial \varSigma}{\partial r}\right|_{r=\hat{r}} = -2 \mathcal{P}_{\phi}(\hat{r})/\hat{r}^{3} + \mathcal{P}'_{\phi}(\hat{r})/\hat{r}^{2} = 0, \end{gather}
 \begin{gather}2 \mathcal{P}_{\phi}(\hat{r}) - \hat{r} \mathcal{P}'_{\phi}(\hat{r}) = 0, \end{gather}
where we let  $\mathcal {P}'_{\phi }$ indicate the derivative with respect to
 $\varphi$. Based on (5.10), the maximum value attained by the surface density function is
 \begin{equation} \varSigma_m \equiv \varSigma(\hat{r},t) = (4 {\rm \pi})^{-1} A \frac{\mathcal{P}'_{\phi}(\hat{r})}{2\hat{r}} = (4 {\rm \pi})^{-1} A \frac{\mathcal{P}_{\phi}(\hat{r})}{\hat{r}^{2}}. \end{equation}
Substitution of (5.10) and (5.19) into (5.6) gives
 \begin{equation} \chi = \varSigma_m \delta_T \beta; \quad \beta = \frac{1}{ \mathcal{P}_{\phi}(\hat{r}) \delta_T } \left( \frac{ \hat{r}}{R} \right)^{2}. \end{equation}
Here  $\beta$ is a shape factor related solely to the functional form of
 $\mathcal {P}_{\phi }(\varphi;t)$. Equation (5.20a,b) illustrates that the area ratio
 $\chi$ is proportional to the product of the maximum value of the surface density function, the thickness of the flame brush and a shape factor.
As shown in figure 8,  $\mathcal {P}_{\phi }(\varphi; t)$ is well approximated by a normal distribution. On the account that
 $\mathcal {P}_{\phi }$ is defined in
 $[0,\infty )$, a truncated normal distribution with parameters
 $\bar {\mu }$ and
 $\bar {\sigma }^{2}$ (Johnson, Kotz & Balakrishnan Reference Johnson, Kotz and Balakrishnan1994) is required formally, rather than a normal distribution with infinite support
 $\varphi \in (-\infty ,\infty )$. However, we find that for all simulations,
 $\bar {\mu } \geqslant 3 \bar {\sigma }$ (see figure 8), so that
 $\bar {\mu } \approx \mu$,
 $\bar {\sigma }^{2} \approx \sigma ^{2}$, and the normalization factor
 $Z=1-F(-\bar {\mu }/\bar {\sigma }) \approx 1$, where
 $F(z)$ is the cumulative distribution function of the standard normal distribution.
Thus, for all practical purposes, the truncated normal distribution and the underlying normal distribution are identical on the account of the negligible probability of  $\phi$ taking negative values. For simplicity, we ignore the small differences arising from the truncated sample space at
 $\varphi = 0$ and model
 $\mathcal {P}_{\phi }$ as a normal distribution with parameters
 $\mu =R$ and
 $\sigma ^{2} = \delta _T^{2}/(2{\rm \pi} )$. This results in the following root of (5.18):
 \begin{equation} \hat{r} = 2 \mathcal{P}_{\phi}(\hat{r})/\mathcal{P}'_{\phi}(\hat{r}) = R \left(1 + \sqrt{1-8\alpha^{2}}\right)/2. \end{equation}
Here  $\alpha = \sigma /\mu$ (
 $\alpha \leqslant 0.33$ for all times and simulations) is the relative standard deviation of the radial distance. Substituting (5.21) into (5.20b), the shape factor reads as
 \begin{equation} \beta = \beta(\alpha) = 0.25 (1 + \sqrt{1 - 8\alpha^{2}})^{2} \exp\left\{\alpha^{2} (\sqrt{1 - 8\alpha^{2}} -1)^{2}/8 \right\}. \end{equation}
Equation (5.22) indicates that the shape factor is a monotonic function of  $\alpha$. For
 $\alpha \to 0$,
 $\beta \to 1$ and decreases as
 $\alpha$ increases. For all simulations and times, we find that
 $0.875 \leqslant \beta \leqslant 1$.
Together with the fact that  $\beta \approx 1$, (5.20a) illustrates that the area ratio
 $\chi$ is equal to the product of the maximum value of the surface density function
 $\varSigma _m$ and the thickness of the flame brush
 $\delta _T$. The temporal evolution of these two quantities across simulations with varying Reynolds number is explored closely in the remainder of the paper.
6. Scaling of the area ratio in spherical turbulent premixed flames
6.1. Scaling of the turbulent flame brush thickness
As defined in (5.13), the flame brush thickness  $\delta _T(t)$ is a statistical measure of the distance of the flame surface from its mean location. The brush thickness grows from zero as time progresses and turbulence wrinkles the flame (figure 7b).
Under rather stringent assumptions and important approximations, Taylor's theory of turbulent diffusion has been applied to the evolution of the flame brush thickness (Lipatnikov & Chomiak Reference Lipatnikov and Chomiak2002). First, the flame surface is assumed to evolve as a collection of infinitesimal material surface elements and the variance of the distance of the surface elements from their mean location is taken to represent the brush thickness. Second, turbulence is assumed to be homogeneous and isotropic, although not necessarily stationary. Under these assumptions, the rate of change of the variance of the distance is
 \begin{equation} \textrm{d} \sigma^{2}/\textrm{d}t = 2 u'(t) \int_0^{t} u'(p) f_L(p,t) \,\textrm{d}p, \end{equation}
where  $f_L$ denotes the Lagrangian velocity autocorrelation function and
 $u'(t)$ is the turbulence intensity at time
 $t$. For stationary turbulence, (6.1) is integrated assuming that the autocorrelation function is exponential (Hinze Reference Hinze1975) to give
 \begin{equation} \sigma^{2}/l^{2} = 2 \tilde{t} \{ 1 - \tilde{t}^{-1} [ 1 - \exp (-\tilde{t})] \}, \end{equation}
where  $\tilde {t}=t/\tau ^{{\dagger} }$ and
 $\tau ^{{\dagger} } = l/u'$ is a constant reference time scale. The short and long time behaviours described by (6.2) are
 $\sigma ^{2} \sim t^{2}$ for
 $t \ll \tau ^{{\dagger} }$ and
 $\sigma ^{2} \sim t$ for
 $t \gg \tau ^{{\dagger} }$, respectively.
The short time limit has been shown to explain reasonably well the early and near-field evolution of the brush for various experimental and numerical flame configurations, including spherically expanding flames and turbulent Bunsen flames (Lipatnikov & Chomiak Reference Lipatnikov and Chomiak2002). For spatially inhomogeneous turbulent flows with a dominant direction, a convective time related to distance is used in place of time. This model suggests that the flame brush thickness scales with large, energy-containing scales of turbulence, since the ratio  $\sigma /l$ is a function of the normalized time
 $t/\tau ^{{\dagger} }$ alone.
Minor adjustments to (6.1) and (6.2) are required for spherical expanding flames in decaying turbulence. Firstly, the brush thickness is defined in terms of the variance of the radial distance, so that only the radial component of the velocity vector along the Lagrangian trajectories should be considered. Since the radial direction varies along a Lagrangian trajectory, the integrand includes an orientation factor also and reads as
 \begin{equation} \textrm{d} \sigma^{2}/\textrm{d}t = 2 u'(t) \int_0^{t} u'(p) f_L(p,t) \langle \cos \alpha_{p,t} \rangle\,\textrm{d}p, \end{equation}
where the orientation factor  $\langle \cos \alpha _{p,t} \rangle$ is the expectation of
 $\alpha _{p,t}$, the angle between two position vectors on a Lagrangian trajectory at times
 $p$ and
 $t$. The derivation of (6.3) is presented in appendix B.
Since  $\cos \alpha _{p,t} \leqslant 1$, (6.1) overestimates the rate of change of the brush thickness compared to (6.3). Nonetheless, the correction is small if the lateral movement on a Lagrangian trajectory during temporal intervals for which the velocity remains correlated is small compared to the radial distance of the material point. A comprehensive analysis of the orientation factor requires an investigation of Lagrangian statistics and is outside the scope of the present study. Thus, we interpret (6.1) as an upper bound on the rate of change of the brush thickness in spherically expanding flames as approximated by Taylor's theory of turbulent diffusion.
A second aspect is related to the fact that turbulence in not stationary, rather it decays in time. Batchelor & Townsend (Reference Batchelor, Townsend, Batchelor and Davies1956) postulated that the Lagrangian velocity autocorrelation in decaying isotropic turbulence is self-similar and argued that, if the decay of the turbulent kinetic energy follows a power law (see § 3.1), there exits a characteristic time scale  $\tau _s$ for which
 $u(t) (1+t/t_0)^{-n/2}$ is a stationary random variable in the transformed time coordinate
 $s$, defined so that
 $\textrm {d}s = \textrm {d}t/\tau _s$. Batchelor & Townsend (Reference Batchelor, Townsend, Batchelor and Davies1956) suggested
 $\tau _s = t+t_0$, which was supported later by Huang & Leonard (Reference Huang and Leonard1995) based on a model spectrum of the Lagrangian velocity autocorrelation at high Reynolds numbers. Letting
 $s = \log (1+t/t_0)$ with
 $t_0=n\tau _0$, all length and velocity scales in decaying turbulence are exponential functions of
 $s$. Further, as shown by Huang & Leonard (Reference Huang and Leonard1995), the Lagrangian autocorrelation function depends on the lag between two transformed time coordinates, i.e.
 $f_L(t_1,t_2) = f_L(s_1-s_2)$. The methodology for the estimation of the parameters
 $t_0$ and
 $n$ was outlined in § 3.1.
Substituting the expressions for the turbulent kinetic energy (3.1) and eddy turnover time (3.2), the temporal evolution of  $\delta _T^{2}$ reads as
 \begin{equation} \delta_T^{2}/l^{2} = (9 {\rm \pi}n^{2}) \int_0^{s} \textrm{d}p \, \int_0^{p} \textrm{d}q \, f_L(q-p) \exp\{(1-n/2)(p+q-2s)\}. \end{equation}
The factor in front of the integral in the above expression originates from the definition of the eddy turnover time  $\tau = 3l/2u' = 3\tau ^{{\dagger} }/2$ and
 $\tau _s = n\tau$. Equation (6.4) suggests that
 $\delta _T/l = f(s)$ alone and that the instantaneous integral length scale of the flow
 $l$ is the obvious length to normalize the brush thickness
 $\delta _T$.
Figure 10 shows the temporal evolution of the normalized flame brush  $\delta _T/l$ for all simulations alongside the theoretical prediction from (6.4). The expression for the Lagrangian autocorrelation function given in Huang & Leonard (Reference Huang and Leonard1995) was used to evaluate the integrals on the right-hand side of (6.4).
Temporal evolution of the flame brush thickness. (a) Brush thickness normalized by the thermal thickness of the laminar flame,  $\delta ^{0}_L$, versus time normalized by the initial eddy turnover time. (b) Normalized flame brush thickness
 $\delta _T/l$ versus the transformed time coordinate
 $s=\log (1+t/t_0)$, where
 $t_0=n\tau _0$. The solid line shows the expression in (6.4), derived for the dispersion of Lagrangian particles in freely decaying isotropic turbulence with a self-similar power law decay. Symbols identify data from different simulations:
 $R1$ (
 $\bigcirc$),
 $R2$ (
 $\square$),
 $R2a$ (
 $\Diamond$),
 $R3$ (
 $\triangle$) and
 $R3s$ (
 $\triangledown$).

Consistent with the observations in the literature, we report good agreement of the brush thickness with the theory of turbulent diffusion early on ( $s < 0.2$ or
 $t/\tau _0 < 0.5$) and a near collapse across simulations. This agreement is rather remarkable considering that the flame surface is defined based on the isosurface of a reactive scalar and propagates in a variable density and variable properties flow, while Taylor's theory of turbulent diffusion applies to an ensemble of material points convected by an isothermal fluid. Nonetheless, the agreement is best at early times and deviations from theory are apparent later. More importantly, the evolution of
 $\delta _T/l$ appears to saturate towards a limit value, while theory predicts continuous growth even in decaying turbulence.
We briefly address the deviations from the turbulent diffusion theory through the evolution equation for the brush thickness, which is derived next. The evolution equation for the flame brush thickness is readily obtained by taking the second central moment of (5.16) and reads as
 \begin{equation} \dfrac{\textrm{d} \delta_T^{2}}{\textrm{d}t} = 4 {\rm \pi}\int_0^{\infty} \langle u_r + S n_r\rangle_w (r - R)\mathcal{P}_{\phi} \,\textrm{d}r + 2{\rm \pi} \int_0^{\infty} \langle K'\rangle_w (r - R)^{2} \mathcal{P}_{\phi} \,\textrm{d}r , \end{equation}
where  $K'=K-K_G$ is the differential stretch rate. The first term on the right-hand side of (6.5) describes the effect of transport on the brush and consists of contributions by the mean radial velocity, velocity fluctuations and flame propagation.
We decompose the radial velocity as  $u_r = \langle u _r\rangle + u_r'$, where
 $\langle u _r\rangle$ is the unconditional Reynolds average, so that
 $\langle u _r'\rangle _w$ is not zero, and the evolution equation is manipulated to read as
 \begin{align} \dfrac{\textrm{d} \delta_T}{\textrm{d}t} & = (2{\rm \pi}/\delta_T) \int_0^{\infty} \langle u'_r\rangle_w (r - R)\mathcal{P}_{\phi}\,\textrm{d}r + (2{\rm \pi}/\delta_T) \int_0^{\infty} \langle u_r\rangle (r - R)\mathcal{P}_{\phi}\,\textrm{d}r \nonumber\\ & \quad + (2{\rm \pi}/\delta_T) \int_0^{\infty} \langle S n_r\rangle_w (r - R)\mathcal{P}_{\phi}\,\textrm{d}r + ({\rm \pi}/\delta_T) \int_0^{\infty} \langle K'\rangle_w (r - R)^{2} \mathcal{P}_{\phi} \,\textrm{d}r. \end{align}
In the order in which they appear on the right-hand side of (6.6), the terms represent contributions from velocity fluctuations or turbulent transport (term I), transport due to mean radial velocity (term II) and flame propagation (term III), and differential stretch (term IV).
Figure 11 shows  $\textrm {d}\delta _T/\textrm {d}t$ and the four terms on the right-hand side of (6.6). All terms are normalized by the initial turbulence intensity
 $u'_0$. The rate of change of
 $\delta _T$ is positive for all simulations, indicating that the brush grows throughout the evolution of the turbulent flame and the behaviour and contribution of each term is similar across simulations, once normalized by the initial turbulence intensity. As time progresses,
 $\textrm {d}\delta _T/\textrm {d}t$ approaches zero, indicating that the brush thickness reaches a limit value, consistent with the temporal evolution of
 $\delta _T$ in figure 7(b).
Contributions of different mechanisms in (6.6) to the growth of the flame brush thickness:  $\textrm {d}\delta _T/\textrm {d}t$ ——, turbulent transport (term I) —
 $\bigcirc$ —, mean convection and mean propagation (sum of terms II and III) —
 $\cdot$ —, and differential stretch (term IV) —
 $\square$ —. All terms are normalized by the initial turbulence intensity
 $u'_0$. Data shown for (a)
 $R1$, (b)
 $R2$, (c)
 $R3$ and (d)
 $R2a$.

Early in the evolution, turbulent transport (term I) dominates and contributes to the growth of the flame brush. The contribution of term I decreases in magnitude as time progresses due to the decay of turbulence and associated decrease in the fluctuation  $u'$. Throughout the simulations, differential stretch (term IV) is negative, slowing down the rate of growth of the brush. Its magnitude grows in absolute value as time progresses. The sum of terms II (mean velocity) and III (flame propagation) is positive, but of limited importance until much later in all simulations, when
 $u'$ is small.
This analysis demonstrates that the growth rate of the flame brush thickness in this configuration is controlled by the balance between two mechanisms: turbulent transport contributing to the growth of the brush and differential flame stretch impeding the growth. The turbulent flame brush approaches a constant thickness when the two contributions become equal in magnitude, but opposite in sign. We note that despite the deviations, the scaling of  $\delta _T$ with
 $l$ is robust, as the evolution of
 $\delta _T/l$ is nearly the same across different simulations. A quantitative discussion on these mechanisms and their scaling is deferred to a later work.
6.2. Scaling of peak value of the surface density function
Next, we address the variation of the peak value of the surface density function across simulations with varying Reynolds number. The surface density function associated with the isosurface  $C = c$ (Vervisch et al. Reference Vervisch, Bidaux, Bray and Kollmann1995) reads as
 \begin{equation} \varSigma(r,t; c) = \langle |\boldsymbol{\nabla} C| | C = c \rangle \mathcal{P}_C(c; r,t), \end{equation}
where  $\mathcal {P}_C$ is the PDF of the progress variable
 $C$ and angular brackets denote ensemble averaging.
Figure 12(a) shows  $\langle |\boldsymbol {\nabla } C| | C = c \rangle$ as a function of
 $c$ at early times (
 $t/\tau _0 = 0.75$) and towards the end (
 $t/\tau _0 = 5.25$) of simulation
 $R2$. The conditional mean of the gradient is very close to that found across the one-dimensional laminar flame, confirming that the turbulent flames belong to the thin flamelet regime (Peters Reference Peters2000). Furthermore, at each instant, the gradient is normalized by
 $\delta _L^{0}$ in order to highlight that the effect of pressure on the flame structure is minor as the peak value of the gradient changes by 10 % only. Figure 12(b) shows the radial variation of
 $\langle |\boldsymbol {\nabla } C| | C = c^{*} \rangle$ across the brush at
 $t/\tau _0 = 5.25$, indicating that the conditional gradient magnitude grows only very slightly across the brush and may be considered constant for all practical purposes.
Conditional statistics of the gradient magnitude. Data from simulation  $R2$. (a) Conditional mean gradient magnitude from DNS (blue and red lines), one-dimensional laminar flame (black lines) at two different times, normalized by the thermal thickness of the laminar flame
 $\delta _L^{0}$. Data shown at
 $t/\tau _0 = 0.75$ (blue line with open circles) and
 $t/\tau _0 = 5.25$ (red line with open squares). The error bars represent the conditional standard deviation. (b) Radial distribution of the conditional mean gradient magnitude (
 $C = c^{*}$) at
 $t/\tau _0=5.25$. Scatter of samples is represented with small solid circles. Gradients are multiplied by the laminar flame thermal thickness
 $\delta _L(t)$.

Thus, we conclude that the conditional gradient magnitude  $\langle |\boldsymbol {\nabla } C| | C = c^{*} \rangle$ is independent of radial location
 $r$ and time
 $t$ also, so that any spatial and temporal dependence of the surface density function
 $\varSigma$ is due to
 $\mathcal {P}_C(c^{*}; r,t)$.
In order to investigate the scaling and spatial dependence of  $\mathcal {P}_C$, we consider an ensemble of two-dimensional plane cuts, whereby each plane contains the origin and its normal is oriented randomly. On each plane cut, we consider a circle of radius
 $r$, centred at the origin, and let
 $\boldsymbol {e}_t$ be the unit vector along the tangential direction. Let
 $q$ be the arc length distance from an arbitrary point along the circle (
 $0 \leqslant q < 2{\rm \pi} r$). Figure 13(a) shows a schematic representation of one such planar cut. The progress variable
 $C$ as a function of the coordinate
 $q$ along one such circle is shown in figure 13(b).
Flame surface crossings in a plane for simulation  $R2$ at
 $t/\tau _0 = 4.5$. (a) Cut of the flame surface
 $C = c^{*}$. (b) Progress variable field along a circle of radius
 $r$ versus the normalized arc length
 $q/r$.

Given the spherical symmetry of the statistics, the progress variable  $C$ and its gradient
 $\boldsymbol {\nabla } C$ are ergodic along
 $\boldsymbol {e}_t$. The probability
 $\mathbb {P}$ that
 $C$ takes a value between
 $c-\textrm {d}c/2$ and
 $c+\textrm {d}c/2$ on the circle is
 \begin{equation} \mathbb{P}[ c -\textrm{d}c/2 \leqslant C \leqslant c+\textrm{d}c/2] = \mathcal{P}_C(c; r,t)\,\textrm{d}c = \frac{1}{p 2{\rm \pi} r} \sum _{j=1}^{p} \sum _{i=1}^{m_j} \,\textrm{d}q_{ij}, \end{equation}
where  $\textrm {d}q_{ij}$ is an infinitesimal arc length centred at location
 $q_{ij}$ such that
 $C(q_{ij})=c$ and
 $c-\textrm {d}c/2 \leqslant C(q) \leqslant c+\textrm {d}c/2$ for
 $q_{ij}-\textrm {d}q_{ij}/2 \leqslant q \leqslant q_{ij}+\textrm {d}q_{ij}/2$ and
 $m_j$ is the number of locations along circle
 $j$ (
 $\,j=1,\ldots ,p$). Similar to the nomenclature used in the Bray–Moss–Libby (BML) model (Bray & Moss Reference Bray and Moss1977; Libby & Bray Reference Libby and Bray1980), each of the
 $q_{ij}$ locations is referred to as a flame crossing.
Each infinitesimal arc length  $\textrm {d}q_{ij}$ is related to the projection of the gradient
 $\boldsymbol {\nabla } C$ onto the tangential vector
 $\boldsymbol {e}_t$ at the flame crossing
 $i$ with circle of radius
 $r$ on plane
 $j$:
 \begin{equation} \textrm{d}q_{ij} = \textrm{d}c / |\boldsymbol{\nabla} C \boldsymbol{\cdot} \boldsymbol{e}_t|_{ij}. \end{equation}
Let  $m$ indicate the total number of flame crossings summed over all planes. Rearranging (6.8) and dividing by
 $\textrm {d}c$, we have
 \begin{align} \mathcal{P}_C(c; r,t) & = \frac{m}{p 2{\rm \pi} r} \, \frac{1}{m} \sum _{j=1}^{p} \sum _{i=1}^{m_j} |\boldsymbol{\nabla} C \boldsymbol{\cdot} \boldsymbol{e}_t|_{ij}^{-1} \end{align}
 \begin{align} & = \varpi(r,t) \, \langle |\boldsymbol{\nabla} C \boldsymbol{\cdot} \boldsymbol{e}_t|^{-1} | C=c\rangle, \end{align}
where  $\varpi (r,t)=m/(p2{\rm \pi} r)$ is the flame crossing frequency, defined as the number of flame crossings per unit length. The average of
 $|\boldsymbol {\nabla } C \boldsymbol {\cdot } \boldsymbol {e}_t|^{-1}$ over all crossings on circles of radius
 $r$ is simply the conditional average of
 $|\boldsymbol {\nabla } C \boldsymbol {\cdot } \boldsymbol {e}_t|^{-1}$ at the radial location
 $r$.
Since the expression for  $\varSigma$ involves the conditional mean of
 $|\boldsymbol {\nabla } C|$, it is beneficial to relate the conditional mean of the inverse
 $|\boldsymbol {\nabla } C \boldsymbol {\cdot } \boldsymbol {e}_t|^{-1}$ to the inverse of the conditional mean directly as
 \begin{equation} \langle |\boldsymbol{\nabla} C \boldsymbol{\cdot} \boldsymbol{e}_t|^{-1} | C=c\rangle = \varUpsilon \, \langle |\boldsymbol{\nabla} C \boldsymbol{\cdot} \boldsymbol{e}_t| | C=c\rangle^{-1}, \end{equation}
where  $\varUpsilon$ is given by
 \begin{equation} \varUpsilon = 1 + {Var}\left\{ |\boldsymbol{\nabla} C \boldsymbol{\cdot} \boldsymbol{e}_t | | C = c \right\} / \langle |\boldsymbol{\nabla} C \boldsymbol{\cdot} \boldsymbol{e}_t | | C = c \rangle^{2} + \ldots. \end{equation}
We find that  $\varUpsilon \approx 1.35$ for
 $0.5 \leqslant c \leqslant 0.9$ across all simulations at all times as shown in figure 14(a). In the limit of infinitesimally thin turbulent premixed flames,
 $\varUpsilon \to 1$.
(a) The  $\varUpsilon$ factor and (b) alignment
 $\langle |\cos \alpha _{nt}|| C = c\rangle$ statistics for three simulations at two select times:
 $R1$ (
 $\bigcirc$),
 $R2$ (
 $\Box$) and
 $R3$ (
 $\triangle$). (c) Peak surface density function
 $\varSigma _m$ (thick line), PDF of progress variable
 $\mathcal {P}_C$ (
 $\Box$), and conditional mean of the gradient magnitude
 $\langle |\boldsymbol {\nabla } C| | C = c \rangle$ (
 $\bigcirc$) at
 $r = R(t)$, normalized by their corresponding values for
 $c = c^{*}$. Data from simulation
 $R2$.

Assuming that the projection of the flame normal  $\boldsymbol {n}$ onto
 $\boldsymbol {e}_t$ and the gradient magnitude are uncorrelated, we write
 \begin{equation} \langle |\boldsymbol{\nabla} C| \, |\boldsymbol{n}\boldsymbol{\cdot}\boldsymbol{e}_t| | C = c \rangle \approx \langle |\boldsymbol{\nabla} C| | C = c \rangle \langle |\boldsymbol{n}\boldsymbol{\cdot}\boldsymbol{e}_t| | C = c \rangle. \end{equation}
The assumption that the two are uncorrelated appears to be reasonable on the account that turbulence in the reactants is isotropic. Then,  $\mathcal {P}_C$ reads as
 \begin{equation} \mathcal{P}_C(c;r,t) = \frac{ \varpi(r,t) \varUpsilon} {\langle | \boldsymbol{\nabla} C| | C = c \rangle \langle|\cos \alpha_{nt}| | C=c \rangle }, \end{equation}
where  $|\boldsymbol {n}\boldsymbol {\cdot }\boldsymbol {e}_t| = |\cos \alpha _{nt}|$ and
 $\alpha _{nt}$ is the angle between the normal
 $\boldsymbol {n}$ and the ergodic direction
 $\boldsymbol {e}_t$ and represents the orientation of the flamelets with respect to the ergodic direction. We find that the orientation angle
 $\alpha _{nt}$ is nearly constant in time, independent of the conditioning value
 $c$, and the same across simulations. As a result,
 $\varSigma$ is independent of the conditioning value
 $c$ for
 $0.1 \leqslant c \leqslant 0.9$ as shown in figure 14(c), since
 $\mathcal {P}_C \sim 1/\langle |\boldsymbol {\nabla } C| | C = c \rangle$.
Based on the above analysis, an approximate expression for the surface density function is
 \begin{equation} \varSigma(r,t; c) = \varpi(r,t) \varUpsilon / \langle|\cos \alpha_{nt}| | C=c \rangle. \end{equation}
Figure 15 compares the left- and right-hand sides of (6.16) for  $c = 0.73$, which are found to be in good agreement. Since the factor
 $\varUpsilon /\langle |\cos \alpha _{nt}| | C=c \rangle$ is approximately constant in space, time and across simulations, the spatial and temporal dependence of
 $\varSigma =\varSigma (r,t)$ is solely due to that of the crossing frequency
 $\varpi =\varpi (r,t)$.
Comparison between the two expressions for  $\varSigma$ in (6.16) and the direct evaluation from the gradients for three simulations at five times: (a)
 $R1$, (b)
 $R2$ and (c)
 $R3$. Time increases from left to right.

This result is consistent with the Bray–Moss–Libby theory of turbulent premixed combustion, whereby the surface density function is modelled in terms of the spatial crossing frequency and a mean cosine factor as  $\varSigma = \varpi /\langle | \cos \alpha _{nt} |\rangle$ (Bray, Libby & Moss Reference Bray, Libby and Moss1984; Bray & Libby Reference Bray and Libby1986). Here we find a similar expression with the additional factor
 $\varUpsilon = {O}(1)$, which provides a correction for the fact that premixed flames are not infinitesimally thin and
 $\varUpsilon$ is not strictly unity.
For a statistically stationary and planar turbulent premixed flame, the BML model relates the crossing frequency  $\varpi$ to the two-point, one-time autocorrelation function of the progress variable
 \begin{gather} \mathcal{F}(q; x_1) = \langle C'(\boldsymbol{x},t)C'(\boldsymbol{x} + q \boldsymbol{e}_{\alpha},t)\rangle/\sigma_C^{2}, \end{gather}
 \begin{gather}\varpi =\varpi(x_1)= -2 \partial \mathcal{F}/\partial q|_{q=0}, \end{gather}
where  $x_1$ is the inhomogeneous coordinate normal to the plane of the flame,
 $C'=C-\langle C \rangle$ is the fluctuation field,
 $\sigma ^{2}_C = \langle (C-\langle C \rangle )^{2} \rangle$ is the variance and
 $\boldsymbol {e}_{\alpha }$ is a unit vector in the plane of the flame that identifies an ergodic direction. Under specific assumptions on the functional form of the autocorrelation function
 $\mathcal {F}$, the crossing frequency and surface density function read as
 \begin{gather} \varpi = A_{\varpi} \langle C\rangle(1-\langle C\rangle)/L^{*}, \end{gather}
 \begin{gather}\varSigma = A_{\varSigma} \langle C\rangle(1-\langle C\rangle)/L^{*}, \end{gather}
where  $\langle C \rangle =\langle C \rangle (x_1)$,
 $A_{\varpi }$ and
 $A_{\varSigma }$ are constants of order unity, and
 $L^{*}$ is the so-called wrinkling scale.
Since the crossing frequency is closely related to the autocorrelation function of the progress variable (Bray et al. Reference Bray, Libby and Moss1984; Bray & Libby Reference Bray and Libby1986),  $L^{*}$ likely reflects the entire spectrum of the progress variable turbulent field
 $C(\boldsymbol {x},t)$, although it is not clear how
 $L^{*}$ should scale with the Reynolds number and how a suitable autocorrelation length could be defined from the autocorrelation function.
There exists significant controversy on the origin and values taken by the wrinkling scale in the literature. Cant & Bray (Reference Cant and Bray1989) proposed the following closure for the wrinkling scale,
 \begin{equation} L^{*} \propto k^{3/2} \epsilon^{-1}, \end{equation}
thereby advancing the hypothesis that the wrinkling scale is proportional to the integral scale defined as  $l = u'^{3}/\epsilon$ and controlled by turbulence and energy-containing fluid motions, rather than flame propagation. Deschamps et al. (Reference Deschamps, Boukhalfa, Chauveau, Gökalp, Shepherd and Cheng1992) observed
 $L^{*} \approx l$ for conical turbulent premixed flames, while others (Veynante, Duclos & Piana Reference Veynante, Duclos and Piana1994; Shy et al. Reference Shy, Lee, Chang and Yang2000) found that the wrinkling scale is about five times smaller than the integral scale for V-shaped and planar turbulent premixed flames. Further, Shy et al. (Reference Shy, Lee, Chang and Yang2000) reported that the wrinkling scale remained constant for two different turbulence intensities, while the integral length scale changed by
 ${\approx } 50\,\%$. However, inadequate resolution of the turbulent flame surface may be responsible for this observation, as the wrinkling scale was found to be of the size as the width of the averaging box used for the measurement of the surface density function. Finally, dependence of
 $L^{*}$ on
 $u'/S_L$ has been postulated also, yet no conclusive evidence exists.
Given that  $L^{*}$ and
 $1/\varSigma$ are related to within constants of order unity, we define the wrinkling scale as
 $L^{*} = (4 \varSigma _m)^{-1}$, where
 $\varSigma _m$ is the peak surface density in (5.19). The factor of 4 is included so as to be consistent with (6.20), since the peak surface density
 $\varSigma _m$ occurs near
 $\langle C \rangle = 0.5$. The proportionality
 $L^{*} \propto 1/\varSigma _m$ highlights that both quantities obey the same scaling laws.
Figure 16(a) shows the temporal evolution of  $\varSigma _m$ normalized by the thermal thickness of the laminar premixed flame. It is apparent that
 $\varSigma _m$ decreases in time several fold for each simulation. Because
 $\delta _L^{0}$ is constant across simulations and the variation in the flame thickness is minimal during the propagation of the turbulent flames, figure 16(a) shows conclusively that
 $\varSigma _m$ does not scale with the thermal thickness of the laminar flame. This behaviour is consistent with experiments on turbulent spherical flames in decaying turbulence behind grids (Renou et al. Reference Renou, Mura, Samson and Boukhalfa2002; Fries et al. Reference Fries, Ochs, Saha, Ranjan and Menon2019).
(a) Peak flame surface density  $\varSigma _m$ normalized by the thermal flame thickness
 $\delta _L^{0}$. (b) Ratio of length scales and power law fits
 $a{Re}_{\lambda }^{b}$ (solid lines). We observe
 $l/\eta \sim {Re}_{\lambda }^{1.5}$,
 $l/\lambda \sim {Re}_{\lambda }^{1.0}$ and
 $l/L^{*} \sim {Re}_{\lambda }^{1.13}$. Thus,
 $L^{*}$ lies between
 $\eta$ and
 $\lambda$ with separation increasing with
 ${Re}_{\lambda }$. Symbols in both (a,b) represent data from various simulations:
 $R1$ (
 $\bigcirc$),
 $R2$ (
 $\square$),
 $R2a$ (
 $\Diamond$),
 $R3$ (
 $\triangle$) and
 $R3s$ (
 $\triangledown$).

Figure 16(b) shows  $L^{*}$ normalized by the integral scale
 $l$ and plotted against
 ${Re}_{\lambda }$. Data from all flame configurations and several times during each simulation are shown. It is apparent that over the range
 $30 \leqslant {Re}_{\lambda } \leqslant 85$,
 $L^{*}$ is about 5 to 10 times smaller than the integral length scale. Further, the wrinkling scale falls between the Taylor scale
 $\lambda$ and Kolmogorov scale
 $\eta$, albeit closer to the former than to the latter. When scaled with
 $l$, the data suggest the following power law fit for the wrinkling scale:
 \begin{equation} l/L^{*} = 4\varSigma_m l = 0.0756 {Re}_{\lambda}^{1.13}. \end{equation}
Note that only data for  $t/\tau _0 > 0.5$ have been used in the fit since it is necessary for turbulent motions to wrinkle the flame past an initial transient, during which a power law scaling for
 $l/L^{*}$ is not warranted.
The power law scaling from (6.22) shown in figure 16(b) is rather convincing, especially because it holds across simulations and instantaneously even as  ${Re}_{\lambda }$ and
 $l$ vary in time during the decay of turbulence. Nonetheless, studies over a broader range of Reynolds number are obviously desirable.
The observation that  $\eta < L^{*} < \lambda$ suggests that the peak surface density is governed by small scales. The importance of small scales in controlling
 $\varSigma _m$ has been postulated by Huh, Kwon & Lee (Reference Huh, Kwon and Lee2013), who analysed the surface density transport equation for statistically planar flames and proposed that
 $\varSigma _m$ scales with the inverse of the mean flame surface curvature. Since Zheng, You & Yang (Reference Zheng, You and Yang2017) demonstrated that the PDF of the flame surface curvature is independent of the Reynolds number when normalized with the Kolmogorov length, a case could be made that
 $\varSigma _m \propto \eta ^{-1}$, independently of
 ${Re}_{\lambda }$. Our data do not support this conclusion, although they do highlight the fact that
 $L^{*}$ is smaller than
 $\lambda$ and its evolution is most likely related to processes at the dissipative end of the inertial range of the turbulence spectrum.
The Darrieus–Landau (DL) instability (Darrieus Reference Darrieus1938; Landau Reference Landau1944) may provide an additional mechanism for flame surface wrinkling (Fogla, Creta & Matalon Reference Fogla, Creta and Matalon2013; Creta et al. Reference Creta, Lamioni, Lapenna and Troiani2016), thereby influencing the surface density distribution and the wrinkling scale. The instability may be particularly important towards the end of the simulations, as pressure and flame radius increase, while turbulence decays leading to small  $u'/S_L$.
The importance of the DL instability in the present flames may be assessed by comparing the growth rates of the DL instability against the rates of flame wrinkling in the range of wavenumbers where both effects are active. It is assumed that the range of scales over which the DL instability is important is  $\kappa \in [1/R, 1/\delta _L]$, while that of turbulent wrinkling is
 $\kappa \in [1/l, 1/\eta ]$. Since
 $R > l$ and
 $\eta < \delta _L$ at all times, the overlap region is
 $\kappa \in [1/l, 1/\delta _L]$. Following the analysis in Yang et al. (Reference Yang, Saha, Liu and Law2018), the ratio is
 \begin{equation} \omega_T (\kappa)/\omega_{DL}(\kappa) \approx u'_{\kappa}/S_L, \end{equation}
where  $u'_{\kappa } = (\epsilon /\kappa )^{1/3}$ is the eddy velocity associated with wavenumber
 $\kappa$. Since
 $u'_{\kappa }/S_L > u'_{\eta }/S_L > 1$ for all
 $\kappa$ in the overlap region, we conclude that all turbulent flames considered in this study belong to the turbulence dominated regime (Yang et al. Reference Yang, Saha, Liu and Law2018), and the effect of DL instability can be safely neglected.
6.3. Scaling of the area ratio
The findings in §§ 6.1 and 6.2 have critical implications with regard to the evolution of the area ratio  $\chi$ and its values across flame configurations. We begin by rearranging (5.20a) into
 \begin{equation} \chi = \varSigma_m \delta_T \beta = (l/4 L^{*}) (\delta_T/l) \beta. \end{equation}
Recalling that  $\beta$ is a shape factor that is nearly constant and substituting the scaling laws for the brush and peak surface density function, we obtain
 \begin{equation} \chi(t) = C_{\chi} {Re}_{\lambda}^{1.13} f(s) , \end{equation}
where  $C_{\chi }$ is a constant and the dependence of
 $\delta _T/l$ on time is captured by
 $f(s)$ with
 $s=\log (1+t/t_0)$ indicating the transformed time coordinate. The area ratio
 $\chi$ and
 $S_T/S_L \sim \chi$ depend on time directly due to
 $\delta _T/l \sim f(s)$ and indirectly due to
 ${Re}_{\lambda }={Re}_{\lambda }(t)$ in decaying turbulence.
The most important implication of (6.25) is that
 \begin{equation} \chi(t){Re}_{\lambda}^{-1.13} \sim f(s), \end{equation}
so that if two turbulent spherical flames are compared at the same logarithmic time  $s$, the area ratio
 $\chi$ scales as
 ${Re}_{\lambda }^{1.13}$ or as
 ${Re}^{0.56}$, since
 ${Re} = u'l/\nu \sim {Re}_{\lambda }^{2}$. This observation is broadly consistent with the previously reported Reynolds dependence of burning rates in spherical turbulent flames (Chaudhuri et al. Reference Chaudhuri, Wu, Zhu and Law2012; Jiang et al. Reference Jiang, Shy, Li, Huang and Nguyen2016; Ahmed & Swaminathan Reference Ahmed and Swaminathan2013).
Figure 17(a) shows that  $\chi$ varies in time and across flame configurations. For
 $t/\tau _0 > 2$,
 $\chi$ reaches a limit value, which differ for each case by as much as a factor of 1.6. The same data are shown in compensated form as
 $\chi (t){Re}_{\lambda }^{-1.13}$ versus
 $s$ in figure 17(b). Note that only data for
 $t/\tau _0 > 0.5$, which corresponds to
 $s > 0.3$, are shown because the scaling of
 $\varSigma _m$ implies that turbulent motions have had sufficient time to wrinkle the flame past an initial transient, during which the power law scaling
 $l/L^{*}$ in (6.22) is not applicable.
(a) Area ratio versus time  $t/\tau _0$. (b) Area ratio compensated with the proposed Reynolds scaling versus the transformed time coordinate
 $s=\log (1+t/t_0)$ with
 $t_0=n\tau _0$. Symbols represent data from simulations:
 $R1$ (
 $\bigcirc$),
 $R2$ (
 $\square$),
 $R2a$ (
 $\Diamond$),
 $R3$ (
 $\triangle$) and
 $R3s$ (
 $\triangledown$).

The collapse in figure 17(b) is encouraging, albeit not perfect, especially for the data from simulations  $R3$ and
 $R3s$ at later times
 $s>1$. Despite minor inconsistencies, which are related to the imperfect collapse of
 $\delta _T/l$ at later times as shown in figure 10(b), we conclude that scale separation, as parametrized by the Reynolds number plays an important role in controlling the area ratio and the dimensionless turbulent flame speed
 $S_T/S_L \sim \chi$ across flame configurations.
In order to investigate this important implication, three simulations are considered. These include  $R2$ and
 $R2a$, which share the same Reynolds number, but not the same
 $u'/S_L$, and simulations
 $R1$ and
 $R2a$, which share
 $u'/S_L$, but not the same Reynolds number. Note that
 $u'/S_L$ changes in time as reported in figure 3(c).
From the evolution of  $\chi$ for
 $R1$,
 $R2$ and
 $R2a$ in figure 17(a), it is clear that when the Reynolds number is held constant and
 $u'/S_L$ changes (along with
 $l/\delta _L$), the area ratio does not change (
 $R2$ vs.
 $R2a$). On the other hand, when
 $u'/S_L$ is held constant and the Reynolds number changes (along with
 $l/\delta _L$), the area ratio is greater for the flame with the higher Reynolds number (
 $R1$ vs.
 $R2a$). These results support the conclusion that, for a given premixed mixture,
 $S_T/S_L$ is not a function of
 $u'/S_L$ at constant Reynolds number for the flame configuration and regime considered. A similar Reynolds dependence was proposed by Chaudhuri et al. (Reference Chaudhuri, Akkerman and Law2011) based on spectral analysis of the level-set equations. Because when
 $u'/S_L$ is held constant as
 ${Re}_{\lambda }$ increases, the ratio
 $l/\delta _L$ increases proportionally also (for the same reactive mixture, pressure and temperature), the observed trends in
 $\chi$ may not be conclusively attributed solely to
 ${Re}_{\lambda }$ independently of
 $l/\delta _L$ and a broader set of simulations are required.
In closing, we remark that in most experiments on turbulent premixed flames, the integral scale of the flow remains approximately constant as  $u'$ is varied by increasing flow rates or fan speeds. This occurrence is due to the fact that the integral scales are largely set by the geometrical details of the burner, turbulence-generating grids, or fans, which are held fixed for practical reasons. The consequence is that both
 $u'/S_L$ and
 ${Re}$ vary together at
 $l/\delta _L \approx const$ in most studies. Then, with
 $l/\delta _L$ constant as
 $u'/S_L$ increases holding premixed reactants, kinematic viscosity (i.e. pressure), and burner geometry unchanged, one obtains
 $S_T/S_L \sim (u'/S_L)^{0.55}$ since
 $S_T/S_L \sim {Re}^{0.55}$.
7. Summary and conclusions
The propagation of spherical turbulent premixed methane/air flames in decaying turbulence was investigated at different conditions via direct numerical simulations. The simulations feature detailed finite rate chemistry for methane oxidation and mixture-average transport. The simulations are repeated for several values of the Taylor-scale Reynolds number  ${Re}_{\lambda }$, where all properties of isotropic turbulence are defined in the reactants. By design, the extent of the turbulent flame is large compared to the integral length scale of turbulence, guaranteeing that the flame surface is wrinkled by motions across the entire spectrum of turbulence and that statistics are duly converged. The flames belong to the thin reaction zone regime of turbulent premixed combustion and are characterized by low values of the Karlovitz number, so that the dimensionless turbulent flame speed is equal to the area ratio, defined as the ratio of the area of the flame surface to a reference area based on the mean progress variable. Thus, enhancements to the burning rate are brought by flame wrinkling, folding and stretching.
The data are analysed within the formalism of the surface density function and under the assumption of spherical symmetry of the statistics. The analysis shows that the dimensionless turbulent flame speed is equal to the product of the flame brush thickness, the peak value of the surface density function and a non-dimensional shape factor of order unity. This decomposition lies at the basis of our postulate that the area ratio of turbulent premixed flames increases for increasing scale separation.
Once scaled by the instantaneous value of the integral length scale and plotted versus a stretched logarithmic time coordinate consistent with the evolution of turbulent kinetic energy in decaying homogeneous isotropic turbulence, the flame brush thickness is found to be nearly self-similar across simulations, irrespective of the Reynolds number of the flow. This result is significant because it indicates that the extent of the turbulent flame brush is governed by the largest scales of the flow as suggested by past experiments.
An ordinary differential equation that describes the evolution of the brush thickness is derived and indicates that the growth of the brush is controlled primarily by the balance of two mechanisms. Turbulent diffusion by velocity fluctuations leads to an increase in the brush thickness, consistent with Taylor's theory of turbulent diffusion, while spatial variations of the statistics of flame stretch across the brush lead to a decrease in its thickness. Early in the evolution, the brush grows rapidly due to turbulent transport, but later the two contributions balance each other and the brush thickness appears to reach an asymptotic limit.
Following the framework of the Bray–Moss–Libby model of turbulent premixed combustion, we relate the peak value of the surface density function to the flamelet spatial crossing frequency, so that its inverse is the wrinkling length scale. The concept of wrinkling length is noteworthy because it allows us to scale the surface density function across simulations. For all cases, we find that the wrinkling length is larger than the Kolmogorov scale, but smaller than the Taylor micro-scale, being closer to the latter than to the former. Most important, the ratio between the wrinkling scale and the integral scale of the flow is proportional to  ${Re}_{\lambda }^{-1.13}$ across all simulations. This result identifies the wrinkling scale as a hydrodynamic scale related to turbulence and its spectrum.
The evolution and scaling of the brush and peak surface density function result in the dimensionless turbulent flame speed scaling as  $S_T/S_L {Re}_{\lambda }^{-1.13} \sim f(s)$, where
 $s$ is the suitable logarithmic time coordinate for decaying turbulence and
 $f(s)$ is a function that describes the growth of the brush normalized by the integral scale. The scaling is shown to hold to a very good approximation over several cases with
 $30 \leqslant {Re}_{\lambda } \leqslant 80$.
At present, the origin of the value of the scaling exponent is unclear and it is possible that it is somewhat specific to the spherical flame configuration. Furthermore, the results shown pertain to a modest range of Reynolds numbers and little separation exists between the dissipative scales and the wrinkling scale. More definitive conclusions require higher values of the Reynolds number. Finally, the flame configurations feature low values of the Karlovitz number, so that it is unclear whether the ratio of the Kolmogorov time to the flame time scale plays an additional role in the scaling.
Despite the limitations in scope, our data support the notion that scale separation, as parametrized by the Reynolds number, is a key parameter in controlling the burning rates of the spherical turbulent premixed flames at the conditions explored in the simulations. Broadly, the fact that  $S_T/S_L \sim {Re}_{\lambda }^{1.13}$ points to the key role of the integral length scale
 $l$ and kinematic viscosity
 $\nu$, in addition to that of the velocity fluctuation
 $u'$, which is well recognized in the literature. Our analysis provides a novel perspective that is consistent quantitatively with recent experimental results.
Acknowledgements
This material is based upon work supported in part by the National Science Foundation (NSF) under grant number 1805921. Numerical simulations were carried out on the ‘Shaheen’ supercomputer at King Abdullah University of Science and Technology (KAUST) and on the ‘Stampede 2’ supercomputer at the Texas Advanced Computing Center (TACC) through allocation TG-CTS180002 under the Extreme Science and Engineering Discovery Environment (XSEDE). XSEDE is supported by the NSF under grant number ACI-1548562. Any opinions, findings and conclusions or recommendations expressed in this material are those of the authors and do not necessarily reflect the views of the NSF.
Declaration of interests
The authors report no conflict of interest.
Supplementary movies
Supplementary movies are available at https://doi.org/10.1017/jfm.2020.784.
Appendix A. Estimation of $R(t)$ and $A(t)$


Define the flame surface area as a random process  $\tilde {A}(t)$ with
 $\tilde {A}^{(n)}(t)$ denoting its repetition
 $n$ of
 $\mathcal {N}$. Then, the mean of the flame surface area is
 \begin{equation} A(t) \equiv \langle \tilde{A}(t) \rangle = \langle \langle \tilde{A}(t) \rangle_{\mathcal{N}} \rangle = \left\langle \frac{1}{\mathcal{N}} \sum _{n=1}^{\mathcal{N}} \tilde{A}^{(n)}(t) \right\rangle, \end{equation}
where  $\langle \cdot \rangle$ denotes statistical expectation and
 $\langle \cdot \rangle _{\mathcal {N}}$ indicates ensemble averaging over
 $\mathcal {N}$ repetitions (Pope Reference Pope2000).
The random process  $\tilde {A}(t)$ is functionally related to the progress variable random field
 $C(\boldsymbol {x},t)$ (Maz'ya Reference Maz'ya1985),
 \begin{equation} \tilde{A}(t) = \int_V |\boldsymbol{\nabla} C(\boldsymbol{x},t)| \delta[ C(\boldsymbol{x},t) - c^{*}] \, \textrm{d}V, \end{equation}
where  $\delta$ is the Dirac delta function and
 $C(\boldsymbol {x},t)=c^{*}$ is the isosurface taken to represent the flame, so that
 \begin{equation} A(t) \equiv \langle \langle \tilde{A}(t) \rangle_{\mathcal{N}} \rangle = \left\langle \left\langle \int_V |\boldsymbol{\nabla} C| \delta( C - c^{*}) \, \textrm{d}V \right\rangle_{\mathcal{N}} \right\rangle. \end{equation}
Rearranging the order by which the statistical expectation, ensemble average and volumetric integral are taken, we obtain
 \begin{equation} A(t) = \int_V \langle \langle |\boldsymbol{\nabla} C| \delta( C - c^{*})\rangle \rangle_{\mathcal{N}} \, \textrm{d}V = \int_V \langle \langle \tilde{\varSigma} \rangle \rangle_{\mathcal{N}} \, \textrm{d}V, \end{equation}
where we defined the spherically symmetric random field  $\tilde {\varSigma }(\boldsymbol {x},t) = | \boldsymbol {\nabla } C | \delta (C - c^{*})$ with expectation
 $\langle \tilde {\varSigma } \rangle$. For each repetition
 $n$ of
 $\mathcal {N}$, spherical averaging of
 $\tilde {\varSigma }$,
 \begin{equation} \langle \tilde{\varSigma} \rangle_{\varTheta\varPhi} = \frac{1}{4{\rm \pi} r^{2}} \int_0^{2{\rm \pi}} \int_0^{\rm \pi} \tilde{\varSigma}(r,\varTheta,\varPhi,t) r^{2} \sin\varTheta \,\textrm{d} \varTheta \,\textrm{d}\varPhi, \end{equation}
is an estimate for  $\langle \tilde {\varSigma } \rangle$ consistent with the statistical symmetry of the random field. Based on (A 5), we rewrite (A 4) as
 \begin{equation} A(t) \equiv \langle\tilde{A}(t)\rangle \approx \int_V \langle \langle \tilde{\varSigma} \rangle_{\varTheta\varPhi} \rangle_{\mathcal{N}} \, \textrm{d}V = 4 {\rm \pi}\int_0^{\infty} r^{2} \langle \langle \tilde{\varSigma} \rangle_{\varTheta\varPhi} \rangle_{\mathcal{N}} \, \textrm{d}r. \end{equation}
In the last step, we exploited the fact that  $\langle \tilde {\varSigma } \rangle _{\varTheta \varPhi }$ depends on
 $(r,t)$ only.
The mean of the flame surface area is the volumetric integral of the flame surface density function  $\varSigma$ (Pope Reference Pope1988; Vervisch et al. Reference Vervisch, Bidaux, Bray and Kollmann1995),
 \begin{equation} A(t) = \int_V \varSigma \, \textrm{d}V = 4 {\rm \pi}\int_0^{\infty}r^{2} \varSigma(r,t) \, \textrm{d}r, \end{equation}
with  $\varSigma$ a function of
 $(r,t)$ only in the present unsteady spherically symmetric configuration. Equating (A 7) and (A 6) brings
 \begin{equation} A(t) = 4 {\rm \pi}\int_0^{\infty} r^{2} \varSigma \, \textrm{d}r \approx 4 {\rm \pi}\int_0^{\infty} r^{2} \langle \langle \tilde{\varSigma} \rangle_{\varTheta\varPhi} \rangle_{\mathcal{N}} \, \textrm{d}r, \end{equation}
which implies, as expected, that  $\langle \langle \tilde {\varSigma } \rangle _{\varTheta \varPhi } \rangle _{\mathcal {N}}$ is an approximation to
 $\varSigma$ and that the statistical error inherent in the estimate of
 $A(t)$ depends on the number of repetitions
 $\mathcal {N}$ and the variance of the spherical average
 $\langle \tilde {\varSigma } \rangle _{\varTheta \varPhi }$.
The central limit theorem may be applied to spherical averages of spatially discrete solutions noting that surface averages are approximated by summations so that  ${Var}[ \langle \tilde {\varSigma } \rangle _{\varTheta \varPhi } ] = {Var}[ \tilde {\varSigma } ]/ \mathcal {M}_r$, where
 ${Var}[U]$ indicates the variance of a random variable
 $U$ and
 $\mathcal {M}_r$ is the number of independent and identically distributed (i.i.d.) samples gathered on the surface of radius
 $r$.
The present configurations were designed to have large  $R/l$ ratios, i.e. the flame radius is large compared to the integral scale of velocity, leading to very many i.i.d. samples of
 $\tilde {\varSigma }$. Consequently,
 ${Var}[ \langle \tilde {\varSigma } \rangle _{\varTheta \varPhi } ]$ is small and one repetition (
 $\mathcal {N}=1$) is sufficient to obtain a close estimate of the mean of both the flame surface density function and flame surface area at time
 $t$.
Similar considerations apply to  $R(t) = \langle \tilde {R}(t)\rangle$ by defining the random process (Maz'ya Reference Maz'ya1985)
 \begin{equation} \tilde{R}(t) = \frac{1}{A(t)} \int_V r(\boldsymbol{x}) |\boldsymbol{\nabla} C(\boldsymbol{x},t)| \delta[ C(\boldsymbol{x},t) - c^{*}] \, \textrm{d}V, \end{equation}
which is the instantaneous surface averaged Euclidean (radial) distance  $r(\boldsymbol {x})=|\boldsymbol {x}|$ of the flame surface from the origin located at the centre of the computational domain. Then
 \begin{equation} R(t) \equiv \langle\tilde{R}(t)\rangle = \langle \langle \tilde{R}(t) \rangle_{\mathcal{N}} \rangle \approx \frac{4 {\rm \pi}}{A(t)} \int_0^{\infty} r^{3} \langle \langle \tilde{\varSigma} \rangle_{\varTheta\varPhi} \rangle_{\mathcal{N}} \, \textrm{d}r. \end{equation}
Appendix B. Dispersion relation in spherical coordinate system
Taylor's theory of turbulent diffusion (Taylor Reference Taylor1922) describes the dispersion of material points in homogeneous isotropic turbulence. Its application to dispersion in radial coordinates requires modifications to account for changes in the radial direction along Lagrangian trajectories. Consider an ensemble of particles released on a sphere of radius  $R_0$ at time
 $t = 0$ in decaying homogeneous isotropic turbulence. The radial distance
 $r(a,t)$ of a particle with index
 $a$ at
 $t > 0$ is given by
 \begin{equation} r(a,t) = | \boldsymbol{x}(a,t) |, \end{equation}
where  $\boldsymbol {x}$ is the position vector of the particle with respect to the origin.
The evolution of the particle's radial distance is governed by
 \begin{equation} \frac{\textrm{d} r(a,t)}{\textrm{d}t} = \boldsymbol{u}(\boldsymbol{x}(a,t),t)\boldsymbol{\cdot}\boldsymbol{i}_r(a,t), \end{equation}
where  $\boldsymbol {u}$ denotes the local fluid velocity vector at the particle location and
 $\boldsymbol {i}_r$ is the unit vector in radial direction
 $\boldsymbol {i}_r(a,t) = {\boldsymbol {x}(a,t)}/{| \boldsymbol {x}(a,t) |}$. Integrating the ordinary differential equation with initial condition
 $r(a,0) = R_0$ gives the particle's distance for
 $t > 0$,
 \begin{equation} r(a,t) = R_0 + \int_0^{t} \boldsymbol{u}(\boldsymbol{x}(a,p),p)\boldsymbol{\cdot}\boldsymbol{i}_r(a,p) \, \textrm{d}p. \end{equation}
Here  $p$ represents the dummy variable of integration.
Following Taylor (Reference Taylor1922), the variance  $\sigma ^{2}$ of the radial distance in the absence of mean radial velocity is
 \begin{equation} \frac{1}{2}\frac{\textrm{d}\sigma^{2}}{\textrm{d}t} = \left\langle (r(a,t)-R_0) \frac{\textrm{d}r}{\textrm{d}t}(a,t) \right \rangle = \left\langle \boldsymbol{u}(a,t)\boldsymbol{\cdot} \boldsymbol{i}_r(a,t) \int_0^{t} \boldsymbol{u}(a,p) \boldsymbol{\cdot}\boldsymbol{i}_r(a,p) \, \textrm{d}p \right\rangle, \end{equation}
since the mean radial distance is constant and equal to  $R_0$. In the above expression, angular brackets denote average over the ensemble of particles and the dependence of
 $\boldsymbol {u}$ on
 $\boldsymbol {x}(a,p)$ is written as
 $\boldsymbol {u}(a,p)$.
The above integral reads as
 \begin{align} \frac{1}{2}\frac{\textrm{d}\sigma^{2}}{\textrm{d}t} & = \int_0^{t} \left\langle u_x(a,t) u_x(a,p) \frac{x(a,t)x(a,p)}{r(a,t)r(a,p)}\right \rangle \textrm{d}p \nonumber\\ &\quad + \int_0^{t} \left\langle u_y(a,t) u_y(a,p) \frac{y(a,t)y(a,p)}{r(a,t)r(a,p)}\right \rangle \textrm{d}p\nonumber\\ &\quad + \int_0^{t} \left\langle u_z(a,t) u_z(a,p) \frac{z(a,t)z(a,p)}{r(a,t)r(a,p)}\right \rangle \textrm{d}p, \end{align}
where  $u_x,u_y,u_z$ and
 $x,y,z$ denote the Cartesian components of vectors
 $\boldsymbol {u}$ and
 $\boldsymbol {x}$, respectively.
In homogeneous turbulence the velocity vector  $\boldsymbol {u}$ is uncorrelated with the position vector
 $\boldsymbol {x}$. Also, due to isotropy, the Lagrangian autocorrelation functions of all components of velocity is the same. In light of these simplifications, the above equation becomes
 \begin{equation} \frac{1}{2}\frac{\textrm{d}\sigma^{2}}{\textrm{d}t} = \int_0^{t} \left\langle u_x(a,t) u_x(a,p) \right\rangle \left\langle \frac{\boldsymbol{x}(a,t) \boldsymbol{\cdot} \boldsymbol{x}(a,p)}{|\boldsymbol{x}(a,t)| \, |\boldsymbol{x}(a,p)|} \right\rangle \textrm{d}p, \end{equation}
with a dependence on the mean cosine of the angle between radial vectors on Lagrangian trajectories. Simplifying the above as in Taylor (Reference Taylor1922), we obtain
 \begin{equation} \frac{1}{2}\frac{\textrm{d}\sigma^{2}}{\textrm{d}t} = u'(t) \int_0^{t} u'(p) f_L(p,t) \langle \cos \alpha_{p,t} \rangle \, \textrm{d}p, \end{equation}
where  $f_L$ denotes the Lagrangian autocorrelation function in decaying isotropic turbulence
 \begin{equation} f_L(t_1,t_2) \equiv \frac{\left\langle u_x(a,t_1) u_x(a,t_2) \right\rangle}{u'(t_1) u'(t_2)}, \end{equation}
where  $u'(t)$ is the turbulence intensity at time
 $t$.
In (B 7),  $\alpha _{p,t}$ is the angle between position vectors on the Lagrangian trajectory at times
 $t$ and
 $p$. This implies that Taylor's theory overestimates the variance, since
 $\cos \alpha _{p,t} \leqslant 1$. The orientation factor
 $\langle \cos \alpha _{p,t} \rangle$ depends on the lateral movement of particles in the polar and azimuthal directions compared to that in the radial one and is close to unity for small values of the ratio between the two.



