Introduction
Chromium (Cr), particularly in its hexavalent form (Cr(VI)), is a prevalent and hazardous contaminant in soils and groundwater due to its high solubility, mobility, and toxicity. The environmental risk of Cr is governed primarily by its redox speciation. While Cr(VI) is highly soluble and bioavailable, its reduced counterpart, trivalent chromium (Cr(III)), is less toxic and readily immobilized through precipitation and adsorption under circumneutral to alkaline conditions (Liang et al., Reference Liang, Huang, Yan, Li, Zhao, Liu, Ye and Wei2021). Therefore, processes that promote the adsorption and reduction of Cr(VI) on ubiquitous soil minerals are critical for determining its fate, transport, and overall environmental fate.
Clay minerals and iron (oxyhydr)oxides, referred to hereafter as Fe (oxyhydr)oxides, are ubiquitous soil constituents known for their high reactivity towards trace metals (Oze et al., Reference Oze, Fendorf, Bird and Coleman2004). In natural environments, however, they rarely exist as discrete particles. Instead, they tend to form clay–Fe(oxyhydr)oxide composites via electrostatic attraction and co-precipitation, especially under circumneutral pH conditions (Green-Pedersen and Pind, Reference Green-Pedersen and Pind2000; Yang et al., Reference Yang, Ning, He, Li, Yang, Yang, Kang, Dähn and Li2022). These composites often exhibit distinct physicochemical properties relative to their individual components, including altered surface charge and specific surface area, which can significantly modify their sorption behaviors (Sipos et al., Reference Sipos, Kis, Balázs, Tóth, Kovács and Németh2018). Montmorillonite (Mnt), a swelling 2:1 phyllosilicate, is a highly reactive and abundant clay that commonly associates with poorly ordered Fe(oxyhydr)oxide to form composites. The formation of these composites represents a fundamental yet complex interface that governs trace-metal sequestration.
Furthermore, organic matter (OM) is invariably present in soils and can intercalate into clay interlayers or coat mineral surfaces, forming organo-clay or organo-Fe complexes (Bu et al., Reference Bu, Yuan, Liu, Liu, Liu, He, Zhou, Song and Li2017). The presence of OM can profoundly influence the surface properties of clay-Fe (oxyhydr)oxide composites (Barrera-Diaz et al., Reference Barrera-Diaz, Lugo-Lugo and Bilyeu2012; Lu et al., Reference Lu, Wang, Li, Huang, Tian and Hao2018). On one hand, OM can provide additional functional groups (e.g. carboxyl and amine groups) for metal binding (Ding et al., Reference Ding, Zhou, Hadiatullah, Lu, Zhao, Jia, Zhang and Yao2021). On the other hand, it may block access to reactive sites or render mineral surfaces more negatively charged, potentially restraining the adsorption of anionic contaminants such as Cr(VI) (Shi et al., Reference Shi, Peng, Lin, Liang, Lee and Allen2020). The net effect on Cr(VI) retention depends on the structural configuration of the organo-mineral assemblages, which is governed by the relative abundance of individual components.
Despite the recognized importance of both clay-Fe (oxyhydr)oxide associations and OM in soils and sediments, the interfacial interactions and combined influences of such ternary systems on Cr(VI) adsorption remain poorly understood. Most previous investigations focused on either clay–Fe composites or organo-modified clays separately (Adisu et al., Reference Adisu, Balakrishnan, Tibebe and Narayanasamy2022; Srikacha et al., Reference Srikacha, Sriuttha, Neeratanaphan, Saiyasombat, Tengjaroensakul and Ponnusamy2022) and overlooked the coupled roles of Fe/clay ratio and OM under environmentally relevant conditions. Recent advances have highlighted the importance of surface complexation, spectroscopic identification, and structure–activity relationships in Cr(VI) retention processes (Liu et al., Reference Liu, Xin, Zou, Khoso, Liu, Jiang, Peng and Yu2023; Zeng et al., Reference Zeng, Luo, Wang, Liu, Xue and Xie2025). Advanced characterization techniques including X-ray photoelectron spectroscopy (XPS), Cr L-edge X-ray absorption near-edge spectroscopy (XANES), and Fourier transform infrared (FTIR) spectroscopy have been applied widely to explore adsorption mechanisms at the molecular level (Qin et al., Reference Qin, Desmau, Guinoiseau, Rovezzi, Gelabert, Ren and Benedetti2025; Yuan et al., Reference Yuan, Deng, Fang, Li, Yu and Huang2025). However, the quantitative contributions of Fe content, organic coating, and their interactions in ternary systems remain insufficiently addressed. Few studies have differentiated systematically the dominant effect of Fe/clay ratio from the regulatory effects of organic matter, especially under consistent experimental conditions. Recent studies on clay–ferrihydrite systems have focused mainly on phase transformation or simple binary interactions rather than the coupled effects of Fe/clay ratio and OM in realistic organo–mineral assemblies (Zhang et al., Reference Zhang, Tang and Fu2023).
To bridge this knowledge gap, the present study synthesized a series of montmorillonite-Fe (oxyhydr)oxide composites with varying Fe/clay ratios and organic modification, and explored systematically their Cr(VI) adsorption behaviors and microscopic mechanisms. The present work quantifies the individual and coupled effects of Fe loading and organic coating, and clarifies the competitive coordination and electrostatic interactions governing Cr(VI) retention at the organo–mineral interface. Two hypotheses were tested: (1) the Fe/clay ratio is a key factor controlling Cr(VI) adsorption capacity by modulating the density of positive surface charges and available reactive sites; and (2) the presence of OM not only expands the clay interlayers to facilitate the incorporation of Fe (oxyhydr)oxide but also provides additional binding sites for Cr(VI) anions via electrostatic attraction with the protonated amine or complexation with the carboxyl groups. Combining batch adsorption with spectroscopic and microscopic characterizations (X-ray diffraction (XRD), FTIR, XPS, BET), this study elucidates the Cr(VI) immobilization mechanisms and advances understanding of Cr(VI) geochemical behavior in complex soil systems. The practical performance of the optimized composite was further verified through a proof-of-concept soil incubation experiment. These findings provide a mechanistic basis for designing low-cost, eco-friendly, clay-based amendments for the remediation of Cr(VI)-contaminated soil and water.
Materials and methods
Sample preparation
Montmorillonite (Mnt) (Inner Mongolia, China) was selected as a representative clay mineral owing to its widespread natural distribution in soils. The Mnt sample was purified via repeated sedimentation to remove impurities, and the <2 μm fraction was collected and collected for the subsequent experiments. The chemical composition of Mnt is as follows: SiO2, 58.16%; Al2O3, 16.95%; Fe2O3, 5.26%; MgO, 3.57%; CaO, 2.29%; Na2O, 0.19%; K2O, 0.15%; MnO, 0.03%; TiO2, 0.20%; P2O5, 0.08%; loss on ignition, 13.25%.
In addition, organo-montmorillonite (OMnt) was prepared via the cation-exchange method. 12-aminododecanoic acid (ALA, NH2(CH2)11COOH) was selected as the organic modifier for Mnt owing to its distinctive molecular structure, which contains both a protonatable amine group (-NH2) and a terminal carboxylic acid group (-COOH). The protonated amine (-NH3+) facilitates the cation exchange process with interlayer cations in Mnt, ensuring successful intercalation and organophilic modification. More importantly, the co-existing carboxylic acid group serves as a well‑established ligand for complexation with various metal ions, including chromium species. The specific synthesis procedure followed Bu et al. (Reference Bu, Liu, Yuan, Zhou, Liu and Du2019a); 4.75 g of ALA was added to 200 mL of 0.14 M HCl solution and maintained at 80°C using a water bath. The resulting solution was added to a dispersion that consisted of 10 g of Mnt and 1000 mL of distilled water. The mixture was stirred at 80°C for 30 min. The solids of the above-mentioned mixtures were filtered and washed repeatedly with distilled water to remove excess ALA and then were dried and ground. ALA (98% purity) was obtained from Tokyo Chemical Industry Co. Ltd, and used as received.
Ferrihydrite (Fhy) was selected as a typical Fe (oxyhydr)oxide because it is ubiquitous in the environment and exhibits large specific surface area and reactivity relative to more crystalline phases (Michel et al., Reference Michel, Ehm, Antao, Lee, Chupas, Liu, Strongin, Schoonen, Phillips and Parise2007). Fhy was prepared according to the procedure described by Schwertmann and Cornell (Reference Schwertmann and Cornell2000). FeCl3·6H2O (0.2 mol L–1) was dissolved in 500 mL of MQ water, and 1 mol L–1 NaOH was added to adjust the pH to 7.0±0.05. The turbid solution was then aged at room temperature for ~4–6 h. After that, the pH dropped slightly (<1 pH unit), and the pH was again adjusted to 7.0. The turbid suspension was centrifuged at 10,000 rpm (rotor radius: 8.4 cm; 9391×g) for 15 min. The supernatant was discarded, and the solid was washed with MQ water ~4–5 times to remove excess Cl– and then freeze-dried.
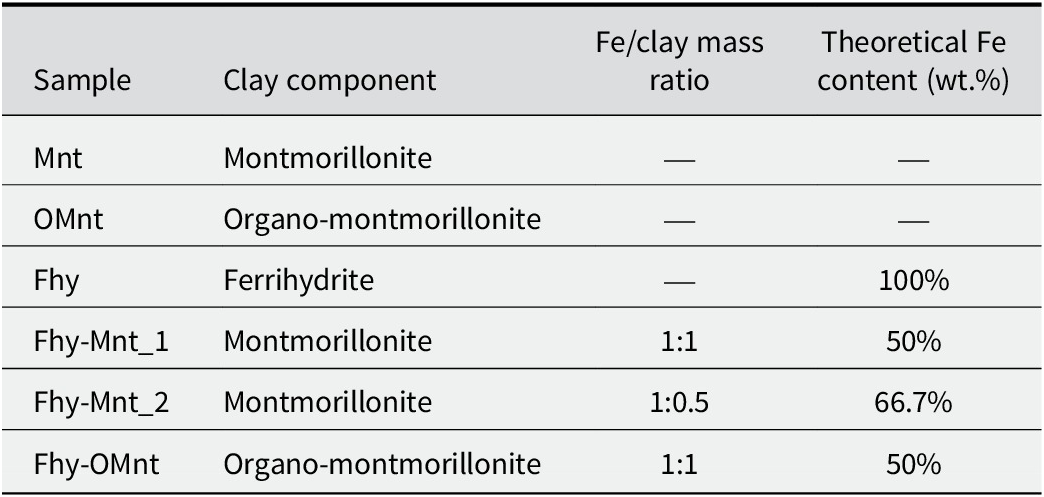
Clay-associated Fe(oxyhydr)oxides were prepared based on the above-mentioned Fhy synthesis procedure. A total of 2.8 g of synthesized OMnt or natural Mnt was prepared as a suspension. The suspension was then mixed with FeCl3 solution, and the mixture was neutralized to pH 7.0 with NaOH under continuous stirring. The co-precipitates were collected by centrifugation at 10,000 rpm, using a 19776H fixed-angle rotor (5×50 mL, rotor radius = 8.4 cm, corresponding to 9391×g), followed by washing with deionized water several times. The above OMnt- and Mnt-associated Fe (oxyhydr)oxide composites were denoted Fhy-OMnt or Fhy-Mnt, respectively. For comparison, additional Mnt-associated Fe(oxyhydr)oxides were synthesized by varied Fe/clay mass ratios. The resulting samples were denoted as Fhy-Mnt_1 or Fhy-Mnt_2, indicating an Fe/clay ratio of 1:1 or 1:0.5. All samples were freeze-dried and ground to pass through a 200 mesh sieve (Table 1).
Basic information about the investigated samples

Table 1. Long description
Panel a is a scatter plot of Adsorbed in milligrams per gram on the Y-axis versus Time in minutes on the X-axis, ranging from 0 to 1500. The data shows a rapid initial increase in adsorption within the first 100 minutes, followed by a plateau. Fhy-Mnt_2 (green triangles) shows the highest adsorption at approximately 19 milligrams per gram. Fhy (black squares) follows at 17.5, Fhy-OMnt (purple triangles) at 16, and Fhy-Mnt_1 (red circles) at 14. Mnt (blue triangles) and OMnt (brown hexagons) show negligible adsorption near 0.Panel b is a scatter plot of Q sub e in milligrams per gram on the Y-axis versus C i in p p m on the X-axis, ranging from 0 to 120. The data follows a curved trend that peaks and then slightly declines. Fhy-Mnt_2 (green triangles) reaches a peak of approximately 18 milligrams per gram at 80 p p m. Fhy (black squares) peaks at 17 milligrams per gram at 50 p p m. Fhy-OMnt (purple triangles) and Fhy-Mnt_1 (red circles) show lower peaks around 14 and 13 milligrams per gram respectively, with a downward trend as C i increases beyond 60 p p m.
* Row 1: Sample Mnt; Clay component Montmorillonite; mass ratio and iron content are not applicable.
* Row 2: Sample O Mnt; Clay component Organo-montmorillonite; mass ratio and iron content are not applicable.
* Row 3: Sample Fhy; Clay component Ferrihydrite; mass ratio is not applicable; Theoretical F e content is 100 percent.
* Row 4: Sample Fhy-Mnt sub 1; Clay component Montmorillonite; F e / clay mass ratio is 1 to 1; Theoretical F e content is 50 percent.
* Row 5: Sample Fhy-Mnt sub 2; Clay component Montmorillonite; F e / clay mass ratio is 1 to 0.5; Theoretical F e content is 66.7 percent.
* Row 6: Sample Fhy-O Mnt; Clay component Organo-montmorillonite; F e / clay mass ratio is 1 to 1; Theoretical F e content is 50 percent.
Adsorption experiments
Stock Cr(VI) solutions were prepared from K2Cr2O7. Cr(VI) sorption experiments were performed in a 50 mL centrifuge tube. The adsorbents (0.05 g) were added to 20 mL of Cr(VI) solution, corresponding to a solid loading of 2.5 g L–1. No buffer was added in these experiments. Considering that the areas polluted by heavy metals are generally acidic environments (Blake and Goulding, Reference Blake and Goulding2002), the pH value was adjusted to 4.5 using 0.1 M HCl and 0.1 M NaOH solutions. A pH of 4.5 was selected to simulate the typical acidic environment of subtropical red soil and to maintain stable Cr(VI) speciation for mechanism analysis. The background ionic strength was not controlled by adding extra electrolyte, as the objective was to simulate the conditions of contaminated acidic environment where the ionic composition can be variable. Natural ionic strength was dominated by the Cr(VI) stock solution and pH adjustment reagents.
For kinetics tests, the mixture was shaken vigorously in an oscillator to ensure complete mixing. The contact time ranged from 10 to 1440 min. At timed intervals, samples were taken using 3 mL HDPE syringes and filtered through a 0.2 μm cellulose acetate syringe filter. The Cr content in the filtered solution was measured using an inductively coupled plasma optical emission spectrometer (ICP-OES) (PerkinElmer Optima 8000, Waltham, MA, USA). The adsorption isotherm experiments followed a very similar procedure, except that the equilibrium time was fixed at 1440 min. All adsorption experiments were conducted at room temperature (25±2°C) unless otherwise noted and performed in duplicate. The adsorption results were corrected using blank tests in which no adsorbent was added to the Cr(VI) solution.
The amount of Cr(VI) adsorbed per unit mass of the adsorbent, Q (mg g–1), was calculated using the expression: Q=(C 0−C t )/m, where C 0 and C t (mg L–1) are the concentrations of Cr(VI) in the reaction solution before and after treatment, respectively, and m (g) is the amount of adsorbent in 1 L of Cr(VI) solution. The pseudo-first-order (Eqn (1)) (Simonin, Reference Simonin2016) and pseudo-second-order (Eqn (2)) models were used to fit the Cr(VI) adsorption kinetics data.

where k 1 is the pseudo-first-order rate constant, t is the time, and Qt and Q e are the amounts of Cr(VI) adsorbed per unit mass (mg g–1) at any time (t) and at equilibrium, respectively.

Both the Langmuir equation (Eqn (3)) and the Freundlich equation (Eqn (4)) were used to quantitatively describe Cr(VI) uptake.


where Q e is the equilibrium adsorption capacity of the adsorbent, Q max is the maximum adsorption capacity, KL is a Langmuir constant related to the affinity of binding sites and energy of adsorption, KF is a constant representing the adsorption capacity of the adsorbent, and n is the adsorption intensity parameter.
Analytical methods
XRD patterns were recorded using an X-ray diffractometer (D2 instrument, Bruker, Germany) equipped with a Co Kα radiation source (36 kV and 36 mA). FTIR spectra of samples in pressed KBr pellets were recorded on a Bruker Vertex-70 FTIR spectrometer. XPS was carried out using a Thermo Escalab 250XI spectrometer to analyze the surface elemental composition. Cr L-edge XANES analysis was performed at the BL08U beamline of the Shanghai Synchrotron Radiation Facility (SSRF) in Shanghai, China. Cr L-edge XANES spectra were recorded from 554 eV to 580 eV with a step of 0.1 eV and a dwell time of 2 s. The measurement was repeated three times at each energy level. The spectra of pure K2Cr2O7 and Cr2O3 were obtained to serve as the reference standards for the Cr(III) and Cr(VI) oxidation states. N2 adsorption–desorption isotherms were measured using a Micromeritics ASAP 2020 system at liquid-nitrogen temperature. The samples were outgassed at 110°C for 8 h prior to measurement. Scanning transmission electron microscopy (STEM) with energy-dispersive X-ray spectroscopy (EDX) was performed using a transmission electron microscope (TEM) (JEOL JEM-F200) with an operating voltage of 200 kV. Scanning electron microscopy (SEM) was used to investigate the morphological characteristics of the samples on a Hitachi S4800 SEM instrument (Hitachi, Japan) at an accelerating voltage of 5.0 kV. Zeta potentials were determined from isoelectric-point analysis with a Malvern MPT-2/Zetasizer Nano ZS instrument (Mastersizer 3000, UK).
Results and Discussion
Cr(VI) adsorption behavior on clay-associated Fe (oxyhydr)oxide
The adsorption kinetics curves (Fig. 1a) confirmed that both pure Fhy and the clay-associated Fe (oxyhydr)oxide accumulated Cr(VI) effectively. The Cr(VI) uptake capacity of pure Fhy was the greatest, eventually reaching equilibrium. In contrast, the adsorption capacities of pure Mnt and OMnt remained low throughout the experiment, consistent with previous reports of significant anion exclusion by montmorillonite clays (Vinuth et al., Reference Vinuth, Bhojya Naik and Manjanna2015). The adsorption capacities of the composites fell between those of Fhy and the pure clays, with Fhy-Mnt_2 (having the highest Fe concentration) exhibiting the greatest capacity among all composites. The enhanced Cr(VI) adsorption capacity of Fhy-Mnt_2, which possesses the largest theoretical Fe content (66.7 wt.%), relative to Fhy-Mnt_1 (50 wt.% Fe), provides direct evidence that the adsorption capacity is positively correlated with the amount of active Fhy component in the composites. This trend supports the hypothesis that the Fe (oxyhydr)oxide fraction is the primary host for Cr(VI) sequestration. This enhanced performance can be attributed to its more positive surface charge (as confirmed by zeta-potential analysis in Fig. S5d, in the Supplementary material), which favors electrostatic attraction of anionic Cr(VI), and potentially to an improved dispersion of the Fhy nanoparticles on the clay matrix, preventing aggregation and exposing more active sites (as suggested by TEM observations in Fig. S2, Supplementary material). The sorption kinetics of Cr(VI) onto both Fhy and the composites are well fitted by the pseudo-second order model (R 2>0.999, Table S1, Supplementary material), indicating rapid adsorption and favorable interactions between Cr(VI) and the adsorbent surfaces (Yuan et al., Reference Yuan, Fan, Yang, He, Liu, Yuan, Zhu and Chen2009).
Adsorption kinetics (a) and adsorption isotherms (b) of Cr(VI) on various samples. Experimental conditions: initial Cr(VI) concentration for kinetics: 50 mg L⁻¹; adsorbent dose: 2.5 g L⁻¹; temperature: 25°C; pH 4.5.

Figure 1. Long description
A two-panel figure labeled a and b.
Panel a: Adsorption kinetics.
* The x-axis is Time in minutes, ranging from 0 to 1500.
* The y-axis is Q e in milligrams per gram, ranging from 0 to 20.
* Data trends: F h y, F h y-M n t_1, F h y-M n t_2, and F h y-O M n t show a rapid asymptotic increase in adsorption within the first 300 minutes, plateauing thereafter. F h y-M n t_2 (green triangles) shows the highest capacity at approximately 19 milligrams per gram, followed by F h y (black squares), F h y-O M n t (purple triangles), and F h y-M n t_1 (red circles). M n t (blue triangles) and O M n t (brown hexagons) remain near zero throughout the duration.
Panel b: Adsorption isotherms.
* The x-axis is C i in milligrams per liter, ranging from 0 to 120.
* The y-axis is Q e in milligrams per gram, ranging from 0 to 20.
* Data trends: All four samples (F h y, F h y-M n t_1, F h y-M n t_2, and F h y-O M n t) show a steep initial increase in adsorption capacity as concentration increases from 0 to 20 milligrams per liter. Beyond 20 milligrams per liter, the curves begin to level off. F h y-M n t_2 maintains the highest adsorption capacity across the concentration range, peaking near 18 milligrams per gram.
The adsorption isotherms (Fig. 1b) showed that the adsorbed quantity of Cr(VI) on the Fhy-Mnt composites generally increased with the Fe concentration. The Freundlich model provided a better fit than the Langmuir model for Fhy and the composites (Table S2, Supplementary material), indicating heterogeneous adsorption surfaces. Notably, the Langmuir maximum adsorption capacity (Q max) and binding constant (KL) for Fhy-Mnt_2 were greater than those for pure Fhy, implying stronger binding affinity and more available sites for Cr(VI) on this composite. This observation is consistent with its greater Fe content and associated surface sites (Table S1, Supplementary material).
Note that the background ionic strength was deliberately not controlled in the isotherm measurements. The increase in initial Cr(VI) concentration led inevitably to a slight increase in solution ionic strength, which may induce weak electrostatic screening and slightly modulate adsorption affinity (Karimi et al., Reference Karimi, Shojaei, Nematollahzadeh and Abdekhodaie2012; Katti et al., Reference Katti, Sikdar, Katti, Ghosh and Verma2006). Such subtle variations could exert a marginal influence on the fitted isotherm parameters. However, the relatively narrow concentration range and unified experimental set-up limit the ionic strength fluctuation, ensuring the reliability of the isotherm trends and mechanistic interpretation.
Microstructure and surface interactions of the composites
The XRD analyses and TEM-EDS results confirmed the successful association of Fhy with clay-mineral surfaces (Figs S1 and S2, Supplementary material). Pure Fhy appeared as agglomerates of small, irregular particles, which became more dispersed upon association with the clay minerals. STEM‑EDX mapping verified the homogeneous distribution of Fe within the composite. It further revealed (Fig. 2) that for both Fhy-Mnt_1 and Fhy-OMnt, Cr was distributed primarily in regions characterized by high Fe content, indicating that the Fhy fraction in the composites served as the primary host for adsorbed Cr(VI). The STEM-EDX maps of Fhy alone show Cr distributed across the Fhy surface (Fig. S3, Supplementary material). For Fhy-OMnt, the co-distribution of C and N with Fe suggested that some organic moieties originating from the OMnt was present on the Fhy surface. The XRD results (Fig. S1, Supplementary material) also demonstrated that the d 001 value of OMnt decreased slightly. These results indicate that some ALA was desorbed and migrated to the surface of Fhy, potentially altering its adsorptive properties.
STEM-EDX maps of elemental distribution after adsorption by: (a) Fhy-Mnt_1; and (b) Fhy-OMnt. The initial Cr(VI) concentration was 50 mg L–1, and Cr(VI) had been adsorbed completely after 24 h. The EDS spectrum corresponding to Fhy-Mnt after Cr(VI) adsorption (panel a) identifies elements O, Al, Si, Fe, and Cr; the EDS spectrum for Cr(VI)-loaded Fhy-OMnt (panel b) also detects O, Al, Si, Fe, C, Cr, and N.

Figure 2. Long description
The figure contains two primary rows, a and b.
Row a, Fhy Mnt 1:
* Far left: A S T E M micrograph with a 500 nm scale bar shows a cluster of minerals labeled Mnt and Fhy. An orange dashed square indicates the area for elemental mapping.
* Center grid: Six E D X maps with a 1 um scale bar. The first is a grayscale reference map. The others show Al in purple, Si in green, Fe in cyan, O in red, and Cr in yellow. The Cr distribution is sparse but visible across the mineral surface.
* Far right: A table for Fhy Mnt lists atomic and mass fractions for O (68.19 percent atomic), Al (1.91 percent), Si (12.50 percent), Fe (16.58 percent), and Cr (0.82 percent).
Row b, Fhy O Mnt:
* Far left: A S T E M micrograph with a 500 nm scale bar shows a similar mineral structure labeled Fhy and Mnt.
* Center grid: Eight E D X maps with a 1 um scale bar. In addition to the grayscale reference, Al (purple), Si (green), Fe (cyan), O (red), and Cr (yellow), there are two additional maps for C in blue and N in orange. The Cr signal appears more concentrated in specific regions compared to row a.
* Far right: A table for Fhy Mnt A L A lists atomic and mass fractions for C (11.80 percent atomic), N (1.25 percent), O (57.42 percent), Al (3.25 percent), Si (19.88 percent), Fe (6.10 percent), and Cr (0.30 percent).
FTIR analysis was employed to investigate the interactions between Cr(VI) and surface functional groups (Fig. 3; Fig. S4, Supplementary material; Table 2) (Katti et al., Reference Katti, Sikdar, Katti, Ghosh and Verma2006; Bu et al., Reference Bu, Liu, Yuan, Zhou, Liu and Du2019a). For pure Fhy after Cr(VI) loading, new bands at 914 cm–1 and 878 cm–1, attributed to Cr–O stretching vibrations, confirmed the adsorption of Cr(VI) (Hsia et al., Reference Hsia, Lo, Lin and Lee1993; Johnston and Chrysochoou, Reference Johnston and Chrysochoou2016). However, such spectral changes were not observed in the case of Mnt and OMnt (Fig. 3a). Almost no significant spectral variation was observed before and after Cr(VI) adsorption for pure Mnt. This suggested that the Cr(VI) binding reaction with Mnt is very weak, and the ion exchange between Cr(VI) and surface single -OH groups is limited. For OMnt, only the characteristic bands of organic moieties were changed. Both the NH3+ stretching band at 3274 cm–1 and the RCOO– band at 1498 cm–1 disappeared, revealing that the NH3+ and C=O groups participate in chelation with Cr ions during adsorption. Anionic Cr(VI) was electrostatically bound to positively charged NH3+ groups. Nevertheless, the low Cr(VI) adsorption capacity indicated that carboxyl and amino groups seem to not play a major role in the Cr(VI) binding, as previously demonstrated (Karimi et al., Reference Karimi, Shojaei, Nematollahzadeh and Abdekhodaie2012; Ren et al., Reference Ren, Xu, Wang, Gao, Yue, Song, Zhang and Wang2016). This demonstrates that the contribution of these organic functional groups to adsorption is limited, and/or that their positive effect is counteracted by the overall increased surface negativity imparted by the organic modification.
FTIR spectra of samples before and after Cr(VI) adsorption: (a) raw Mnt, OMnt, and their Cr-loaded counterparts (inset: magnified view of the 400–1500 cm⁻¹ region for Fhy and Fhy-Cr); (b) clay-associated Fe (oxyhydr)oxide composites (Fhy-Mnt_1, Fhy-Mnt_2, Fhy-OMnt) before and after Cr(VI) adsorption.

Figure 3. Long description
A two-panel line graph displaying F T I R spectra. The horizontal x-axis represents Wavenumber in inverse centimeters from 4000 to 400. The vertical y-axis represents intensity.
Panel a shows four stacked spectra. From bottom to top: M n t (black), M n t-C r (red), O M n t (blue), and O M n t-C r (purple). Key peaks are marked at 3615, 3410, 3247, 1498, 1406, 1033, 519, and 466. An inset graph at the top center focuses on the 1500 to 500 region for F h y (black) and F h y-C r (red), highlighting new peaks at 1084, 1046, 914, and 878 after chromium loading.
Panel b shows six stacked spectra for clay-associated iron oxide composites. From bottom to top: F h y-M n t_1 (black), F h y-M n t_1-C r (red), F h y-M n t_2 (blue), F h y-M n t_2-C r (purple), F h y-O M n t (brown), and F h y-O M n t-C r (olive). Vertical dashed lines align peaks across the samples at 3622, 3416, 2931, 2852, 1544, 1033, 519, and 466. The spectra for O M n t composites show additional sharp peaks in the 3000 to 2800 region compared to the M n t composites.
Band assignment of the FTIR spectra of samples before and after Cr(VI) adsorption
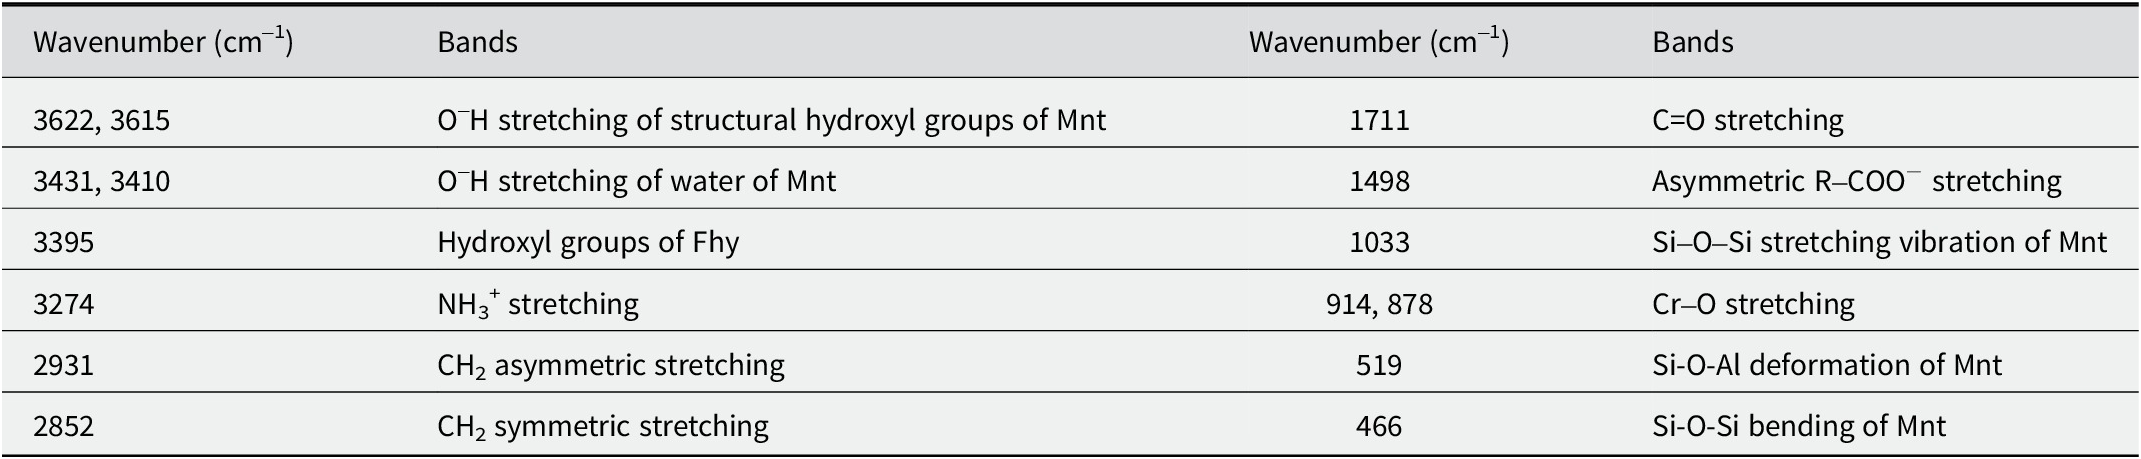
Table 2. Long description
The table is organized into two sets of paired columns for Wavenumber in inverse centimeters and their corresponding Bands.
* 3622, 3615: O hyphenH stretching of structural hydroxyl groups of Mnt.
* 3431, 3410: O hyphen H stretching of water of Mnt.
* 3395: Hydroxyl groups of Fhy.
* 3274: N H sub 3 super plus stretching.
* 2931: C H sub 2 asymmetric stretching.
* 2852: C H sub 2 symmetric stretching.
* 1711: C double bond O stretching.
* 1498: Asymmetric R hyphen C O O super minus stretching.
* 1033: Si minus O hyphen Si stretching vibration of Mnt.
* 914, 878: Cr hyphen O stretching.
* 519: Si minus O hyphen Al deformation of Mnt.
* 466: Si minus O hyphen Si bending of Mnt.
In the case of the Fhy-Mnt composites (Fig. 3b), the intensity of the structural O-H stretching bands (~3622 cm–1) of Mnt weakened, suggesting the participation of these groups in the adsorption reaction. A red shift of the hydroxyl combination band (~3416 cm–1) was observed, indicating a decrease in electron density around the O-H groups, consistent with the donation of lone pair electrons to Cr(VI) via surface complexation (Bulin et al., Reference Bulin, Li, Zhang and Zhang2020). This points to the formation of an inner-sphere complex between Cr(VI) and surface hydroxyls on the composites (Ding et al., Reference Ding, Fu, Dionysiou and Tang2018). A comparable observation has been reported in previous work (Ren et al., Reference Ren, Xu, Wang, Gao, Yue, Song, Zhang and Wang2016). For Fhy-OMnt, the appearance of a new band at 1544 cm–1 (Fig. 3b), attributed to amide II formed possibly via polymerization of ALA molecules in solution (Bu et al., Reference Bu, Yuan, Liu, Liu, Qin, Zhong, Song and Li2019b), suggested the involvement of organic functional groups in the adsorption process, probably likely through complexation with the carboxyl groups (Kim et al., Reference Kim, Park, Hong, Choi and Yang2011). The obvious shifts of Si–O, Al–OH and Fe–O absorption bands further imply the formation of interfacial Fe–O–Si chemical bonding between Fe(oxyhydr)oxide and Mnt, rather than simple physical blending.
Surface composition and Cr speciation from XPS and XANES analysis
Analysis by XPS confirmed the substantial adsorption of Cr on the composite surfaces, as indicated by the significantly enhanced Cr signal intensity relative to pure clay minerals (Fig. S5a, Supplementary material). The deconvolution of the Cr 2p spectra (Zhang et al., Reference Zhang, Zhao, Hui, Sun, Sun, Tian, Zhang, Zhang and Xia2021) (Fig. S6a–c, Supplementary material) for the composites revealed that the Cr adsorbed on the composite surfaces existed as a mixture of species. While Cr(VI) was the dominant adsorbed species (Chidambaram et al., Reference Chidambaram, Halada and Clayton2001; Biesinger et al., Reference Biesinger, Payne, Grosvenor, Lau, Gerson and Smart2011; Hu et al., Reference Hu, Xue, Tang, Fan and Chen2019), the spectra for the composites (Fhy-Mnt_1, Fhy-Mnt_2, Fhy-OMnt) showed contributions at binding energies that differ from those of pure Cr(VI) standards. These spectral features can be attributed to strong chemical interactions, such as the formation of inner-sphere complexes between Cr(VI) oxyanions and the surface functional groups (e.g. Fe-OH), which significantly alter the electronic environment of the adsorbed Cr and induce photoelectron peak shifts. This finding is consistent with the chemisorption behavior identified from the FTIR results.
To further probe the local chemical environment of the adsorbed chromium, Cr L-edge XANES analysis was conducted (Fig. 4). The spectra of the Cr(VI)-loaded composite surfaces were distinct from those of the Cr(III) and Cr(VI) model compounds. Crucially, the composite spectra did not match the characteristic line shape of Cr(III), indicating that the majority of the adsorbed Cr remained in the +6-oxidation state. However, the subtle differences in the white-line intensity and post-edge features compared with the pure Cr(VI) reference suggest a strong perturbation of the Cr(VI) molecular orbitals upon adsorption. This is a known effect when Cr(VI) forms inner-sphere complexes, as the coordination to the surface atoms modifies its electronic structure. Thus, the XANES data strongly support the conclusion that the primary mechanism of immobilization is strong chemisorption via complexation, rather than reductive precipitation. No dissolved Cr(III) was detected in the suspensions of clay-associated Fe (oxyhydr)oxides, as the difference between total Cr and Cr(VI) concentrations in solutions was negligible (Table S3, Supplementary material).
Cr L-edge XANES spectra of Cr(VI)-loaded Fhy-Mnt and Fhy-OMnt composites, along with reference standards (Cr2O3 and K2Cr2O7): (a) full spectra; (b) enlarged view of the pre-edge region, with the percentages indicating the relative proportion of Cr(VI) derived from linear combination fitting.

Figure 4. Long description
The figure consists of two panels, a and b.
Panel a shows the full X A N E S spectra. The x-axis represents Photon Energy in e V, ranging from 600 at the left to 570 at the right. The y-axis represents intensity. Four curves are stacked vertically. From top to bottom, they are labeled C r sub 2 O sub 3, K sub 2 C r sub 2 O sub 7, Fhy-Mnt_2, and Fhy-OMnt. The C r sub 2 O sub 3 curve shows two broad peaks around 585 and 578 e V. The K sub 2 C r sub 2 O sub 7 curve shows a sharp pre-edge peak near 589 e V and a distinct double peak structure between 582 and 578 e V. The composite samples Fhy-Mnt_2 and Fhy-OMnt show broader features that combine characteristics of the standards. A dashed rectangular box highlights the pre-edge region between 592 and 584 e V, with an arrow pointing to panel b.
Panel b is an enlarged view of the pre-edge region. The x-axis ranges from 591 to 583 e V.
* The top curve, C r sub 2 O sub 3, shows a low-intensity broad feature.
* The second curve, K sub 2 C r sub 2 O sub 7, shows a high-intensity sharp peak at 589 e V.
* The third curve, Fhy-Mnt_2, shows a multi-peak fitting. Three sub-peaks are identified with arrows and percentages: 31.07 percent, 31.33 percent, and 37.60 percent.
* The bottom curve, Fhy-OMnt, also shows a multi-peak fitting with three sub-peaks labeled: 29.36 percent, 35.07 percent, and 35.57 percent.
To gain a comprehensive understanding of the elemental involvement in Cr(VI) sequestration, we examined, via XPS, the surface composition of the composites before and after adsorption. The survey spectra (Fig. 5a) confirmed the expected elements (Fe, O, Al, Si) and revealed a reduced intensity in the Si and Al peaks post-adsorption, suggesting potential interactions or coverage at the clay mineral sites. Furthermore, noticeable changes in the peak shapes of Fe, C, and O were observed, indicating their active participation in the adsorption process. This was corroborated by high-resolution spectra: the increase in Fe 2p binding energies (Fig. 5b) pointed to a direct chemical interaction between Cr(VI) oxyanions and the Fe (oxyhydr)oxide surfaces, probably through coordination that alters the local electronic environment of Fe. Crucially, the absence of significant Fe(II) signals (Fig. 5b) rules out a major reductive transformation of the Fe phase, thereby excluding it as a primary electron donor for Cr(VI) reduction and aligning with the XANES conclusion that adsorption, not reduction, is the dominant mechanism.
XPS analysis of Fhy-Mnt_2 and Fhy-OMnt before and after Cr(VI) adsorption. (a) Survey spectra confirming the presence of Cr on the surface after adsorption; (b) high-resolution Fe 2p spectra; (c) high-resolution O 1s spectra; (d) high-resolution C 1s and N 1s spectra of Fhy-OMnt before and after Cr(VI) uptake.

Figure 5. Long description
Panel a displays stacked survey spectra for Fhy-OMnt-Cr, Fhy-OMnt, Fhy-Mnt_2-Cr, and Fhy-Mnt_2. The x-axis is Binding Energy in e V from 1300 to 0. Labeled peaks include Mg 1 s, Fe 2 p, Cr 2 p, O 1 s, N 1 s, C 1 s, Si 2 p, and Al 2 p.Panel b shows Fe 2 P high-resolution spectra for the four samples. Each graph has an x-axis from 736 to 704 e V. Peaks are deconvoluted into multiple curves with specific binding energy labels. For Fhy-Mnt_2, peaks are at 726.9, 724.6, 713.3, and 710.9. For Fhy-Mnt_2-Cr, peaks are at 727.0, 724.7, 713.4, and 711.1. For Fhy-OMnt, peaks are at 726.4, 724.4, 712.8, and 710.7. For Fhy-OMnt-Cr, peaks are at 726.0, 715.2, and 712.0.Panel c shows O 1 s spectra from 540 to 525 e V. Fhy-Mnt_2 has peaks at 531.8 and 529.8. Fhy-Mnt_2-Cr has peaks at 533.6, 532.0, and 530.0. Fhy-OMnt has peaks at 533.8, 532.2, and 530.5. Fhy-OMnt-Cr has peaks at 532.1, 531.0, and 530.0.Panel d shows C 1 s and N 1 s spectra. C 1 s spectra range from 294 to 282 e V. Fhy-OMnt has peaks at 288.5, 287.0, 285.9, and 284.8. Fhy-OMnt-Cr has peaks at 288.6, 286.3, and 284.9. N 1 s spectra range from 408 to 396 e V. Fhy-OMnt has peaks at 403.3, 402.2, and 400.0. Fhy-OMnt-Cr has peaks at 402.9, 400.5, and 398.8.
Panel b shows high-resolution Fe 2p spectra in four sub-plots. The x-axis ranges from 736 to 704 e V. Each plot shows a complex curve fitted with multiple peaks. In Fhy-Mnt_2, peaks are at 726.9, 724.6, 713.3, and 710.9. In Fhy-Mnt_2-Cr, peaks shift to 727.0, 724.7, 713.4, and 711.1. In Fhy-O Mnt, peaks are at 726.4, 724.4, 712.8, and 710.7. In Fhy-O Mnt-Cr, peaks are at 726.0, 715.2, 712.0.
Panel c shows high-resolution O 1s spectra in four sub-plots. The x-axis ranges from 540 to 525 e V. Fhy-Mnt_2 shows a dominant peak at 531.8 and a smaller one at 529.8. Fhy-Mnt_2-Cr shows peaks at 533.6, 532.0, and 530.0. Fhy-O Mnt shows peaks at 533.8, 532.2, and 530.5. Fhy-O Mnt-Cr shows peaks at 532.1, 531.0, and 530.0.
Panel d shows high-resolution C 1s and N 1s spectra. C 1s plots (top) range from 294 to 282 e V. Fhy-O Mnt has peaks at 288.5, 287.0, 285.9, and 284.8. Fhy-O Mnt-Cr has peaks at 288.6, 286.3, and 284.9. N 1s plots (bottom) range from 408 to 396 e V. Fhy-O Mnt shows peaks at 403.3, 402.2, and 400.0. Fhy-O Mnt-Cr shows peaks at 402.9, 400.5, and 398.8.
The O 1s spectra (Fig. 5c) provide further evidence for this surface complexation. Upon adsorption, the -OH content of Fhy-Mnt_2 decreased (from 93.20 to 76.13%), whereas the Fe-O content increased (from 6.34 to 21.25%). This observation indicates that Cr(VI) ions interact with surface hydroxyl groups, leading to the formation of Fe–O–Cr bonds. For Fhy-OMnt, the disappearance of the C=O component and the emergence of a defined Fe-O peak suggest that carboxyl groups participated in the adsorption, probably through coordination, and that iron oxide surfaces remains the primary sites for Cr(VI) binding. High-resolution C 1s and N 1s spectra of Fhy-OMnt are presented in Fig. 5d. After Cr(VI) adsorption, the disappearance of the C-N band and the transformation of nitrogen species (e.g. the appearance of pyrrolic N) indicate that the organic modifier is involved directly in the adsorption process. These spectral changes are consistent with the coordination of chromium species to the N-containing and O-containing functional groups of the organic matter, further contributing to the immobilization of Cr(VI) through complexation.
Combined XPS and XANES characterizations indicate that Cr(VI) immobilization proceeds predominantly via inner-sphere complexation, rather than reduction to Cr(III). The spectral shifts observed in both techniques are characteristic of strong chemical interaction between Cr(VI) oxyanions and the composite surfaces (particularly Fe-OH groups), which alters the electronic structure of Cr without changing its oxidation state.
Proposed adsorption mechanism
Based on structural and macroscopic adsorption results, Mnt acts as a stable supporting matrix to disperse Fe(oxyhydr)oxide nanoparticles and prevent their aggregation. Combined with XRD and FTIR analyses, organic modifier ALA can be partially intercalated into Mnt interlayers or adsorbed on the external surface, while Fe (oxyhydr)oxide species are partially intercalated into the interlayer space and predominantly deposited on the edges and external surface of Mnt (Fig. S1, Supplementary material). Spectral shifts of Si–O, Al–OH, and Fe–O vibration bands in FTIR spectra further confirm the formation of interfacial Fe–O–Si chemical bonding between Fe(oxyhydr)oxide and clay structure, rather than simple physical mixing, which provides the composite with a stable interfacial structure and abundant available active sites.
Cr(VI) removal by Fhy-Mnt and Fhy-OMnt composites occurs via two dominant coupled pathways (Fig. 6): inner-sphere complexation and electrostatic attraction. Surface charge plays a critical role in governing electrostatic adsorption behavior. At the experimental pH, the dominant Cr(VI) species exists as HCrO4− (Ajouyed et al., Reference Ajouyed, Hurel, Ammari, Ben Allal and Marmier2010; Zhu et al., Reference Zhu, Huang, Li, Wang and Yang2021). Zeta potential results measured at pH 5, 7, and 9 (Fig. S5d, Supplementary material) reveal that Fhy-Mnt_2 maintains positive surface charge at pH 5 and gradually becomes negatively charged as pH increases. Following this electrostatic variation trend, Fhy-Mnt_2 can be reasonably inferred to be positively charged at pH 4.5, which facilitates favorable electrostatic attraction toward anionic Cr species and accounts for its optimal adsorption capacity.
Schematic diagram of Cr(VI) adsorption mechanisms on montmorillonite–Fe (oxyhydr)oxide composites, including outer-sphere electrostatic attraction and inner-sphere ligand exchange.

Figure 6. Long description
At the top of the diagram are two chemical equations. Equation 1 shows triple bond F e hyphen O H sub 2 super plus plus H C r O sub 4 yields triple bond F e hyphen O H sub 2 super plus dot dot dot H C r O sub 4 . Equation 2 shows triple bond F e hyphen O H plus H C r O sub 4 super minus yields triple bond F e hyphen [H C r O sub 4] plus O H super minus.
The central circular diagram is divided into two halves. The left half, shaded blue, is labeled Inner-Sphere Complexation. The right half, shaded orange, is labeled Electrostatic Attraction.
Inside the circle, there is a layered structure. The core consists of two horizontal T O T layers of M n t, depicted as pink and orange mineral sheets. Interspersed between and around these layers are yellow crystalline structures labeled F h y and gray molecular clusters labeled O M with N H sub 3 super plus functional groups.
In the blue Inner-Sphere Complexation zone on the left, blue circles containing C r (V I) are directly bonded to the mineral structure, indicated by the labels F e hyphen O hyphen C r.
In the orange Electrostatic Attraction zone on the right, yellow circles containing C r (V I) are positioned near the mineral surface without direct bonding, associated with the label F e hyphen O H sub 2 super plus.
A legend at the bottom identifies the components from left to right. A pink and orange sheet is a T O T layer of M n t. A yellow crystalline structure is F h y. A gray molecular cluster is O M.
Solution pH substantially regulates Cr(VI) speciation, surface electrostatic properties, and the relative contribution of the two adsorption pathways across a wide pH range. At pH <6.0, Cr(VI) exists predominantly as HCrO4−, and abundant protonated >Fe–OH groups on the composite surface tend to form bidentate inner-sphere complexes with HCrO4− via ligand exchange (Huang et al., Reference Huang, Hou, Song, Zhao and Zhang2016; Li et al., Reference Li, Guo, Jin, He, Yao, Lu and Dang2021). As pH rises to the neutral range (pH 6–8), Cr(VI) gradually converts from HCrO4− to CrO42−, and the gradual deprotonation of Fe(oxyhydr)oxide surfaces weakens electrostatic attraction. Nevertheless, intrinsic ≡Fe–OH active sites still coordinate with Cr(VI) to form stable monodentate inner-sphere complexes (Xie et al., Reference Xie, Gu, Tong, Zhao and Tan2015; Huang et al., Reference Huang, Hou, Song, Zhao and Zhang2016; Li et al., Reference Li, Guo, Jin, He, Yao, Lu and Dang2021). Even under weakly alkaline conditions (pH 8–9), despite increased surface negative charge and reduced overall adsorption capacity, ligand exchange between Cr(VI) and Fe hydroxyl sites remains effective, indicating that pH variation mainly modulates the contribution ratio of electrostatic attraction and inner-sphere complexation, rather than invalidating the intrinsic ligand exchange mechanism (Huang et al., Reference Huang, Hou, Song, Zhao and Zhang2016; Veselska et al., Reference Veselska, Fajgar, Cihalova, Bolanz, Gottlicher, Steininger, Siddique and Komarek2016; Li et al., Reference Li, Guo, Jin, He, Yao, Lu and Dang2021).
Beyond electrostatic interactions, specific chemical ligand exchange governs the irreversible immobilization of Cr(VI). Adsorption isotherms, together with FTIR and XPS spectroscopic evidence, confirm the formation of inner-sphere surface complexes. Cr(VI) is immobilized preferentially at Fe-OH active sites on Fhy, as evidenced by hydroxyl‑related spectral shifts and strong spatial overlap between Cr and Fe elemental distributions in TEM mapping. The ligand exchange processes can be summarized as follows:
-
(1) Outer-sphere precursor driven by electrostatic attraction:
$$ \equiv \mathrm{F}\mathrm{e}{\textstyle \hbox{--} }{{\mathrm{OH}}_2}^{+}+{{\mathrm{HCrO}}_4}^{{\textstyle \hbox{-}}}\to \equiv \mathrm{F}\mathrm{e}{\textstyle \hbox{--} }{{\mathrm{OH}}_2}^{+}\cdots {{\mathrm{HCrO}}_4}^{{\textstyle \hbox{-}}} $$
-
(2) Inner-sphere complexation via ligand exchange:
$$ \equiv \mathrm{F}\mathrm{e}{\textstyle \hbox{--}}\mathrm{O}\mathrm{H}+{{\mathrm{HCrO}}_4}^{{\textstyle \hbox{-}}}\to \equiv \mathrm{F}\mathrm{e}{\textstyle \hbox{--} }[{\mathrm{HCrO}}_4]+{\mathrm{OH}}^{{\textstyle \hbox{-}}} $$


The final immobilized Cr(VI) exists mainly as surface-bound ≡ Fe–[HCrO4] or ≡ Fe–[CrO4]⁻. For organically modified Fhy-OMnt, protonated amino groups (R-NH3+) provide additional positively charged sites for electrostatic attraction, while carboxyl groups participate in weak surface interactions. Nevertheless, Fhy-OMnt exhibits a lower adsorption capacity than Fhy-Mnt, implying that the adverse impacts of organic modification, including active site blocking and enhanced surface electronegativity, outweigh the beneficial contribution of organic functional groups. Furthermore, organic moieties do not modify the coordination microenvironment of Cr(VI), and no obvious Cr–C or Cr–O–C bonding is formed upon adsorption.
Variations in the specific surface area (SSA) among the composites further supports the discrepancy in adsorption performance (Table S4, Supplementary material). The SSA increases with an elevated Fe/clay ratio, and Fhy-Mnt_2 exhibits the largest SSA. Co-precipitation of Fhy generates abundant meso- and macroporous structure, providing more accessible interfacial sites and mass-transfer channels for Cr(VI) transport and adsorption. This further accounts for the superior removal efficiency of Fhy-Mnt_2.
In summary, the Cr(VI) adsorption performance is governed primarily by the Fe/clay ratio, which determines the density of Fe-OH active sites and surface electrostatic characteristics. In comparison, organic modification modulates adsorption affinity via regulating surface chemistry and site accessibility. Ligand exchange during inner-sphere complexation releases OH− and slightly elevates the equilibrium solution pH. This phenomenon aligns with the inherent properties of ligand exchange and further validates the proposed adsorption mechanism.
Immobilization of Cr(VI) in contaminated soil and environmental implications
While batch aqueous adsorption experiments provide mechanistic insights and baseline adsorption capacity, the practical environmental applicability of a sorbent ultimately requires verification in realistic and complex soil matrices. To evaluate the potential of the optimized Fhy-Mnt_2 composite for in situ remediation, a preliminary soil incubation experiment was performed to assess its Cr(VI) immobilization performance in contaminated soil. As shown in Fig. S7 (Supplementary material), the leachable and bioavailable Cr(VI) fractions decreased markedly after 24 h of incubation with Fhy-Mnt_2 amendment. Compared with the unamended control group, the composite reduced mobile Cr(VI) by 30.5%, confirming its capability to sequester Cr(VI) even in complex soil media containing natural OM, native minerals, and coexisting solutes. This finding bridges the gap between ideal single-solute aqueous systems and practical soil conditions, confirming that the composite retains favorable immobilization performance under realistic environmental conditions.
Note, however, that the adsorption mechanisms and microscopic behaviors elucidated in the present study were derived under well-controlled laboratory conditions with a fixed acidic pH of 4.5 and single-solute Cr(VI) solutions, which imposes inherent limitations on direct extrapolation of laboratory findings to natural soil systems. Actual soil environments exhibit substantial temporal and spatial variations in ambient pH and background ionic strength, along with ubiquitous competing anions, including phosphate, sulfate, and silicate (Essington and Stewart, Reference Essington and Stewart2018; Sabur et al., Reference Sabur, Parsons, Maavara and Van Cappellen2021). These coexisting constituents can compete with chromate for available Fe-OH active sites via ligand exchange and suppress inner-sphere complexation. Meanwhile, fluctuations in pH and ionic strength alter surface electrostatic properties and induce electrostatic screening, further governing adsorption affinity and the relative contribution ratio between electrostatic attraction and inner-sphere complexation (Hiemstra and Van Riemsdijk, Reference Hiemstra and Van Riemsdijk1996; Shi et al., Reference Shi, Wang, Zhong, Chen, Feng and Yang2024). In this context, the present work clarifies the intrinsic interfacial interactions and Cr(VI) immobilization mechanisms of Fe(oxyhydr)oxide-Mnt composites under simplified experimental conditions. Nevertheless, practical field applications require further systematic evaluation by considering multi-ion competition, soil pH buffering effects, and variable ambient water chemistry.
Remediation of Cr(VI)-polluted soil remains challenging, particularly at multi-contaminated field sites. Highly reactive reductants such as ZVI (zerovalent iron) and FeS2 can achieve >99% Cr(VI) removal via chemical reduction of soluble Cr(VI) to less mobile Cr(III). Nevertheless, such aggressive chemical strategies may cause ecological disturbance and are less cost-effective for large-area, moderately contaminated sites (Min et al., Reference Min, Li, Zhang, Liu, Xie, Guo, Liao, Yang and Yang2021). In contrast, the Fhy–Mnt_2 composite developed in this study achieves a 30.5% Cr(VI) immobilization rate within a short incubation period. Although this efficacy is moderate relative to chemical reductants, the material possesses distinct merits for sustainable soil management.
The core environmental implication of this composite resides in its capacity to enhance the natural attenuation potential of indigenous soil components. In clay-rich soils, native Mnt and iron oxides contribute to trace heavy metal retention. The as-prepared composite acts as an engineered reactive analogue of natural soil constituents, generating abundant reactive interfacial sites to form immobilization ‘hot spots’ and accelerate the spontaneous Cr(VI) sequestration process. As reported by Li et al. (Reference Li, Li, Zhan, Hou, Zhang, Wu, Ding, Lv and Xu2024), appropriate soil amendments can stabilize heavy-metal contaminants and optimize soil microenvironments. Similarly, Fhy-Mnt_2 immobilizes Cr(VI) predominantly through interfacial adsorption rather than drastic chemical speciation transformations, thus avoiding ecological risks and soil disturbance caused by strong chemical reductants. With optimized surface properties and sufficient adsorption sites, the composite improves soil conditions and favors in situ heavy-metal stabilization. This assisted natural attenuation strategy is particularly suitable for large‑scale low-to-moderately contaminated sites. It provides a low-cost, minimally invasive alternative to aggressive chemical remediation and supports the establishment of an eco-friendly, stable, long-term efficient system for contaminated soil remediation.
In summary, the environmental significance of Fhy-Mnt_2 does not reside in pursuing ultra-high removal efficiency comparable to chemical reductants. Rather, it offers a milder, ecologically compatible, and integratable green remediation alternative. The composite is suitable either as a pretreatment unit within a multi-stage remediation train or as a standalone amendment for large-scale low-to-moderately Cr(VI)-contaminated sites, balancing contaminant immobilization, the protection of soil ecological functions, and long-term geochemical stability.
Conclusions
This study investigated systematically Cr(VI) adsorption onto Mnt-Fe(oxyhydr)oxide composites, with an emphasis on the effects of Fe/clay mass ratio and organic modification on adsorption behavior and interfacial mechanisms. The main conclusions are summarized as follows:
-
(1) The as‑synthesized composites exhibited favorable Cr(VI) adsorption performance, with adsorption capacity between values for pure Fhy and raw Mnt. The adsorption kinetics and isotherms were well fitted by the pseudo-second order model and Freundlich model, respectively, suggesting that Cr (VI) adsorption occurred on heterogeneous surfaces and was governed by interfacial interactions and the availability of surface-active sites.
-
(2) The Fe/clay ratio was identified as a primary factor governing Cr(VI) adsorption capacity, which determined directly surface positive charge, the abundance of Fe-OH active sites, and SSA. The composite Fhy-Mnt_2, which possessed the highest Fe/clay ratio, exhibited the maximum adsorption performance, further confirming the decisive contribution of Fe(oxyhydr)oxide phases toward Cr(VI) retention.
-
(3) Organic modification introduced additional amino and carboxyl functional groups that could participate in electrostatic interactions with Cr(VI). Nevertheless, the organic modification also partially occupied reactive sites and increased surface electronegativity, ultimately lowering the overall adsorption capacity. Organic moieties therefore exert a regulatory rather than dominant effect on the Cr(VI) immobilization capability of clay-Fe composites.
-
(4) Electrostatic attraction and inner-sphere complexation with Fe-OH groups were identified as the main adsorption mechanisms. Spectroscopic results confirmed that Cr(VI) was predominantly bound to the Fhy component in the form of stable surface complexes, without obvious redox transformation.
This work clarifies the structure–activity relationships among Fe/clay ratio, organic modification, and Cr(VI) adsorption performance, filling the research gap regarding interface interactions within ternary organo-mineral systems. The results not only improve the understanding of Cr(VI) migration and transformation in natural soils, but also provide a feasible strategy for developing low-cost, environmentally friendly clay-based remediation materials. The optimized Fhy-Mnt_2 composite shows great potential for the in situ immobilization of Cr(VI) in acidic contaminated water and soil. Future work will test its performance under dynamic-flow conditions and across a broad pH range to assess its practical application value.
Supplementary material
The supplementary material for this article can be found at http://doi.org/10.1017/cmn.2026.10044.
Author contribution
Hongling Bu: Writing – original draft, review & editing, Methodology, Conceptualization; Hanjie Chen: Writing, Investigation, Data curation; Manjia Chen: review & editing, Supervision, Funding Acquisition; Shujie Hu: Writing, review & editing; Wenpo Xu: Writing, review & editing; Zhou Junming: Investigation, Formal analysis; Yanfu Wei: Writing – review & editing; Chengshuai Liu: review & editing
Acknowledgments
None.
Financial support
This work was supported by the National Natural Science Foundation of China (no. 4247020132, 42107046 and 42025705), and the Open Funds of SSRF (no. 2019-SSRF-PT-008777).
Competing interests
The authors declare none.
Data availability statement
All data that support the findings of this study are available within the article and its supplementary materials.