1. Introduction
The role of the discount rate has received a great deal of attention in recent years, with climate change being one of the main applications. Since the publication of the Stern Review in 2006, the debate among economists has been further intensified, concluding that the discount rate is one of the most important single factors in determining, e.g., the optimal price of carbon. Stern (Reference Stern2006) assumed a rather low social discount rate of 1.4 per cent, leading to a social cost of carbon above US$ 300 per ton of carbon, a result which was mainly driven by the choice of this rather low discount rate. Nordhaus (Reference Nordhaus2007), for instance, shows that by using a discount rate of 3–4 per cent instead, this value would be reduced to around US$ 30 per ton of carbon. The concept of intergenerational equity, or how we compare today's and future generations, is thus pivotal for deriving policy recommendations. Besides different levels of per-capita consumption (due to economic growth), uncertainty, or the availability of environmental services, different generations are also characterized by potentially different degrees of inequality, which adds another layer of complexity to the evaluation of the trade-off of future versus present consumption (Schelling, Reference Schelling1995). In the context of economic development, the importance of inequality for the social discount rate has been raised in UNDP (2007). This paper provides a more formal yet practical analysis of this point.
The theory of the social discount rate argues that the discount rate in a first-best world should reflect the opportunity cost of an investment today with future payoffs, the idea being that any investment project should be compared to other potential projects. The classical optimal growth model dating back to Ramsey (Reference Ramsey1928) states that the social (consumption) discount rate (SDR) depends on the pure rate of time preference of the social planner, and today's and tomorrow's marginal utility of consumption. That is, the curvature of the utility function on the one hand, and the growth of consumption over time on the other, are the main determinants for the value of the discount rate. This result can be illustrated using the Ramsey-Keynes condition or Ramsey rule for the discount rate.
There have been several extensions of this model, in particular considering the role of uncertainty for the discount rate, see Weitzman (Reference Weitzman1998) and Gollier (Reference Gollier2002). Recent works include the extension of the different types of uncertainty (Gollier, Reference Gollier2008; Weitzman, Reference Weitzman2009; Gollier and Weitzman, Reference Gollier and Weitzman2010), ambiguity aversion (Gierlinger and Gollier, Reference Gierlinger and Gollier2008), and the differentiation between different goods (Sterner and Persson, Reference Sterner and Persson2007; Gollier, Reference Gollier2010). Moreover, heterogeneity of the pure rate of time preference has been studied (see Gollier and Zeckhauser (Reference Gollier and Zeckhauser2005) and Jouini et al. (Reference Jouini, Marin and Napp2010)). In these models, however, a system of perfect risk sharing and perfect capital markets is assumed. The assumption of risk sharing between agents allows different degrees of time preference to be insured against each other.
The role of regional heterogeneity, in particular of income or consumption inequality, has been pointed out qualitatively already in Stern (Reference Stern2006: 32). UNDP (Reference Traeger2007) and Conceiao and Zhang (Reference Conceiao and Zhang2010) recently stressed the potential importance of inequalities on the discount rate, in particular under the development perspective. While the role of uncertainty for the discount rate has been widely studied, less is known about the effect of inequality. Azar and Sterner (Reference Azar and Sterner1996) is a notable exception, which combines discounting and inequality concerns using a stylized two-region model. More recently, Gollier (Reference Gollier2015) analyzed the role of convergence on the conceptual level for the discount rate, while Fleurbaey and Zuber (Reference Fleurbaey and Zuber2015) studied discounting under risk and inequality at the conceptual level. This paper is most related to these studies, but has a more applied focus, deriving applicable discounting rules including the use of available aggregated inequality measures to compute the SDR taking inequality into account.
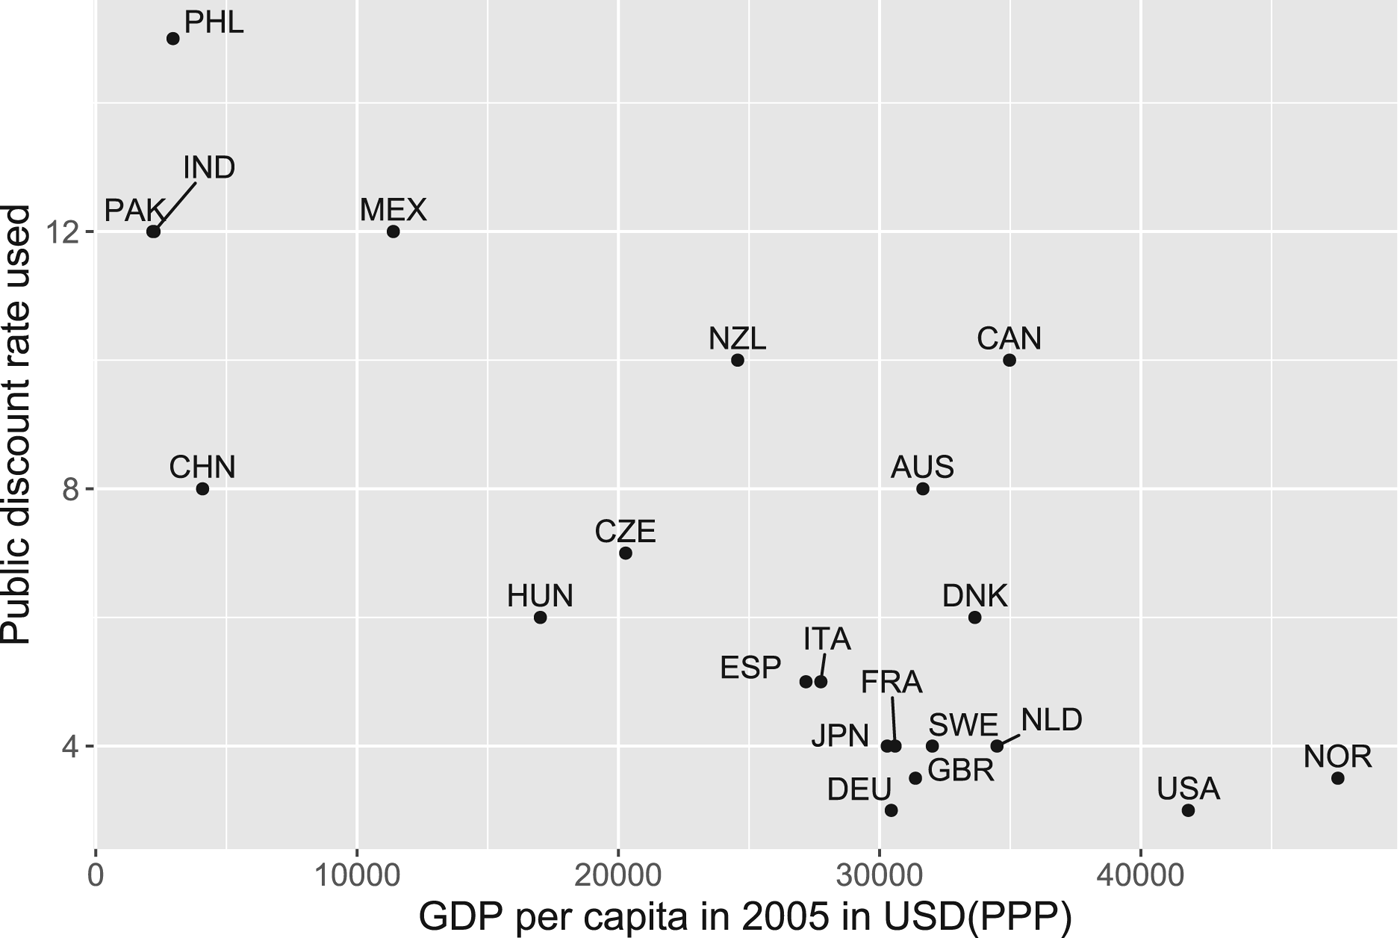
Indeed, in practice, the SDRs applied in public policy analysis vary substantially across countries. This variation stems from different methods used, but also economic conditions. For instance, figure 1 Footnote 1 shows that poorer countries typically apply considerably higher discount rates than richer countries.
Officially used discount rates and GDP per capita across countries.

In other words, the question of how much a person is ready to give up today in order to improve the wellbeing of future generations will be answered differently by richer or poorer countries with different growth prospects. Moreover, aggregating discount rates across world regions is not trivial in this case. In this paper, we therefore provide a theoretical analysis of the optimal consumption discount rate, considering not only intergenerational equity, but also intragenerational equity (inequality), deriving a tractable SDR formula for this case. We isolate the effect of the level of inequality and its evolution over time on the discount rate, which should be used for projects or policies on a country or global level. We characterize the SDR in a world with inequality and identify the difference from the standard Ramsey rule. We then use scenarios that have been used in the literature on climate change in order to calibrate the model and derive the magnitude and term structure of the SDR. The results suggest a higher but decreasing discount rate at the global level as compared to the case without inequality, due to projected convergence across countries. We also disentangle inequality aversion from risk aversion and resistance to intertemporal substitution and show that the effect, when applied to individual countries, can go in both directions depending on projected inequality changes over time. Our analysis particularly applies in the context of high inequality when it comes to the evaluation of long-term public policy projects.
2. The social discount rate with intragenerational equity
We start deriving the SDR by considering a marginal project, which costs one unit of consumption today and yields
 $e^{r_{t}t}$
units of consumption at date t with certainty. If intertemporal welfare remains constant by investing in such a project, r
t
is precisely the social consumption discount rate. If the welfare function used is exponentially discounted utility (with utility discount rate δ) and with a utility function exhibiting constant relative risk aversion (CRRA) (with parameter η ), we obtain the well-known Ramsey rule rt = δ + ηgc
, where g
c
represents the annual growth rate of consumption from today until time t, see, e.g., Gollier (Reference Gollier2011).
Now we will consider the distribution of consumption at each point in time. We can frame the problem either as concerning n individuals within a country, or alternatively consider the global case with n individual countries. Analytically, the two cases are equivalent, and what matters is whether we want to compute a national or the global SDR. In the analytical part, we will use the wording for the global discount rate based on n countries. We consider a project, which is implemented on the global level, and for which the costs and benefits accrue to each country proportional to its population size. We assume that the project will affect every individual in a given country equally, in that it affects average per-capita consumption. We consider n countries and denote by c
it
the per capita consumption in country i at date t. In terms of income or consumption distribution at the global level, we consider what Bourguignon et al. (Reference Bourguignon, Levin and Rosenblatt2006) call the international distribution of income as population weighted inequality between countries’ per capita incomes. We denote by π
it
the share of country i’s population of the world population P
t
. In the following, we assume that the population does not change over time in order to get cleaner analytical solutions, i.e.,
 $P_{t}=P,\pi _{it}=\pi _{i}\forall t$
. However, allowing for population to vary is straightforward to include in the formula for the discount rate. To keep notation simple, in this section we moreover abstract from uncertainty, which does not affect the result qualitatively. In the next section we reintroduce uncertainty for the disentangled case.
When aggregating utilities, we follow the standard approach of using the discounted utilitarian welfare framework based on expected utility. We use a social welfare function (SWF) of the Benthamite/Utilitarian type, weighting each individual equally; therefore we can write global welfare as
 $W_{t}=\sum\nolimits_{i=1}^{n}\pi _{i}PU(c_{it})$
. Using a standard increasing and concave utility function U(c) and exponential utility discounting with a pure rate of time preference δ, we can express discounted utility in country i at time t as
 $e^{-\delta t}U(c_{it})$
. The cost of the given marginal project with a rate of return r
t
in terms of social welfare can then be expressed as the sum of marginal utilities today as
 $\sum\nolimits_{i=1}^{n}\pi _{i}PU^{\prime }(c_{i0})$
. The benefits at date t on the other hand can be written as
 $e^{r_{t}t} \left[ \sum\nolimits_{i=1}^{n}\pi _{i}PU^{\prime }(c_{it})e^{-\delta t} \right] $
. In general, the project would then be socially desirable in that if
 $\sum\nolimits_{i=1}^{n}\pi _{i}U^{\prime }(c_{i0})\leq e^{r_{t}t}\left[ \sum\nolimits_{i=1}^{n}\pi _{i}U^{\prime }(c_{it})e^{-\delta t} \right] $
. Hence we can derive the SDR for the time horizon t as the rate of return which would make the social planner just indifferent between accepting or rejecting this project. In this case this condition holds with equality and it can be solved for r
t
, the average discount rate between dates 0 and t, as
 $$r_{t}=\delta -{1 \over t}\ln {\sum\nolimits_{i=1}^{n}\pi _{i}[U^{\prime }(c_{it})] \over \sum\nolimits_{i=1}^{n}\pi _{i}U^{\prime }(c_{i0})}.$$
This version of the Ramsey rule looks somewhat similar to the case under uncertainty, yet there is a substantial difference: while uncertainty affects only future consumption, inequality is considered also today. We can derive a different interpretation of the SDR (1) by introducing a weighting scheme denoting by
 $\bar{\pi}_{i}$
the weight of country i based on today's marginal utility, i.e.,
 $\bar{\pi}_{i}\equiv {\pi _{i}U^{\prime }(c_{i0})}/{\sum\nolimits_{j=1}^{n}\pi _{j}U^{\prime }(c_{jo})}.$
Footnote
2
This allows us to rewrite the discount rate as
 $$r_{t}=\delta -{1 \over t}\ln \sum\nolimits_{i=1}^{n}\bar{\pi}_{i}{U^{\prime }(c_{it}) \over U^{\prime }(c_{i0})},$$
and shows that each country's contribution to the global discount rate is weighted by today's population-weighted marginal utility. These weights are similar to equity weights in evaluation impacts from climate change as proposed by Fankhauser et al. (Reference Fankhauser, Tol and Pearce1997).
To determine the impact of inequality considerations on the SDR, we need to compare (2) with the appropriate version without the consideration of intragenerational inequality. Stern (Reference Stern2006: 48) and Conceiao and Zhang (Reference Conceiao and Zhang2010) were the first to discuss the impact of inequality on the SDR and in comparing two different future income distributions. In this case, it can easily be concluded that a more unequal future income distribution in the sense of Lorenz (or second-order stochastic) dominance will imply a lower discount rate if and only if U′′′ > 0, using the results of Atkinson (Reference Atkinson1970). This result, however, does not admit the conclusion that increasing inequalities imply a lower discount rate. The reason is that if one considers inequality for the choice of the discount rate, the representative agent approach as such is not valid. Not only does the future income distribution affect the magnitude of the discount rate, but also today's income distribution. The appropriate comparison would be between the discount rate with inequality against the discount rate using only average per capita consumption. That is, we have to define the global SDR assuming only average per-capita consumption. To simplify notation, we will denote by E i the average of its argument weighted by population, so that we can write expected average marginal utility as EiU′ (cit ) in the following. We write ĩ t for the SDR, considering only average world per-capita consumption E i c it , which is defined as
 $$\tilde{r}_{t}=\delta -{1 \over t}\ln {U^{\prime }(E_{i}c_{it}) \over U^{\prime }(E_{i}c_{io})}.$$
Comparing this formula with the discount rate r t as given by (1), we get this relationship:
 $$r_{t}>\tilde{r}_{t}\Longleftrightarrow {E_{i}U^{\prime }(c_{i0}) \over U^{\prime }(E_{i}c_{i0})}>{E_{i}[U^{\prime }(c_{it})] \over U^{\prime }(E_{i}c_{it})}.$$
Inequality affects both today's and tomorrow's marginal utility, as it increases it relative to the no-inequality case. In the following, we denote by
 $\overline{c}_{t}$
average world consumption at date t, and by
 $\varepsilon_{t}=(\varepsilon_{1t},..,\varepsilon_{nt})$
the zero mean spread at date t so that we have
 $c_{it}=\overline{c}_{t}+\varepsilon_{it}$
. Now we can rewrite (4) by adding one to both sides as
 $${E_{i}U^{\prime}(\overline{c}_{t}+\varepsilon_{it})-U^{\prime}(\overline{c}_{t}) \over U^{\prime}(\overline{c}_{t})}>{E_{i}U^{\prime}(\overline{c}_{0}+\varepsilon_{i0})-U^{\prime}(\overline{c}_{0}) \over U^{\prime}(\overline{c}_{0})}.$$
Whether inequality asks for a lower or higher discount rate depends on how much inequality increases average marginal utility relative to marginal utility at date 0 and date t. In general, the conditions for this inequality to hold are threefold. Firstly, the numerators are positive if U′′′ > 0 due to the Jensen inequality. Secondly, the denominators depend on the relative per capita world consumption today and in the future. Thirdly, in order to compare the numerators, we need to know whether the function –U′ (c) (which is increasing and concave) would prefer a risk at lower or higher consumption levels. Given that the attitude towards downside risks depends on the third derivative of the utility function, the relevant characteristics is U′′′′. In general, these three effects can work in either direction so the overall results will be ambiguous.
The overall effect is thus a priori not clear,Footnote
3
and in the following we will therefore consider three particular cases. If there is no growth of per-capita consumption
 $(E_{i}c_{it}=E_{i}c_{i0})$
, it can easily be shown that decreasing inequality over time in the sense of a mean-preserving contraction always implies a higher discount rate. The same holds for the case of the CARA (constant absolute risk aversion) utility function
 $U(c)=-A^{-1}e^{-Ac}$
. In both cases, there is no growth effect and a decrease in inequality over time unambiguously implies that
 $r_{t}>\tilde{r}_{t}$
. A more relevant case is the case of a CRRA (constant relative risk aversion) utility function
 $U(c)=(1-\eta )^{-1}c^{1-\eta }$
, ubiquitous in applied work. Given that our welfare specification is Utilitarian and using the CRRA utility function, this allows us to use an aggregated inequality measure that is compatible with this SWF, namely the class of Atkinson (Reference Atkinson1970)’s inequality indices. The Atkinson index of inequality across individualsFootnote
4
or countries i with an average level of per-capita consumption E
i
c
it
is defined as
 $$I_{t}(\eta )=1-{c_{t}^{ede} \over E_{i}c_{it}} \hbox{with } c_{t}^{ede}=\lpar E_{i}c_{it}^{1-\eta}\rpar ^{({1}/{1-\eta})},$$
where η represents the degree of inequality aversion. Inverting this definition, the ‘equally distributed equivalent’ level of consumption
 $c_{t}^{ede}$
introduced above can be expressed as
 $c_{t}^{ede}=E_{i}\lsqb c_{it}\rsqb (1-I_{t}(\eta ))$
. Using the Atkinson measure of inequality, we can now state our first result:
Proposition 1. With a CRRA utility function and for small degrees of inequality, whenever economic convergence leads to a decrease of inequality in the sense that the Atkinson measure of inequality I(η) decreases over time, the SDR is higher than without considering inequality. For an arbitrary degree of inequality, a decrease in inequality according to the Atkinson measure It(η+1) is a necessary and sufficient condition for a higher discount rate.
Proof: Using a second-order Taylor expansion of both sides of condition (4) for times 0 and t with a CRRA utility function
 $E_{i}[ c_{it}^{-\eta }] /(E_{i}c_{it})^{-\eta }$
around the mean E
i
c
it
yields
 $E_{i}[ c_{it}^{-\eta }] /(E_{i}c_{it})^{-\eta }\simeq 1+({1}/{2})\eta (1+\eta )({Var(c_{it})}/{(E_{i}c_{it})^{2}})$
. Therefore, condition (4) is equivalent to
 $$r_{t}>\tilde{r}_{t}\Longleftrightarrow {Var(c_{i0}) \over (E_{i}c_{i0})^{2}}> {Var(c_{it}) \over (E_{i}c_{it})^{2}}$$
and thus depends only on the change of the (squared) coefficient of variation over time. Similarly we can develop
 $E_{i}[ c_{it}^{1-\eta } ] /(E_{i}c_{it})^{1-\eta }$
for which we get
 $E_{i}[ c_{it}^{1-\eta }] /(E_{i}c_{it})^{1-\eta }\simeq 1+({1}/{2})\eta (\eta -1)({Var(c_{it})}/{(E_{i}c_{it})^{2}})$
. That is, we can write Atkinson's inequality measure I
t
(η) as
 $I_{t}(\eta )\simeq 1-( 1+({1}/{2})\eta (\eta -1)({Var(c_{it})}/{(E_{i}c_{it})^{2}})) ^{({1}/{1-\eta })},$
(that is,) also a monotone function of the coefficient of variation. Thus for small degrees of inequalities, we get that
 $r_{t}> \tilde{r}_{t}$
if and only if I
t
(η) decreases over time.
For the second part, we only need to write I
t
(η+1) explicitly which yields
 $I_{t}(\eta +1)=1-({( E_{i}c_{it}^{-\eta }) ^{-({1 }/{\eta })}}/{E_{i}c_{it}})$
. Hence, we can rewrite
 $I_{0}(\eta +1)>I_{t}(\eta +1)$
as
 $({( E_{i}c_{i0}^{-\eta }) ^{-({1}/{\eta })}}/{E_{i}c_{i0}})>({( E_{i}c_{it}^{-\eta }) ^{-({1}/{\eta })}}/{E_{i}c_{it}})$
which is equivalent to the right hand side of (4), which in the CRRA case reads
 $({E_{i}c_{i0}^{-\eta }}/{(E_{i}c_{i0})^{-\eta }})>({E_{i}c_{it}^{-\eta }}/{(E_{i}c_{it})^{-\eta }})$
. □
It is important to note that there is no unambiguous link between the evolvement of inequality and the discount rate, similar to in Gollier (Reference Gollier2015). The reason lies in the difference in distribution of marginal utility, which is used to compute the discount rate, on the one hand, and of utility itself, which determines the degree of inequality at a given point in time. Even for the restrictive class of the CRRA utility function, the equivalence is only valid for small degrees of inequality.Footnote 5 The exact equivalence for the Atkinson index I t (η+1) is a particular result. Intuitively, it is inequality about the marginal utility and thus prudence or the third derivative of the utility function plays an important role, similar to that in Proposition 3 in Gollier (Reference Gollier2015).
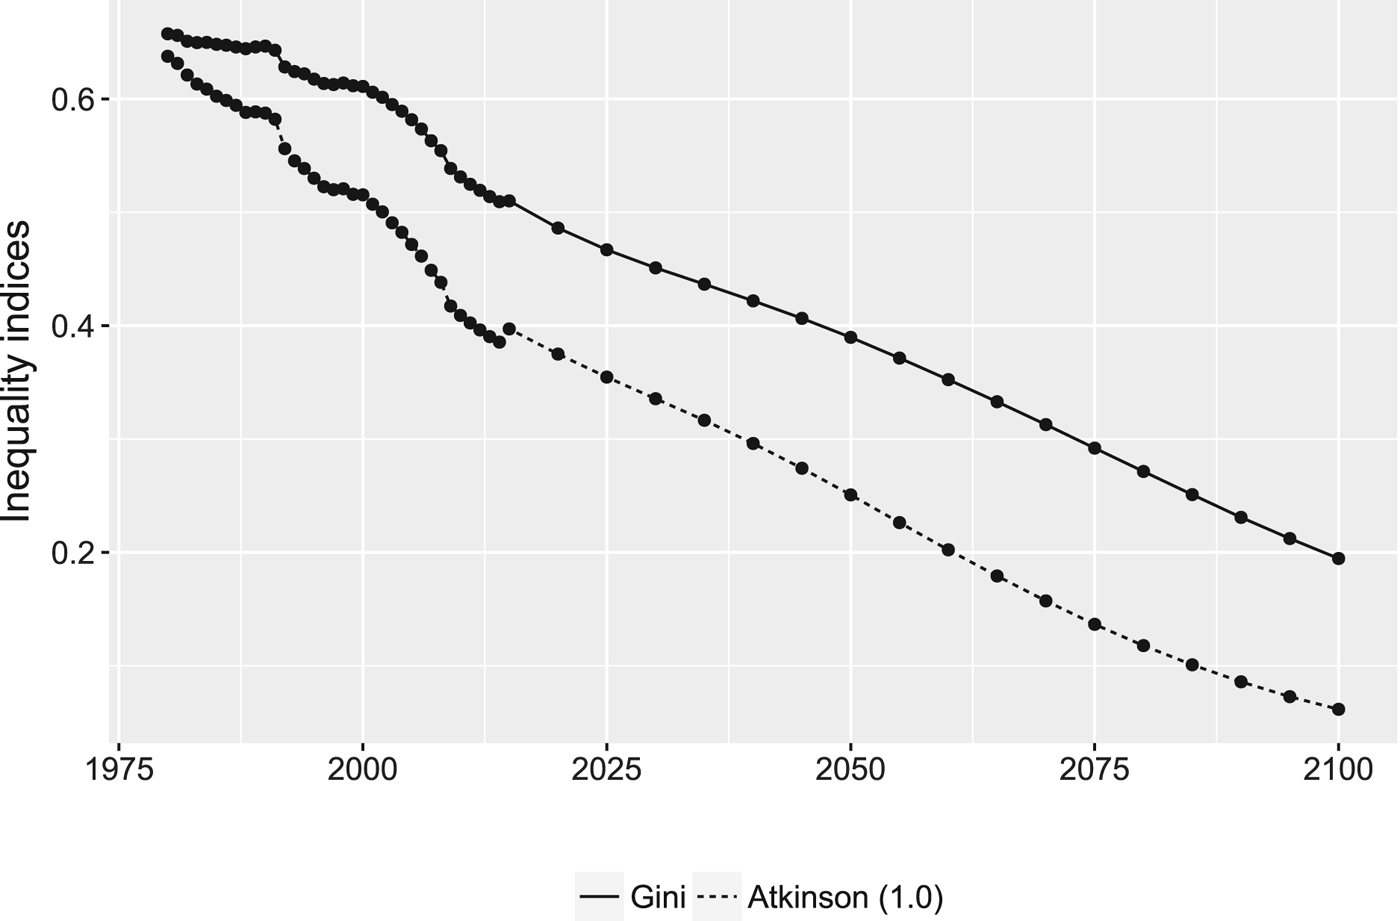
In order to see the quantitative implications of these results, in addition to estimated growth, we also need to use projections about future inequality across countries. We use the recently developed Socioeconomic Scenarios (SSPsFootnote 6 ) (Riahi et al., Reference Riahi, van Vuuren, Kriegler, Edmonds, ONeill, Fujimori, Bauer, Calvin, Dellink, Fricko, Lutz, Popp, Crespo, KC, Leimbach, Jiang, Kram, Rao, Emmerling, Ebi, Hasegawa, Havlik, Humpenpender, Silva, Smith, Stehfest, Bosetti, Eom, Gernaat, Masui, Rogelj, Strefler, Drouet, Krey, Luderer, Harmsen, Takahashi, Baumstark, Doelman, Kainuma, Klimont, Marangoni, Lotze-Campen, Obersteiner, Tabeau and Tavoni2017), which provide projections of GDP and population for 169 countries (Crespo Cuaresma, Reference Crespo2017; Dellink et al., Reference Dellink, Chateau, Lanzi and Magn2017; Samir and Lutz Reference Samir and Lutz2017). Based on these estimates and comparing to the historical data, we compute global inequality indices (the Atkinson measure for η = 1 and for comparison the Gini index), which are depicted in figure 2. The convergence across countries over the past is clearly visible and projected to continue in the SSP2 scenario.
Global inequality (between countries, population weighted) from 1980 to 2100. Sources: IMF WEO 2016 and SSP database.
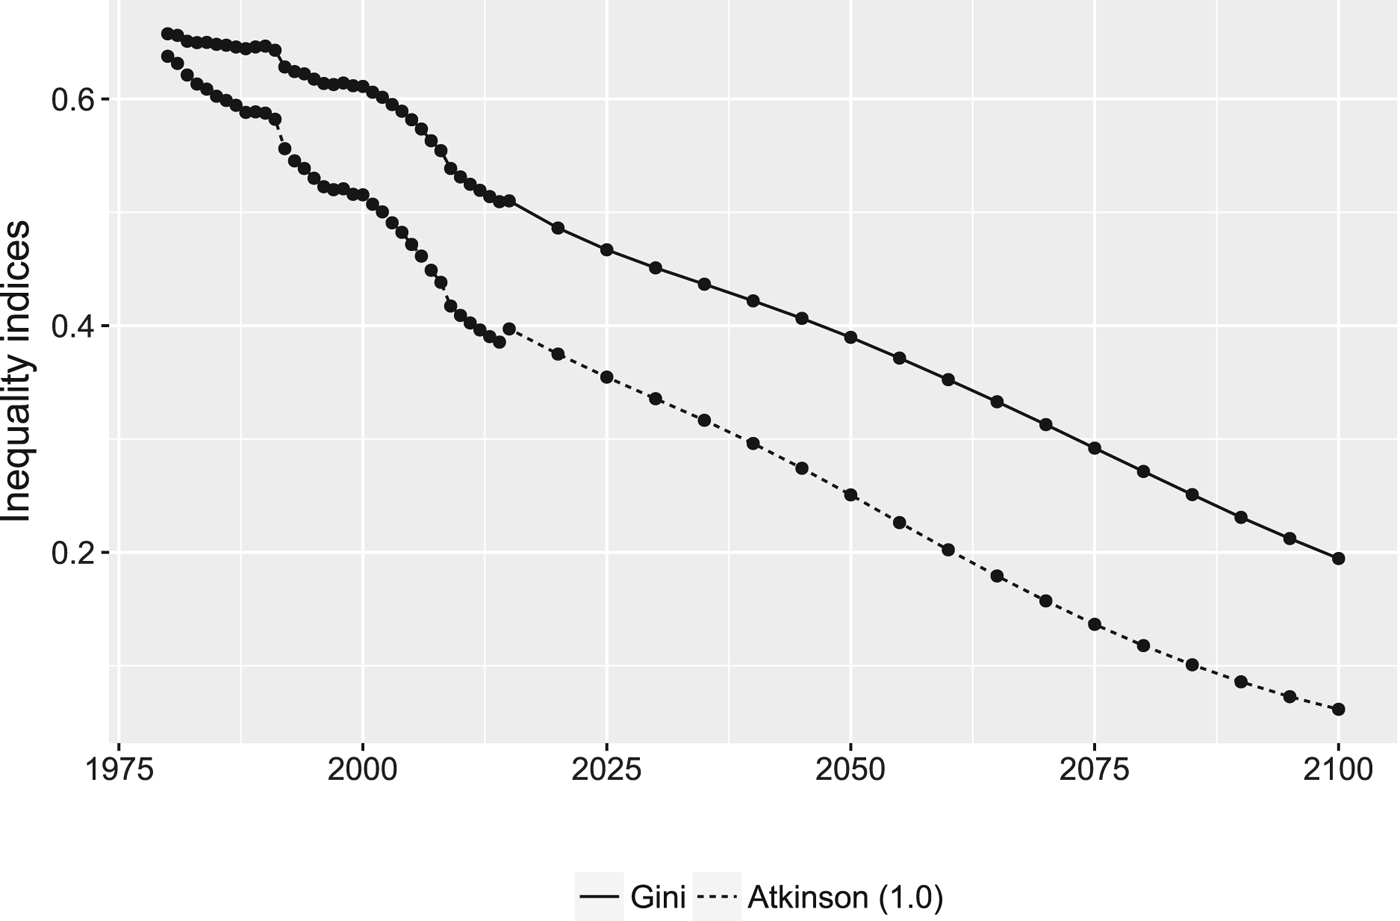
In the SSP2 scenario, global GDP is projected to continue to grow at a rate of around 2.8 per cent but decreases over the 21st century to about 1.9 per cent, which we use for the growth rate estimate in the calibration of the discount rate. As for the parametrization of preferences, we start by using the one used in the Stern review (η = 1 and δ = 0.1 per cent). For this case, we obtain a value of around 3 per cent for the standard global discount rate, which decreases over time to around 2per cent in 2100. Note that this decreasing term structure is entirely due to the projected decrease of GDP growth over time. If we compute the respective inequality adjusted SDR according to (1),Footnote 7 we find r t = 4.0 per cent for short horizons, which decreases to around 3.5 per cent over the century (see figure 3). Moreover, this discount rate is non-monotonic and increases firstly reflecting the dynamics in inequality and growth. Overall, the projected convergence over time (see figure 2) makes future generations better-off which in turn implies that the SDR should be higher than if inequality were not considered. For higher values of η, the pattern remains the same in that the discount rate increases in both cases while the inequality adjusted rate remains at around twice the value of the standard Ramsey rule. Firstly, increasing η leads to a one-to-one increase in the discount rate due to the growth effect. Secondly, it shifts the weight even more towards the poorer countries. As the poorest regions are assumed to grow with higher growth rates in this scenario, the overall effect unambiguously increases the equity-weighted discount rate as η rises.

To sum up, considering intragenerational equity implies an almost twice as large discount rate, and this effect is rather persistent, as r t decreases only slowly. Note that due to the two effects from inequality and economic growth, the SDR can even increase over time depending on the relative magnitudes of both effects. The main reason is the relatively higher weight attributed to poorer countries’ higher expected growth rates.
3. Risk aversion, inequality aversion, and intertemporal substitution
Until now, the function U(c) captured the degrees of inequity aversion over three dimensions: time, space (individuals or countries), and states of nature (if uncertainty of consumption is considered, as in the extended Ramsey rule in Gollier (Reference Gollier2002)). The curvature of this function constrains these three different preference characteristics to coincide, e.g., for the isoelastic case, expressed by the parameter η. This assumption has been criticized as restrictive since the three dimensions are indeed qualitatively different. Moreover, experimental studies found different degrees of inequity aversion for the different dimensions (see Atkinson et al. (Reference Atkinson, Dietz, Helgeson, Hepburn and Slen2009) or Carlsson et al. (Reference Carlsson, Daruvala and Johansson-Stenman2005)). In the context of discounting, risk aversion and resistance to intertemporal substitution have been disentangled, for instance in Gollier (Reference Gollier2002) or Traeger (Reference Traeger2009). With regard to disentangling risk aversion and spatial inequality aversion, Carlsson et al. (Reference Carlsson, Daruvala and Johansson-Stenman2005) and Tol (Reference Tol2010) argue that the two preferences also need not be confounded. A disentanglement of the three different preferences of the social planner, however, in an easily implementable manner, has not yet been considered to our knowledge. In the following we will therefore derive analytical results for disentangling the effects of the three different parameters. Our approach is in the spirit of the recursive utility model of Epstein and Zin (Reference Epstein and Zin1989) and combines it with an aggregated inequality measure. We start as Gollier (Reference Gollier2015) by writing future, uncertain consumption c
ist
as the product of a continuous bivariate distribution F
t
of today's (certain) level of consumption c
i0, and its growth factor between time 0 and t denoted x
ist
, that is,
 $c_{ist}=c_{i0}\cdot x_{ist}$
. We use the subscripts i, s, and t in order to denote the three dimensions – individuals, states of nature, and time – over which consumption is distributed. Writing the growth factor as
 $x_{ist}=e^{g_{ist}t}$
, we refer to g
ist
as the growth rate if initial consumption was given by c
i0 in state s.
In order to derive the SWF for this case across the three dimensions i, s, and t, we have to employ three steps. Firstly, consider a concave von Neumann-Morgenstern utility function v applied for evaluating the uncertain consumption level c
ist
given the initial consumption level c
i0 denoted by
 $v(c_{ist})\mid c_{i0}$
. We can write the conditional certainty equivalent of this random consumption level
 $c_{it}^{CE}$
, which solves
 $v(c_{it}^{CE})=E_{s}[v(c_{ist})\mid c_{i0}]$
and captures uncertainty of future consumption.Footnote
8
Secondly, spatial inequality aversion of the social planner will be captured through a Utilitarian welfare function g, which will be computed across countries or individuals of these certainty equivalent levels of consumption. In particular, and similar to the certainty equivalent above, we again use the concept of the ‘equally distributed equivalent’ level of consumption
 $c_{t}^{EDE}$
, as proposed by Atkinson (Reference Atkinson1970), which is defined as the level of consumption
 $c_{t}^{EDE}$
, which, if it were equally distributed, would yield the same welfare level as the actual distribution. The value of the
 $c_{t}^{EDE}$
at any date t can therefore be implicitly written as
 $g(c_{t}^{EDE}) =E_{i}[ g(c_{it}^{CE})]$
.Footnote
9
Thirdly, we maintain time-separability and exponential utility discounting using the function u to characterize intertemporal preferences. We can then write global discounted expected social welfare of consumption at two points in time, 0 and t, as
 $$W=u(c_{0}^{EDE})+e^{-\delta t}u(c_{t}^{EDE}).$$
The welfare measure W is thus a threefold nested function of the exponentially discounted sum of the equally distributed equivalent level of the certainty equivalent of consumption. Note that conceptually, one could consider different orders of aggregations of utilities from the one proposed here. Indeed, for instance, the preferences of Kihlstrom and Mirman (Reference Kihlstrom and Mirman1974) are an example of alternative ordering of risk and time preferences compared to those of Epstein and Zin (Reference Epstein and Zin1989) (see Bommier (Reference Bommier2007) for a discussion on this topic). For this work, and putting the focus on inequality, it seems reasonable to consider the distribution of certainty equivalents across countries, while keeping the additive separability in time. This implies having the ordering in terms of aggregation of time, individuals, and finally states of nature.Footnote 10
In the following, we will use isoelastic specifications as in Epstein and Zin (Reference Epstein and Zin1989) for the three functions v, g, and u in order to get analytical results. We denote the elasticity of marginal utility in the three dimensions by φ (v, states of nature), γ (g, space), and η (u, time). The welfare function in equation (7) can then be written as
 $$W=\left[ \left( E_{i}\left[ c_{i0}^{1-\gamma }\right] \right)^{{1-\eta \over 1-\gamma }}+e^{-\delta t}\left( E_{i}\left[ \left( E_{s}\left[ c_{ist}^{1-\varphi }\mid c_{i0}\right] \right)^{{1-\gamma \over 1-\varphi } }\right] \right)^{{1-\eta \over 1-\gamma }}\right] ^{{1 \over 1-\eta }},$$
where η denotes the inverse of the intertemporal elasticity of substitution, the parameter γ captures the degree of inequality aversion across countries, and φ measures the degree of relative risk aversion.
We can use this welfare function to derive the SDR by comparing one marginal unit of consumption today with a marginal unit in the future. As before, we assume that the marginal changes in consumption are accruing on an equal per capita basis today and in the future. Moreover, the marginal return of the project is as before certain and hence independent of the states of the world considered for the consumption path. As in the previous section, we can derive the optimal consumption discount rate r t as the rate of return that solves the following condition with equality:
 $$E_{i}{\partial W \over \partial c_{i0}}\leq e^{-r_{t}t}E_{i}E_{s}{\partial W \over \partial c_{ist}}.$$
Considering the expression for welfare as given by (8), it becomes clear that for any admissible distribution F
t
, the results are not tractable. In order to be able to compute the discount rate analytically, we therefore consider the particular case where consumption per capita is log-normally distributed today and at any date t. The log-normal distribution has proven to be a very good approximation of income distributions (Atkinson and Brandolini, Reference Atkinson and Brandolini2010). Moreover, we assume that the distribution of the growth factor x
ist
for any given initial income c
i0 is log-normally distributed as would be the case for instance if consumption followed a geometric Brownian motion. Finally, we need to specify the correlation between the two random variables, and we take the case of a bivariate log-normal distribution between today's income distribution c
i0 and the growth factor x
ist
with correlation parameter ρ. Using these assumptions, we can write the distribution F
t
as
 $\lpar c_{i0},x_{ist}\rpar \sim LN( \mu _{0},\mu _{g}t,\sigma _{0}^{2},\sigma _{g}^{2}t,\rho ) $
, where
 $\sigma _{g}^{2} $
denotes the volatility of growth and
 $\sigma _{0}^{2}$
today's variance of the logarithm of consumption.Footnote
11
This parametrization allows us to derive an intuitive and explicit disentangled SDR:
Proposition 2 If consumption at any two points in time can be written as a bivariate log-normal distribution, the SDR\ based on the disentangled welfare function (8) can be written as
 $$\eqalign{ r_{t} = & \delta +\eta \overline{g}_{t}-{1 \over 2}\varphi (\eta +1){E_{i} \lsqb Var(lnc_{ist}\mid c_{i0})\rsqb \over t} \cr & -{1 \over 2}\gamma (\eta +1) {Var(E_{t}\lsqb lnc_{ist}\mid c_{i0}\rsqb )-Var(lnc_{i0}) \over t}}.$$
Proof: To start, we need some properties of the bivariate log-normal parametrization, which allows us to write important one-dimensional distributions in a reasonable way. Firstly, the current income distribution is given as
 $c_{i0}\sim LN( \mu _{0},\sigma _{0}^{2}) $
. Secondly, the growth rates
 $g_{ist}=({1}/{t})lnx_{ist}\mid c_{i0}$
for any initial value c
i0 are normally distributed and have the same volatility
 $\sigma _{g}^{2}(1-\rho ^{2})$
. Thirdly, the expected volatility of the growth rate is independent of the initial income level and moreover constant over all time horizons since one can compute
 $E_{i}\lsqb Var(lnc_{ist}\mid c_{i0})\rsqb =\sigma _{g}^{2}(1-\rho ^{2})t$
, which is linear in t and captures the uncertainty in consumption. Fourth, the effect of inequality is captured by the change in the variance of expected consumption in the future from today:
 $Var(E_{s}\lsqb lnc_{ist}\mid c_{i0}\rsqb )-Var(lnc_{i0})$
. Note that using the law of total variance, this separation of the variance of future consumption into inequality and uncertainty can be written as
 $ Var(lnc_{ist})=Var(E_{s}\lsqb lnc_{ist}\mid c_{i0}\rsqb )+E_{i}\lsqb Var(lnc_{ist}\mid c_{i0})\rsqb $
. Using this distributional assumption together with the isoelastic specification of the three utility functions, we can analytically compute the SDR based on (9). Moreover, based on this distributional assumption, the growth rate of average per-capita consumption between 0 and t, that is,
 $\overline{g}_{t}=( { E_{s}E_{i}[ c_{i0}x_{ist}] }/{E_{i}[ c_{i0}] }) ^{1/t}-1$
.
Now we can apply the definition of the SDR (9) based on the SWF (8). While the computation of the differentiation of the three-fold nested welfare function and two-fold expectation results in complex intermediary results, ultimately one obtains an intuitive formula for the SDR, which can be written as in the proposition (the derivation based on the full set of parameters of the bivariate log-normal distribution is given in Appendix A).
This uncertainty and inequality extended Ramsey rule consists of four terms, where the first two replicate the standard Ramsey rule, namely the pure rate of time preference δ and the growth effect
 $\eta \overline{g}_{t}$
. Uncertainty of the consumption process is considered through the negative term
 $({1}/{2})\varphi (\eta +1)({E_{i}[ Var(lnc_{ist}\mid c_{i0}) ] }/{t})$
, which replicates the result of Gollier (Reference Gollier2002) and depends on the expected variance of the growth rate. In the log-normal case, the expected variance scales linear in time
 $(E_{i}\lsqb Var(lnc_{ist}\mid c_{i0})\rsqb =\sigma _{g}^{2}(1-\rho ^{2})t)$
, so that this term is constant over the time horizon. Moreover, this term depends on the degree of relative prudence (which for our specification is given by the expression
 $({\varphi }/{\eta })(\eta +1)$
, see Kimball and Weil (Reference Kimball and Weil2009)) times the inverse of the intertemporal elasticity of substitution η.
The impact of inequality is captured by the fourth term of equation (10). The measure of inequality reflects the change in the variance of expected consumption over time, while the coefficient
 $ \gamma (\eta +1)$
equivalently to the one of the uncertainty effect captures the product of relative prudence (in the inequality dimension) and the elasticity of intertemporal substitution. This formulation shows the close relationship to the generalized Ramsey rule (see Gollier (Reference Gollier2011)): the uncertainty term depends on the average volatility of the growth rate while the new inequality term depends on the change in the variance over time.
We can derive another formulation based on more easily available measures of uncertainty and inequality, namely the average volatility of growth σ
g
and inequality as measured by the Atkinson index I
t
presented in the previous section. For the log-normal distribution and based on the certainty equivalent level of consumption
 $c_{it}^{CE}$
at time t, and based on the utility function we use for aggregating over individuals
 $ v(c_{it}^{CE})=(1-\gamma )^{-1}(c_{it}^{CE})^{1-\gamma }$
, the Atkinson index is given by
 $I_{t}(\gamma )=1-e^{-\gamma ({Var[ log( c_{it}^{CE}) ] }/{2})}$
(see Cowell Reference Cowell2011). Therefore, we can rewrite (10) as
 $$r_{t}=\delta +\eta \overline{g}_{t}-\varphi (\eta +1){\sigma _{g}^{2}(1-\rho ^{2}) \over 2}+(\eta +1)log\left( {1-I_{t}(\gamma ) \over 1-I_{0}(\gamma )}\right) ^{1/t}.$$
This formula can be easily calibrated using data on economic growth, growth volatility, and an aggregated inequality index. Besides the uncertainty effect, the discount rate now increases if inequality decreases over time as in the previous section, in which case the argument of the logarithm is larger than one. This result replicates a similar finding in Gollier (Reference Gollier2015) based on a more narrow yet implementable definition of the concept of convergence. While this effect depends on the degree of inequality aversion γ, it also depends on the degree of prudence of the decision maker as in Kimball (Reference Kimball1990), here reflected by the degree of relative prudence η+1. Different from uncertainty, however, it is not the absolute level, but the relative degree of inequality of future consumption compared to today that determines the effect on the discount rate.Footnote 12
4. Calibration and results
In order to quantify the effect of inequality on the discount rate, we need to calibrate the formula and find meaningful values for the triplet of parameters
 $(\varphi ,\gamma, \eta)$
. Barsky et al. (Reference Barsky, Juster, Kimball and Shapiro1997), Carlsson et al. (Reference Carlsson, Daruvala and Johansson-Stenman2005) and Atkinson et al. (Reference Atkinson, Dietz, Helgeson, Hepburn and Slen2009) estimated individual values of φ, γ, and η elicited from experiments. The study by Atkinson et al. (Reference Atkinson, Dietz, Helgeson, Hepburn and Slen2009) is probably the most relevant to our problem, since they focused on the long-term issue of climate change including their sample. The authors find a large variation across individuals, with median values of η ≃ 9, γ ≃ 2 – 3 and φ ≃ 3 – 5. Yet, for a normative analysis such as the SDR, these values need to be considered with care. Regarding intertemporal preferences, in the literature on discounting and climate change, η has virtually never been considered to be smaller than 0.7 or larger than 2 (Just to name a few suggested values: Weitzman: 2, Dasgupta: 2-3, Nordhaus: 2, Stern: 1, Cline: 1.5). We further consider an intermediate value of η = 1.5 as our baseline specification. For the degree of relative risk aversion φ, the values considered are typically significantly higher, up to a value of 5 (Epstein and Zin Reference Epstein and Zin1991) or even 9.5 (Crost and Traeger Reference Crost and Traeger2014). We further take a value of φ = 5 for our baseline calibration.
For the degree of inequality aversion, it appears to be consistently estimated to be lower than the degree of risk aversion. For instance, Evans (Reference Evans2005) finds γ ≃ 1.4 based on income tax profiles in OECD countries, while Clarkson and Deyes (Reference Clarkson and Deyes2002) suggest a value of γ between 0.5 and 1.5. For the United States, the U.S. Census Bureau (2010) publishes Atkinson inequality indices using γ = {0.25, 0.5, 0.75} and suggests 1 as maximum value. Atkinson and Brandolini (Reference Atkinson and Brandolini2010) consider values between 0.2 and 2.5 as defensible and Tol (Reference Tol2010) estimates γ to be around 0.7 based on actual official development assistance across countries. Moreover, as pointed out by Tol (Reference Tol2005), richer countries do not reveal as much concern for the poor as is implied by using higher values of γ. More recent empirical studies suggest that, based on preferences elicitation and income tax schedules, the value could be even higher than 1, such as Drupp et al. (Reference Drupp, Freeman, Groom and Nesje2015) who find a mean response in their survey of 1.35, while De Carvalho (Reference De Carvalho2015) suggest values between 1.1 and 2.0 based on a literature survey. For our baseline specification, we will therefore start by using a value of unity (γ = 1) and will explore the range of this important parameter in the application below.
Now we can proceed to calibrate the disentangled SDR based on the triplet (φ = 5.0, γ = 1.0, η = 1.5) and based on average growth estimates, estimated growth uncertainty, and inequality projections. As an example, we consider the case of the United States referring to the widely used estimates of Kocherlakota (Reference Kocherlakota1996), who estimated g t = 1.8 per cent and an annualized volatility of the growth rate of 3.6 per cent. To estimate inequality over time, we consider data on the Gini coefficient over the period of 1967–2009 from U.S. Census Bureau (2010), which shows that the Gini coefficient increased from 0.39 in 1970 to 0.45 in 2009. Using their time series data, we estimate the variance of the logarithm of consumption Var(lnc it ) within the United States as a linear trend based on a linear regression for which we find a slope parameter of +0.0049 (R 2 = 0.95). Based on equation (10), the linearity of the variance over time implies that the term structure of the SDR will be flat. Note that based on this simple projection, the value of the Gini coefficient of 0.45 in 2009 would further increase to a value of 0.55 in 2100. Using these values, we can compute the optimal consumption discount rate based on equation (10) as
 $$r_{t}=\delta +\eta \cdot 1.8\%-{1 \over 2}\varphi (\eta +1)\cdot 3.6\%^{2}-{1 \over 2}\gamma (\eta +1)\cdot 0.49\%.$$
The growth and uncertainty effects are the standard ones of the extended Ramsey rule. In particular, the uncertainty effect (3.6 per cent2 = 0.1296 per cent) is relatively small given the assumption about the independence of growth rates over time. The inequality effect on the other hand (0.49 per cent) is significantly larger. It is negative and reduces the discount rate since inequality is projected to increase in the future. Moreover, as we saw before, the term structure is flat due to the linear increase in the variance of log consumption together with constant growth and volatility. Finally, the discount rate depends crucially on the choice of the three parameters for the different dimensions of inequity aversion. For our benchmark calibration (and maintaining δ = 0.1 per cent), we finally obtain a standard social discount rate without uncertainty and inequality of 0.1 per cent + 1.5·1.8 per cent = 2.8 per cent. Uncertainty reduces this value by –0.5·5·(1.5+1)·0.1296 per cent = –0.81 per cent to ĩt = 1.99 per cent, as shown also in Gollier (Reference Gollier2008). Now taking into account inequality, this rate is reduced further by –0.5·1·(1.5+1)·0.49 per cent = –0.61 per cent, which ultimately yields a value of rt = 1.38 per cent for the inequality adjusted discount rate for the United States.
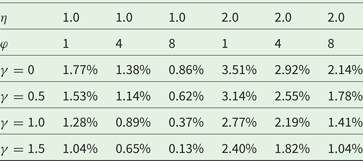
In order to study the sensitivity of the discount rate with respect to the three preference parameters, we compute the discount rate for a set of values in the ranges discussed above, which are presented in table 1. While a higher value of η increases the discount rate mainly due to the wealth effect, higher risk aversion (φ) reduces the discount rate due to the precautionary effect, and higher inequality aversion γ similarly reduces the discount rate by 0.5–1.0 percentage points, and the effect is larger for higher η.
Sensitivity analysis in {η, φ, γ} for the disentangled discount rate for the U.S. (δ = 0.1%)

So far we considered a public policy affecting in the national context to derive the discount rate for this country. However, we can also consider the global context with policies such as climate change affecting all countries. For instance, if we take the example of global climate policy assessment, using probably the most widely used climate economy model, namely Nordhaus’ DICE model, we can compute the social discount rate taken into account the inequality projection presented before in figure 2. This model projects the macro-economy until the time horizon 2,300 and thus provides a long-term benchmark, which we need to compute the social discount rate.
To make the results comparable with the standard DICE model results, we use the standard parametrization of Nordhaus (Reference Nordhaus2014) consisting pure rate of time preference of δ = 1.5 per cent and elasticity of marginal utility of η = 1.5. For the crucial parameter of inequality aversion, we consider the range from zero to two consistent with the literature reviewed above. The resulting discount rate is depicted for various values of γ in figure 4. Some observations can be made based on the resulting discount rate patterns. Firstly, the term structure is not necessarily decreasing, since the non-constant growth and inequality evolvement over time can counteract each other. Secondly, starting from γ = 0, i.e., without considering inequality, the discount rate increases in γ, as it is predicted by equation (10). Thirdly, compared to the results of the previous section and of figure 3, the disentanglement of η and γ has an important effect on the discount rate: While we saw before that for γ = η the discount rate almost doubles, for more moderate values of γ disentangled from η, considering inequality of the global discount rate used in a global model such as DICE, would add around 1 to 2 percentage points to the discount rate. While we don't assess the climate impact part here, this would ceteris paribus imply less weight on the future and thus a less stringent climate policy.
Global inequality adjusted discount rate based on the projection from SSP2 (based on equation (11), η = 1.5, δ = 1.5%.)

5. Conclusion
This paper discusses the role of the SDR when taking into account intragenerational equity or inequality. First, we derived the appropriate weighting scheme for the discount rate and found that each country's contribution to the expectations about the future needs to be weighted by today's marginal utility. Moreover, the evolution of inequality over time is pivotal for effect on the discount rate. An expected decrease of income inequality over time implies a higher SDR than the standard Ramsey rule under some fairly general conditions. Moreover, it can be computed using readily available inequality measures.
We extend this model, disentangling inequality aversion from risk aversion and intertemporal inequity aversion, and separate the three effects from growth, uncertainty, and inequality. Finally, we apply the results as an exemplifying case to the SDR for the United States and to the latest set of socioeconomic scenarios developed, including for the IPCC assessment reports (SSPs) and compute the resulting global SDR. In this case, we find an SDR of around 6 per cent that decreases to 4 per cent over the century for the standard parametrization used in the global DICE model (δ = 1.5 per cent, η = 1.5). Taking into account inequality, this rate increases by about one percentage point.
Acknowledgements
I would like to thank my Ph.D. supervisor Christian Gollier at the Toulouse School of Economics for very useful suggestions and general encouragement. I also would like to thank Geir Asheim, Ben Groom, Richard Tol, two anonymous referees, and participants of the ASSET Meeting 2010, Alicante, the ESOP Workshop ‘Climate Change and Distribution’, Oslo, and the Exeter Sustainability Forum 2011 for very helpful comments. The usual caveat applies.
Appendix A: Proof of Proposition 2
While in the main text the main result in Proposition 2 was derived using aggregate measures of uncertainty and inequality, in this section we show how this result actually comes about by actually analytically deriving the discount rate based on the bivariate distribution assumption and three-fold disentangled welfare function, which is rather cumbersome. Considering the complex expression for welfare as given by (8), we combine it with the case of a bivariate log-normal distribution between today's income distribution c
i0 and the growth factor x
ist
. Using this assumption and some meaningful choices of the parameters and time-dependence of this distribution, we choose F
t
to be written as follows:
 $\lpar c_{i0},x_{ist}\rpar \sim LN( \mu _{0},\mu _{g}t,\sigma _{0}^{2},\sigma _{g}^{2}t,\rho ) $
. This parametrization results in mean and covariance matrix of the distribution as
 $$\left(\matrix{ c_{i0} \cr x_{ist} } \right)\sim LN\left(\left(\matrix{ \mu_{0} \cr \mu_{g}t } \right),\left(\matrix{ \sigma_{0}^{2} & \rho\sigma_{0}\sigma_{g}\sqrt{t} \cr \rho\sigma_{0}\sigma_{g}\sqrt{t} & \sigma_{g}^{2}t } \right)\right).$$
Based on this bivariate distribution, we can derive several useful distributions in the three dimensions. The current income distribution is given as
 $c_{i0}\sim LN( \mu _{0},\sigma _{0}^{2}) $
. At any given point in time time t, we have
 $c_{ist}=c_{i0}x_{ist}\sim LN( \mu _{0}+\mu _{g}t,\sigma _{0}^{2}+\sigma _{g}^{2}t+2\rho \sigma _{0}\sigma _{g}\sqrt{t}) $
. Most importantly, we can derive the conditional distribution of the growth factor for an initial level of consumption c
i0, which is given by
 $$x_{ist}\mid c_{i0}\sim LN\left( \mu_{g}t+{\rho \sigma_{g}\sqrt{t} \over \sigma_{0}}(lnc_{i0}-\mu_{0}),\sigma_{g}^{2}(1-\rho^{2})t\right),$$
implying that the growth rates
 $g_{it}=({1}/{t})lnx_{ist}\mid c_{i0}$
for any value c
i0 are normally distributed and have the same volatility. Moreover, we denote by
 $\overline{g}_{t}$
the annualized growth rate of unconditional average consumption between 0 and t, that is,
 $ \overline{g}_{t}=( {E_{s}E_{i}[ c_{i0}x_{ist}] }/{E_{i} [ c_{i0}] }) ^{1/t}$
-1.
Using this distributional assumption together with the isoelastic specifications of the three utility functions, we can analytically compute the SDR based on (9) holding with equality. Basically, we compute the general definition (9) based on the SWF (8), the distribution for consumption and its growth factor in (A1), and noting that
 $c_{ist}=c_{i0}x_{ist}$
. Given the presented conditional and marginal distributions are all log-normal, we can use the fact that for any log-normal random variable
 $ x\sim LN(\mu (x),\sigma (x)^{2})$
, all k
th
moments of these distributions exist and are moreover given by the formula
 $E[x^{k}]=e^{k\mu (x)+({1}/{2})k^{2}\sigma (x)^{2}}$
. The derivation of the discount rate finally results in this formula depending on the five parameters of the distribution and the preference parameters
 $\{\varphi,\gamma,\eta \}$
and δ:
 $$r_{t}=\delta +\eta \overline{g}_{t}-{1 \over 2}\varphi (\eta +1)\sigma _{g}^{2}(1-\rho ^{2})-{1 \over 2}\gamma (\eta +1){1 \over t}\left( 2\rho \sigma_{0}\sigma_{g}\sqrt{t}+\rho^{2}\sigma_{g}^{2}t\right).$$
As the result in Proposition 2, this uncertainty and inequality extended Ramsey rule adds two terms to the standard Ramsey rule, namely the pure rate of time preference δ and the growth effect
 $\eta \overline{g}_{t}$
. Uncertainty enters the picture through the negative term
 $({1}/{2})\varphi (\eta +1)\sigma _{g}^{2}(1-\rho ^{2})$
, which replicates the result of Gollier (Reference Gollier2002) and depends on the variance of the average growth rate, the degree of relative prudence (which for our specification is given by the expression
 $({\varphi }/{\eta })(\eta +1)$
, see Kimball and Weil (Reference Kimball and Weil2009)), and the inverse of the intertemporal elasticity of substitution η. Note that due to our distributional parametrization and log-normality, volatility of the growth rate is independent of the initial income level and moreover constant over all time horizons, since we have
 $E_{i}\lsqb Var(lnc_{ist}\mid c_{i0})\rsqb =\sigma _{g}^{2}(1-\rho ^{2})t$
for the expected variance, which is linear in t.
The impact of inequality is captured by the fourth term of equation (A3). The measure of inequality reflects the change in variance of expected consumption over time. By decomposing the variance of consumption into inequality and uncertainty, using the law of total variance, we find
 $Var(E_{s}\lsqb lnc_{ist}\mid c_{i0}\rsqb )=(\sigma _{0}+\rho \sigma _{g}\sqrt{t})^{2}$
for the variance of the expected value of log consumption in the future. Comparing this term with today's variance of consumption, we obtain
 $Var(E_{s}\lsqb lnc_{ist}\mid c_{i0}\rsqb )-Var(lnc_{i0})=2\rho \sigma _{0}\sigma _{g} \sqrt{t}+\rho ^{2}\sigma _{g}^{2}t$
.
This term is precisely the measure of inequality in the last term of equation (A3) and we can thus write the discount rate as in the proposition:
 $$\eqalign{ r_{t} = &\delta+\eta\overline{g}_{t}-{1 \over 2}\varphi(\eta+1){E_{i}\lsqb Var(lnc_{ist}\mid c_{i0})\rsqb \over t} \cr & -{1 \over 2}\gamma(\eta+1){Var(E_{s} \lsqb lnc_{ist}\mid c_{i0}\rsqb )-Var(lnc_{i0}) \over t}}.$$