Introduction
The French-Italian station at Dome Concordia (hereafter referred to as Dome C, 75°06′S, 123°21′E, 3233 m above mean sea level (a.m.s.l.)), on the eastern Antarctic Plateau, and the USA Amundsen-Scott Station (89°59′S, 139°16′E, 2841 m a.m.s.l.) at the South Pole, are the two high altitude Antarctic stations of the Baseline Surface Radiation Network (BSRN). The two other BSRN stations are Syowa (69°00′S, 39°35′E, 29 m a.m.s.l.) (Japan) and Neumayer (70°38′S, 8°15′W, 40 m a.m.s.l.) (Germany), both located in coastal regions. The four stations provide important data useful for: i) the calibration of the Global Energy and Water cycle Experiment (GEWEX)/Surface Radiation Budget (SRB) Project measurements, and ii) the validation of satellite-based measurements of outgoing radiation flux. In particular, major research activities are hosted at these sites for: a) monitoring the background short-wave and long-wave radiation terms of the energy budget at ground level and their variations depending on cloud coverage parameters, and b) providing high quality observational data to validate the theoretical computations of radiative fluxes given by local radiation budget models. Due to the exceptionally high atmospheric transparency conditions of the inland Antarctic Plateau, field measurements performed at Dome C can be profitably used for radiometric validation activities applied to infrared satellite sensors, such as the Atmospheric Infrared Sounder (AIRS) (Walden et al. Reference Walden, Roth, Stone and Halter2006), as well as for studying the relationship between the long-wave down-welling radiation flux and the thermodynamic condition of the atmosphere at the ground (Walden et al. Reference Walden, Town, Halter and Storey2005). For such purposes, the radiosounding measurements regularly performed at Dome C furnish long time series of pressure, temperature and moisture parameters useful in the analysis of the radiation measurements performed with ground-based short-wave and long-wave radiometers (Walden et al. Reference Walden, Warren and Murcray1998, Kenyon & Storey Reference Kenyon and Storey2006), and satellite based measurements of outgoing short- and long-wave radiance fluxes (Gettelman et al. Reference Gettelman, Walden, Miloshevich, Roth and Halter2006, Town et al. Reference Town, Walden and Warren2007).
In addition, radiosonde data are valuable resources for: i) evaluating the cloud effects on the energy balance of the surface-atmosphere system of the Antarctic Plateau (Town et al. Reference Town, Walden and Warren2005), and ii) checking the radiometric measurements of the atmospheric content of water vapour (hereinafter referred to as precipitable water W), which are currently made at Dome C by Ricaud et al. (Reference Ricaud, Gabard, Derrien, Chaboureau, Rose, Mombauer and Czekala2010) using the HAMSTRAD-Tropo radiometer working at the 183 GHz frequency.
It is well known that pressure (p), temperature (T) and relative humidity (RH) measurements performed with radiosondes are all affected by various instrumental errors and dry biases arising from the extreme atmospheric environmental conditions encountered by the Barocap, Thermocap and Humicap radiosonde sensors during their ascent (Hudson et al. Reference Hudson, Town, Walden and Warren2004, Tomasi et al. Reference Tomasi, Cacciari, Vitale, Lupi, Lanconelli, Pellegrini and Grigioni2004). The particularly harsh environmental conditions at the Antarctic Plateau sites (Hirasawa et al. Reference Hirasawa, Nakamura and Yamanouchi2000) produce very marked instrumental errors and dry biases in the radiosonde measurements of T and RH. It was therefore decided to analyse the radiosounding data recorded at Dome C, from late March 2005 to the end of March 2009 by the meteorological group of the Antarctic Project (National Agency for new technologies, Energy and sustainable Economic development (ENEA), Centro Ricerche (CR), Casaccia, Rome, Italy), employing an appropriate correction procedure based on the results achieved in two previous studies:
1) A preliminary analysis of Dome C radiosonde data by Tomasi et al. (Reference Tomasi, Petkov, Benedetti, Vitale, Pellegrini, Dargaud, De Silvestri, Grigioni, Fossat, Roth and Valenziano2006) through the combined use of the algorithms proposed by Wang et al. (Reference Wang, Cole, Carlson, Miller, Beierle, Paukkunen and Laine2002) and Miloshevich et al. (Reference Miloshevich, Vömel, Paukkunen, Heymsfield and Oltmans2001, Reference Miloshevich, Paukkunen, Vömel and Oltmans2004) for correcting various dry biases and instrumental errors. The procedure was applied to examine the radiosounding dataset recorded by Aristidi et al. (Reference Aristidi, Agabi, Azouit, Fossat, Vernin, Travouillon, Lawrence, Meyer, Storey, Halter, Roth and Walden2005) in December 2003 and January 2003 and 2004 (using RS80-A, RS80-H, and RS90 Vaisala radiosondes), and the radiosounding dataset collected from late March to the end of May 2005 by the ENEA meteorological group of the Antarctic Project, employing mostly RS92 radiosondes.
2) The analysis of a four-year set of radiosonde data recorded at Dome C by the ENEA team, from 25 March 2005 to the end of March 2009, which was undertaken by Tomasi et al. (Reference Tomasi, Petkov, Benedetti, Valenziano and Vitale2011a), employing an improved correction procedure based not only on the Wang et al. (Reference Wang, Cole, Carlson, Miller, Beierle, Paukkunen and Laine2002) and Miloshevich et al. (Reference Miloshevich, Vömel, Paukkunen, Heymsfield and Oltmans2001, Reference Miloshevich, Paukkunen, Vömel and Oltmans2004) algorithms, but also on two recent algorithms: i) that of Cady-Pereira et al. (Reference Cady-Pereira, Shephard, Turner, Mlawer, Clough and Wagner2008), properly adapted to the Antarctic Plateau conditions using the Rowe et al. (Reference Rowe, Miloshevich, Turner and Walden2008) field evaluations of solar heating effects at Dome C, for removing the solar heating dry biases of the RS80-A Humicap sensor, and ii) that proposed by Miloshevich et al. (Reference Miloshevich, Vömel, Whiteman and Leblanc2009) as a function of pressure and RH separately for daytime and night-time conditions, for correcting the RS92 Humicap solar heating effects and the instrumental Humicap errors. The overall correction procedure was used by Tomasi et al. (Reference Tomasi, Petkov, Benedetti, Valenziano and Vitale2011a) to analyse the dataset derived from 1113 radiosoundings taken with RS80-A and RS92 Vaisala radiosondes, and to determine the daily vertical profiles of p, T, RH and absolute humidity (q) by minimizing the most common and significant instrumental errors and dry biases of the radiosonde sensors. The monthly mean vertical profiles of the above four parameters were then calculated by averaging each monthly dataset recorded over the four years. In particular, the time patterns of monthly mean values of W were found to vary on average from < 0.3 mm in June–October to > 0.6 mm in December–January. The main purpose of these calculations was to provide: i) an accurate description of the average seasonal variations in the vertical profiles of the above four thermodynamic parameters of the atmosphere for use in the analysis of the BSRN ground-based measurements of short- and long-wave radiation budget terms routinely performed at Dome C, defining also the role of water vapour in the radiation exchange processes, and ii) the four-year average variations in the monthly mean values of precipitable water and its main percentiles, thus allowing astronomers to calculate with good precision the atmospheric transmittance features in the sub-millimetre and millimetre range, for the exceptionally dry air conditions observed at this remote site on the Antarctic Plateau.
It was decided to carry out a re-analysis of the four-year set of radiosounding measurements presented by Tomasi et al. (Reference Tomasi, Petkov, Benedetti, Valenziano and Vitale2011a) adopting a further improved correction procedure to examine the four-year dataset. The principal aims were to: i) define the annual cycles of the variations in the vertical profiles of pressure, temperature and moisture parameters at Dome C during the four radiosounding measurement years, and ii) characterize the year-to-year seasonal variations, highlighting the changes in the main thermodynamic conditions of the low troposphere and the upper troposphere and low stratosphere (UTLS) at Dome C, from late March 2005 to the end of March 2009. A further purpose of the present article was to define the monthly mean vertical profiles of pressure, temperature and moisture parameters for: a) radiative transfer calculations of both up-welling and down-welling short- and long-wave radiation fluxes at this high altitude BSRN site in Antarctica, which could be suitable for analysing the dependence of the above radiation budget terms on pressure, temperature and water vapour, and b) realistic calculations of the vertical profiles of Rayleigh-scattering coefficient at wavelengths ranging from 0.25–4.00 μm, useful for analysing the multispectral sun-photometer measurements routinely performed at Dome C during the summer (Tomasi et al. Reference Tomasi, Petkov, Stone, Benedetti, Vitale, Lupi, Mazzola, Lanconelli, Herber and von Hoyningen-Huene2010).
The dataset analysed here is sparse during the five-month period from July–November 2007, because only a few radiosoundings were performed at Dome C in those winter months, due to the failed supply of helium for the radiosonde balloons from Terra Nova Bay to Dome C on account of the adverse meteorological conditions. However, the dataset consists of radiosounding measurements performed in all seasons, also including those made during winter, in the absence of solar radiation, when the UTLS conditions are the coldest of the year. Considering the usefulness of the present data for all those involved in meteorological, climatic and radiation budget studies at Dome C, the entire dataset will be made available to the scientific community on the POLAR-AOD website (http://polaraod.isti.cnr.it:8080/Polar/), accessible by a password provided on request to the corresponding author.
Analysis of the radiosounding measurements
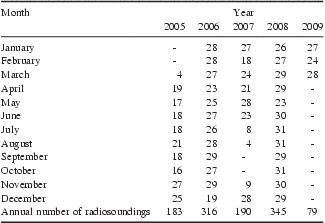
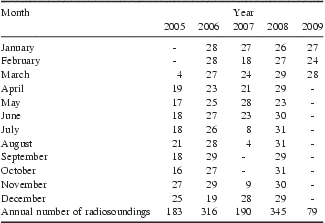
The four-year dataset of raw radiosonde measurements consists of 36 RS80-A radiosoundings and 1077 RS92 radiosoundings performed at Dome C, at 12h00 UT of each day, from 25 March 2005–31 March 2009. The overall 1113 radiosoundings were taken regularly by the ENEA meteorological group over the four years, except in the July–November 2007 period, when only 21 radiosoundings were performed due to the lack of helium for inflating the balloons. The number of radiosoundings performed in each month of the four-year period is given in Table I, showing that only four radiosoundings were performed in March 2005, four to nine in July, August and November 2007, and none in September and October 2007. A variable number of 18–28 radiosoundings were collected at Dome C in all other months, since a certain number of days each month presented particularly severe meteorological conditions preventing the radiosonde launch.
Monthly number of radiosoundings performed at Dome C over the four-year period from late March 2005 to the end of March 2009, for an overall number of 1113 radiosoundings.
Each radiosounding provided measurements of: i) p and T at more than 800 standard and additional levels in the altitude range from surface to 6.8 km altitude above ground level (hereinafter referred to as a.g.l.), and other 900–1900 stratospheric levels in the summer months, up to the radiosonde top level, and ii) RH at all the tropospheric levels mentioned above and at some supplementary levels from 6.8–11.8 km a.g.l. During ascent, the radiosonde transmitted to the ground station a triplet of signals, giving the measurements of p (in hPa), T (in °C), and RH (in %) at each measurement level. These were recorded at the ground station every 2 s and, hence, in altitude steps of 10–12 m, since the balloon ascent rate varied on average between 5 and 6 m s-1. In addition, the surface-level values of p, T and RH, measured at 12h00 UT of each radiosounding day by the barograph, thermograph and hygrograph of the Concordia meteorological station, were also collected, to check the quality of the surface-level radiosonde data before launching.
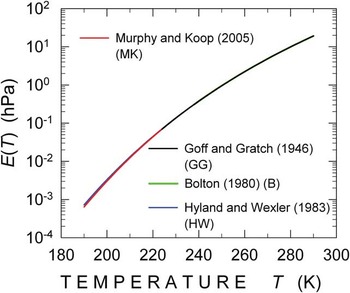
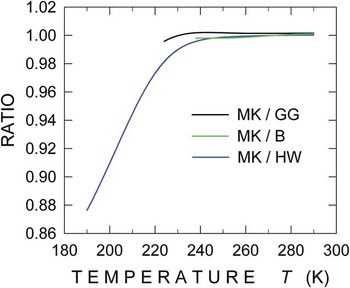
The geometrical altitude z of each radiosonde level was calculated for each triplet of radiosonde signals p, T and RH, using the manufacturer's algorithm based on the assumption that the air is in hydrostatic equilibrium. Starting from the surface-level pressure po measured with good precision by the barograph of the Concordia meteorological station (3233 m a.m.s.l.), the Vaisala algorithm calculates each altitude step Δz from the i-th to the (i + 1)-th level in terms of the values of virtual temperature Tv(z) and pressure p(z) taken at the two subsequent levels, where Tv(z) is determined at each level as a function of T(z), p(z) and partial pressure e(z) of water vapour (Dubin et al. Reference Dubin, Sissenwine and Teweles1966). In the pair of equations used to calculate parameters Δz and Tv(z) at each level (see Tomasi Reference Tomasi, Petkov, Benedetti, Valenziano and Vitale2011a, eqs. (1) and (2)): i) the saturation water vapour pressure E(T) in the pure phase over a plane surface of pure liquid water was determined as a function of T(z), using the Murphy & Koop (Reference Murphy and Koop2005) formula (see Appendix) over the 180 ≤ T ≤ 260 K range (typical of absolute temperature conditions observed in the troposphere and low stratosphere above Dome C), and ii) the corresponding value of e(z) was calculated by multiplying E(T) by RH at each level.
Only a small number of 36 radiosoundings were performed with RS80-A radiosondes, equipped with Barocap capacitive aneroid, traditional Thermocap sensor, and A-Humicap sensor. On the other 1077 days RS92 radiosondes were used to measure parameters p, T and RH with a new model of Barocap silicon sensor, the F-Thermocap sensor and a new model of heated twin-Humicap sensors, respectively. The main characteristics (measurement range, resolution, accuracy, repeatability in calibration and reproducibility in sounding) of the Barocap, Thermocap and Humicap models are provided in Tomasi et al. (Reference Tomasi, Petkov, Benedetti, Valenziano and Vitale2011a, see table 1).
Bearing in mind that all the radiosounding measurements are affected by experimental errors of various origins and significant environmental errors due to the extreme meteorological conditions of the Antarctic Plateau atmosphere, the procedure of Tomasi et al. (Reference Tomasi, Petkov, Benedetti, Valenziano and Vitale2011a) was followed in the present study to reduce the systematic errors of the various sensors. It is briefly presented in the following sub-sections to help the reader, separately for the Barocap, Thermocap and Humicap sensors.
Evaluation of the Barocap errors
The Barocap sensors mounted on the two Vaisala radiosonde models are affected by instrumental errors smaller than 1 hPa over the usual operational 3–630 hPa range at Dome C. Rigorous checks of the ground level RS80-A and RS92 Barocap sensor measurements were regularly performed by comparing each radiosonde measurement of surface pressure po made a few minutes prior to launch, at about 11h55 UT, with the simultaneous value of po recorded by the barograph of the Concordia meteorological station. Very small differences between these independent measurements of po were found for all the radiosoundings, with a standard deviation (SD) value of ± 0.6 hPa, comparable with the Barocap accuracy of ± 0.5 hPa declared by the manufacturer. Therefore, for the good performances of the Dome C Humicap sensors, large errors like those reported by Hudson et al. (Reference Hudson, Town, Walden and Warren2004) were avoided, presumably due to the careful preparation of the radiosondes by the ENEA team, who left them outdoors for at least five minutes before launch. This was estimated to be sufficient time to allow the Barocap sensors to reach near thermal equilibrium with the environment.
Evaluation of the Thermocap errors and their correction
The preparation of the RS80-A and RS92 radiosondes in an appropriate room at Dome C and the subsequent “outdoor” period of at least five minutes prior to launch, allowed the avoidance of significant temperature lag errors, like those observed by Mahesh et al. (Reference Mahesh, Walden and Warren1997) and Hudson et al. (Reference Hudson, Town, Walden and Warren2004) at South Pole. The temperature data recorded at Dome C with the RS80-A Thermocap were corrected by applying the Luers & Eskridge (Reference Luers and Eskridge1995) procedure to remove errors caused by heating due to incoming solar and/or infrared radiation, heat conduction from the other radiosonde components, and heat exchanges between the sensor and environment. However, the errors made by the F-Thermocap sensor mounted onboard the RS92 radiosondes were totally neglected, as suggested by Luers (Reference Luers1997).
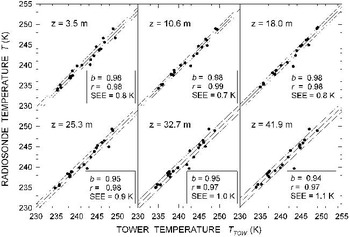
The RS80-A and RS92 temperature data are affected by lag errors depending on air density and ventilation speed, for an average lag time estimated at Dome C to increase from 3 s at surface level to about 10 s at levels varying between 18.7 and 21.7 km a.g.l., giving an average lag error < 0.2 K from 0.8–21.8 km a.g.l. (Tomasi et al. Reference Tomasi, Petkov, Benedetti, Valenziano and Vitale2011a). Therefore: i) the RS80-A lag error was corrected at altitudes z ≤ 0.8 km a.g.l. by assuming that it increases linearly with the vertical temperature gradient γ = dT/dz, and for z > 0.8 km a.g.l. by using the algorithm derived by Tomasi et al. (Reference Tomasi, Cacciari, Vitale, Lupi, Lanconelli, Pellegrini and Grigioni2004) for a radiosonde ascent rate of 6 m s-1, and ii) the RS90/92 Thermocap lag error was estimated to be negligible by Luers (Reference Luers1997) in the mid-latitude atmosphere. However, the time-constant of this sensor was estimated by Tomasi et al. (Reference Tomasi, Petkov, Benedetti, Valenziano and Vitale2011a) to increase on average at Dome C from about 0.4 s at surface level to 2.5 s at 42.7 km a.g.l., while Rowe et al. (Reference Rowe, Miloshevich, Turner and Walden2008) found at Dome C that the temperature correction for the Thermocap sensor was typically smaller than 0.2 K at all levels z < 0.8 km a.g.l. located above the thermal inversion ground layer, and almost totally negligible at levels > 0.8 km a.g.l. Thus, the temperature lag errors were all neglected here at altitudes z > 0.8 km a.g.l., and were assumed to be proportional to the vertical temperature gradient γ at lower levels. To check the validity of this assumption, some tests were performed, by comparing the values of T obtained from the present radiosoundings at levels z = 3.5, 10.6, 18.0, 25.3, 32.7 and 41.9 m above the surface with those simultaneously measured by Genthon et al. (Reference Genthon, Town, Six, Favier, Argentini and Pellegrini2010) using six thermistors placed at the same levels on the Dome C meteorological tower during the summer period from 16 January 2009–4 February 2009, for temperature conditions no lower than 233 K at the ground. The comparison between corrected radiosounding data and the measurements of Genthon et al. (Reference Genthon, Town, Six, Favier, Argentini and Pellegrini2010) (downloaded from the website http://www-lgge.obs.ujf-grenoble.fr/~christo/calva/home.shtml, accessed 6 June 2011) is shown in Fig. 1. The figure very clearly shows that radiosounding data and meteorological measurements agree very well at all the six levels, giving regression lines with slope coefficients ranging between +0.94 and +0.98, regression coefficients varying between +0.97 and +0.99, and standard errors of estimate (SEE) ranging between ± 0.7 K and ± 1.1 K at the various levels.
Scatter plots of the daily values of temperature T(z) (obtained at the six levels z = 3.5, 10.6, 18.0, 25.3, 32.7 and 41.9 m above the surface from the 12h00 UT radiosonde measurements performed in the 15 January–6 February 2008 period) vs the simultaneous values of T(z) measured by Genthon et al. (Reference Genthon, Town, Six, Favier, Argentini and Pellegrini2010) using six thermohygrographs placed at the same levels on the Dome C meteorological tower. The regression lines (solid lines) were determined, obtaining values of slope coefficient b ranging between +0.94 and +0.98, and values of regression coefficient r between +0.97 and +0.99.

Evaluation of the Humicap errors and their correction
The time-constant of the A-Humicap sensor was estimated by Miloshevich et al. (Reference Miloshevich, Paukkunen, Vömel and Oltmans2004) to be negligible at temperatures T>220 K only, while that of H-Humicap sensors was evaluated to be negligible at all polar temperatures, due to the use of an improved thin polymer layer (Miloshevich et al. Reference Miloshevich, Vömel, Whiteman, Lesht, Schmidlin and Russo2006). The ground-level raw radiosonde RH data were all regularly checked before each launch, comparing them with the simultaneous RH measurements recorded by the hygrograph of the Concordia meteorological station. Only small discrepancies were found for the whole measurement period, mainly within ± 0.5%, and therefore within the declared accuracies of the two Humicap sensors. The correction procedure applied to the RH measurements by Tomasi et al. (Reference Tomasi, Petkov, Benedetti, Valenziano and Vitale2011a) consisted of the following steps:
1) A “skeleton” profile of RH was constructed for each radiosounding, as recommended by Miloshevich et al. (Reference Miloshevich, Paukkunen, Vömel and Oltmans2004), to determine a more schematic and simplified vertical profile.
2) The so-called basic calibration model (BCM) errors, chemical contamination (CC) dry biases, temperature dependence (TD) dry biases, and sensor aging (SA) dry biases were removed from the A-Humicap raw data by applying the algorithms of Wang et al. (Reference Wang, Cole, Carlson, Miller, Beierle, Paukkunen and Laine2002), and taking into account the Miloshevich et al. (Reference Miloshevich, Vömel, Paukkunen, Heymsfield and Oltmans2001) evaluations of the TD dry biases. The H-Humicap measurements were instead corrected for the BCM errors and the TD and SA dry biases only, according to Miloshevich et al. (Reference Miloshevich, Vömel, Whiteman, Lesht, Schmidlin and Russo2006).
3) The RH lag errors were removed, using the multi-step procedure of Miloshevich et al. (Reference Miloshevich, Paukkunen, Vömel and Oltmans2004), whose corrections were tested successfully with in situ RH measurements taken within the thermal inversion ground layer (see Tomasi et al. Reference Tomasi, Petkov, Benedetti, Valenziano and Vitale2011a, fig. 4).
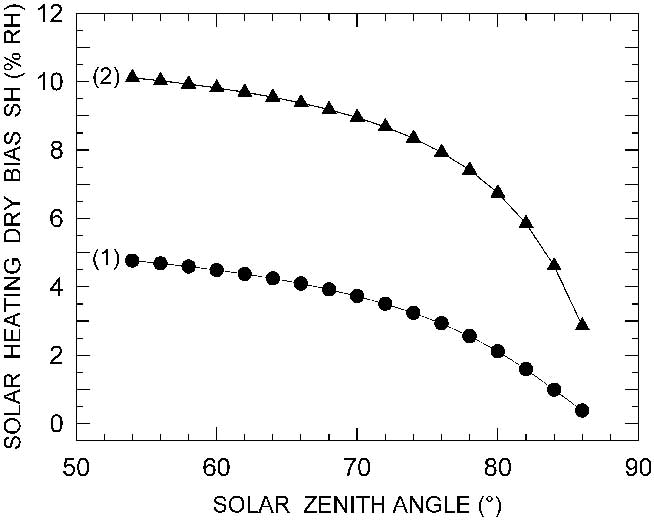
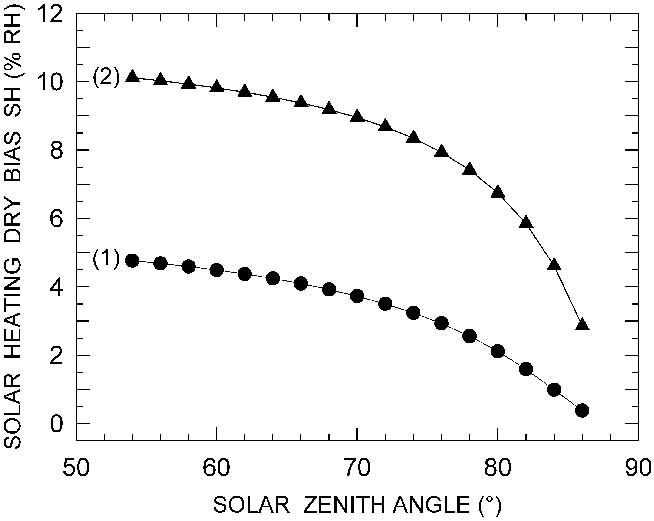
4) The daytime solar heating (SH) dry biases in the RS80-A raw data were corrected using an improved algorithm with respect to that obtained by Tomasi et al. (Reference Tomasi, Petkov, Benedetti, Valenziano and Vitale2011a), as derived from the Cady-Pereira et al. (Reference Cady-Pereira, Shephard, Turner, Mlawer, Clough and Wagner2008) algorithm for mid-latitude atmospheric conditions. The present algorithm was properly adapted to the real insolation conditions observed at Dome C, taking into account the Rowe et al. (Reference Rowe, Miloshevich, Turner and Walden2008) evaluations of the dry bias correction factor. It is compared in Fig. 2 with the original algorithm of Cady-Pereira et al. (Reference Cady-Pereira, Shephard, Turner, Mlawer, Clough and Wagner2008), showing that the SH dry biases at Dome C were evaluated to be about twice those estimated in mid-latitude atmospheres.
Fig. 2Curves of the percentage solar heating (SH) dry bias (measured in % relative humidity (RH)) as a function of solar zenith angle (SZA) over the range usually observed at Dome C. Curve (1), relative to the RS80-A Humicap sensor, was obtained from the original Cady-Pereira et al. (Reference Cady-Pereira, Shephard, Turner, Mlawer, Clough and Wagner2008) algorithm defined for mid-latitude troposphere conditions, and curve (2) from the adaptation of the Cady-Pereira et al. (Reference Cady-Pereira, Shephard, Turner, Mlawer, Clough and Wagner2008) algorithm to the Dome C atmospheric transparency conditions, taking into account the experimental evaluations of the RS80 radiosonde performances made by Rowe et al. (Reference Rowe, Miloshevich, Turner and Walden2008) at Dome C.

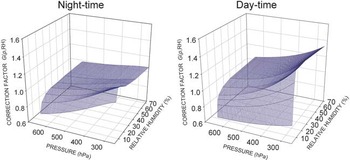
5) The instrumental night-time and daytime errors of the RS92 data were corrected using the correction factor algorithms obtained from those of Miloshevich et al. (Reference Miloshevich, Vömel, Whiteman and Leblanc2009) and further improved with respect to that of Tomasi et al. (Reference Tomasi, Petkov, Benedetti, Valenziano and Vitale2011a) through the use of a smoothing procedure over the pressure and RH ranges. They are shown in Fig. 3 to provide evidence of the wider range of the daytime Miloshevich et al. (Reference Miloshevich, Vömel, Whiteman and Leblanc2009) correction factor G(p, RH) than the night-time one, since it also includes the correction term for the SH dry biases.
Fig. 3Graphs of the night-time (left) and daytime (right) correction factor G(p, RH) as a function of air pressure p and relative humidity (RH), as determined by Miloshevich et al. (Reference Miloshevich, Vömel, Whiteman and Leblanc2009) for the RS92 Humicap sensor by examining a numerous set of radiosounding measurements at levels varying between 250 and 640 hPa in the mid-latitude troposphere.

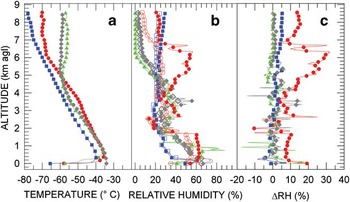
Four examples of vertical profiles of T and RH are shown in Fig. 4, as obtained from RS80-A and RS92 radiosoundings performed for different seasonal conditions. They give a measure of the overall RH corrections made at tropospheric altitudes by applying the correction procedure described above. All four vertical profiles of T(z) present more or less pronounced temperature inversion layers near the ground, which are particularly critical for the correction of the A-Humicap data, because strong variations of the vertical profiles of T(z) can cause large changes in the raw RH data, sometimes varying rapidly between 20% and 60%. From the comparison between the raw vertical profiles of RH and the corresponding corrected profiles, the difference ΔRH between raw and final values of RH was estimated in Fig. 4 at all levels. In the case of the RS80-A vertical profile, it can be seen that strong RH corrections were made at some altitudes, especially within the ground layer and at levels close to the tropopause, where the abrupt changes in T(z) caused pronounced instability effects on the Humicap sensor, with variations of ΔRH ranging between -10% and more than +20%. Due to such unstable responsiveness of the A-Humicap sensor, the RS80-A vertical profile of ΔRH was determined for SD values within ± 10% from surface level to 6 km height, and SD values within ± 20% at the higher levels. Conversely, the RS92 vertical profiles were determined in general for values of ΔRH no greater than ± 5% at all tropospheric levels, independent of the abrupt changes in the vertical temperature gradient. The limited values of ΔRH found for the RS92 data are fully consistent with the Miloshevich et al. (Reference Miloshevich, Vömel, Whiteman and Leblanc2009) estimates of such corrections, in general no higher than a few percentage points within the ground layer, for T(z)<240 K, and only rarely exceeding ± 5% at levels ranging between 5 and 9 km, for values of T(z) varying from 215–235 K. Correspondingly, the SD values were found to decrease gradually from ± 10% to ± 3% as the altitude increases from surface level to 1.8 km altitude a.g.l., and to remain within ± 5% at the higher altitudes.
a. Vertical profiles of temperature T(z) measured over the tropospheric altitude range at Dome C on four days (12h00 UT) in different seasons: 19 October 2005 (red circles), pertaining to RS80-A radiosonde data, 10 May 2007 (green triangles), 25 August 2006 (blue squares), and 6 December 2007 (grey diamonds), the last three days relating to RS92 radiosonde datasets. b. Comparison between the corresponding vertical profiles of the raw relative humidity (RH) data (open coloured symbols) recorded on the four selected days, and the final RH data (solid coloured symbols) obtained using the present correction procedure. c. Vertical profiles of the difference ΔRH between final and raw data of RH (solid coloured symbols) determined on the same four days selected in parts a. and b.

Annual variations in the vertical profiles of pressure, temperature and moisture parameters
The daily vertical profiles of parameters p, T and RH obtained in the previous section by correcting the raw data provided by the 1113 radiosundings were examined to elicit the annual cyclic features of the vertical profiles of p, T and RH from one year to another. The daily vertical profiles of absolute humidity q(z), and the daily values of precipitable water W were then calculated using the daily datasets of p, T and RH.
In order to define homogeneous vertical profiles of p, T and RH, the values of the three parameters were calculated for each radiosounding in regular altitude steps of 25 m from surface level to 0.8 km a.g.l., 50 m from 0.8–1.8 km a.g.l., 100 m from 1.8–8.8 km a.g.l., and 250 m from 8.8 km a.g.l. to the radiosonde top level. This was done by applying interpolation procedures in altitude between the data obtained at the radiosonde levels. The values of p(z) were determined in each vertical profile through exponential interpolation in height between the radiosonde pressure values, and those of T(z) and RH(z) through linear interpolation in altitude between the radiosonde values. Pressure and temperature data were often lacking on winter days at levels higher than 8.8–11.8 km a.g.l., due to the frequent rubber balloon breaks caused by the extremely cold conditions of the Antarctic stratosphere.
The values of RH were often found to be very low at levels z>8.8 km a.g.l., being comparable with the accuracy of the RH measurements themselves. Bearing in mind that the stratospheric content Ws of water vapour does not usually exceed a few percentage points of the total columnar content in the Antarctic atmosphere (Tomasi et al. Reference Tomasi, Petkov, Benedetti, Valenziano and Vitale2011a), it was decided to examine only the RH data taken from surface level to 8.8 km a.g.l. for the purpose of defining the moisture conditions of the atmosphere and determining the tropospheric precipitable water Wt. Therefore, the RH data recorded at levels z>8.8 km a.g.l. were rejected, since they are often lower than 2% and, hence, below the declared accuracy of the Humicap sensors (equal to 3% in the RS80-A radiosonde model and 5% in the RS92 model).
Annual cyclical variations in the pressure vertical profile
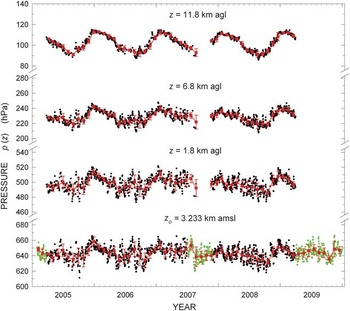
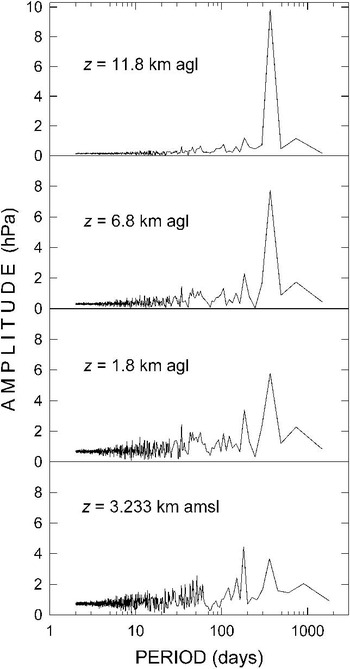
Figure 5 presents the time series of the daily radiosonde values of pressure at surface level (po) (black circles) and at the three altitudes of 1.8, 6.8 and 11.8 km a.g.l. The values of pressure po recorded at the Concordia meteorological station in the five-month period are also shown in Fig. 5 (green circles) to complete the description of the 2007 annual cycle of po, where radiosonde measurements were missing. Similarly, the Concordia meteorological station daily values of po recorded at 12h00 UT in the first three months of 2005 and the April–December period of 2009 are reported in Fig. 5 to achieve the whole five-year coverage. It can be seen that the values of po and p(z) measured at level z = 1.8 km a.g.l. do not reveal regular cyclical patterns over the five years. Conversely, the time series of p(z) at 6.8 and 11.8 km a.g.l. clearly describe a series of nearly regular annual cycles, which can be easily recognized in spite of the sometimes irregular day-to-day changes. The yearly maximum is usually observed during the summer (most frequently in December) and the minimum in late winter, in general from August–October. To identify the main periodical features of the pressure vertical profiles, the time series of daily pressure values shown in Fig. 5 were analysed using the Scargle (Reference Scargle1982) method (giving similar results to those of the Lomb (Reference Lomb1976) procedure) to define the periodograms of the four time series of these 12h00 UT daily pressure values. The basic tool of this spectral analysis is the discrete Fourier transform for each time series of data, for determining the classical periodogram represented as a sum of sinusoidal components of various frequencies: the Scargle (Reference Scargle1982) analysis adopted in the present application allowed the identification of the periods characterizing the harmonic components, defining their amplitude peaks, although they are usually affected by important spectral leakage effects due to the finite time interval over which the time series of data were sampled. The results are presented in Fig. 6, providing evidence of the sequence of low “noise” amplitude peaks at all four levels, for periods from a few days to about one month, due to the episodic patterns of the meteorological events. These minor peaks characterized by very short periods are followed by: i) weak peaks centred at periods of 2–5 months, and two pronounced peaks of 6 and 12 months about double the amplitude of the surface level “noise” peaks, ii) numerous weak “noise” peaks from one to four months, followed by a rather marked six-month peak and a very pronounced 12-month peak at level z = 1.8 km a.g.l., iii) some weak peaks from one to four months, a very moderate six-month peak and a considerably more marked one-year peak at level z = 6.8 km a.g.l., and iv) only a very pronounced peak of one year at level z = 11.8 km a.g.l. The results show that the one-year peak dominates at all UTLS levels, while the other amplitude peaks are less pronounced due to the effects of the variable meteorological events associated with the circulation patterns over the continental scale. Actually, the features of atmospheric pressure field within the lower tropospheric region near the ground appear to be more dominated by the seasonal variations in the energy exchange processes between surface and atmosphere than by the short-time alternating features of more or less marked cyclonic conditions.
Time series of the daily values of pressure po at the Dome C surface level and of p(z) at levels z = 1.8, 6.8 and 11.8 km a.g.l. (small black circles) in the four-year radiosounding period from late March 2005 to the end of March 2009. The 12h00 UT values of po recorded at the Concordia meteorological station are also shown (green circles) for the periods in which radiosondes were not employed or few radiosoundings were made. Red squares represent the monthly mean values of pressure at the four chosen levels, calculated for the various monthly subsets of daily pressure data together with their standard deviations (red vertical bars).

Periodograms of Scargle (Reference Scargle1982) obtained for the time series of daily values of pressure po at surface level zo = 3.233 km a.m.s.l., and pressure p(z) at levels z = 1.8, 6.8 and 11.8 km a.g.l., shown in Fig. 5, giving the amplitude of the harmonic components as a function of period.

In order to better describe the seasonal variations in atmospheric pressure, the 1113 daily vertical profiles of p(z) were subdivided into monthly subsets for each year, for which the monthly mean vertical profiles of p(z) were calculated at the above-fixed levels, from surface level up to the highest top level reached by the radiosondes. Figure 5 also shows the sequences of the monthly average values of p(z) at the four levels, together with their SD values, which are in general equal to a few percentage points over the whole 2005–09 radiosounding period.
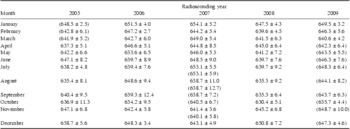
The monthly mean values of po determined over the five years present an overall maximum of 658.7 ± 5.6 hPa in December 2005 and a minimum of 630.4 ± 5.1 hPa in October 2008. More generally, the values turn out to be: i) lower in the winter months, varying mainly between 630 and 640 hPa, and ii) higher in the summer months, varying mainly between 645 and 655 hPa. No evident annual variations are described by the time series of the monthly mean values of p(z) for z = 1.8 km a.g.l., which generally range between 490 and 500 hPa in winter and between 500 and 510 hPa in summer, with irregular features throughout the whole multi-year radiosounding period. Conversely, Fig. 5 clearly shows that the time series of p(z) describe regular annual cycles at the 6.8 km level a.g.l. and even more evident cycles at the stratospheric level of 11.8 km a.g.l. The monthly mean values of p(z) for level z = 6.8 km a.g.l. exhibit minima of around 220 hPa in winter and maxima close to 240 hPa in summer, while those of p(z) for level z = 11.8 km a.g.l. describe regular annual cycles with minima of nearly 90 hPa in the winter months and maxima exceeding 110 hPa in summer.
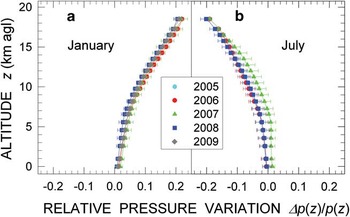
The monthly average values of po calculated over the whole five-year period are also given in Table II, together with their SD values. They indicate that po assumed monthly mean values varying between 640 and 659 hPa from December–February, 634 and 649 hPa from March–May, 635 and 653 hPa from June–August, and 630 and 649 hPa from September–November, with seasonal variations no greater than ± 3% in general. It is well known that air pressure decreases in a nearly exponential fashion with altitude, depending closely on atmospheric air density and temperature. In the present study, the daily vertical profiles of p(z) were found to show dependence features on altitude, yielding appreciably different values of pressure passing from the long winter season to summer. In general, the values of p(z) determined in July are considerably lower than those measured in January at all tropospheric and low-stratospheric levels, due to the presence of the Antarctic vortex. However, only relatively small changes characterize the monthly mean vertical profiles of p(z) from one year to another, which are more evident at altitudes from 6.8–26.8 km a.g.l. To give a measure of these year-to-year variations Fig. 7 shows the vertical profiles of ratio Δp(z)/p(z) calculated for the months of January and July of the various years, where Δp(z) is the difference between the monthly mean value of p(z) determined for a certain year and the monthly mean value of p(z) calculated over the whole four-year set of vertical profiles. Although limited to a relatively short period for providing statistically significant statements (four years only), the results in Fig. 7 give a picture of the seasonal variations in p(z) occurring in the troposphere and low stratosphere, indicating that ratio Δp(z)/p(z) assumes in general positive values in January and values of opposite sign in July. The values measured in January increase gradually with altitude, until reaching a value of +20% on average at the level of 18.8 km a.g.l. for all the four years, presenting a marked increase in 2006 and a more limited increase in 2008, which differ by no more than a few percentage points. Conversely, the values of ratio Δp(z)/p(z) measured in July decrease with altitude, until reaching a value of about -20% at the level of 18.8 km a.g.l., and present a more pronounced decrease in 2008 and less decreasing features in 2007, differing by no more than 5% from one year to another at all the tropospheric and stratospheric levels. Figure 7 also shows that appreciable year-to-year variations affect the pressure conditions of the atmosphere at all tropospheric and stratospheric levels, which are smaller than 2% in January of all years and in July of 2005, 2006 and 2008 but are higher than 4% in July 2007 at levels between 4 and 9 km a.g.l.
Monthly mean values of surface-level pressure po (hPa) obtained with their standard deviations from the radiosonde data recorded over the four-year radiosounding period from late March 2005 to the end of March 2009 at Dome C. Radiosounding measurements were not performed in January, February and the first 20 days of March 2005, and in September and October 2007, in the latter case due to the lack of helium for the balloons. Radiosounding measurements performed after March 2009 were not examined in the present study. To complete the dataset over the period from 2005–09, the monthly mean values of po are also given in brackets, as recorded at 12h00 UT by the barograph of the Concordia meteorological station in the months when radiosondes were not launched or only few radiosoundings were performed.

Vertical profiles of the monthly mean values of relative pressure variation Δp(z)/p(z) obtained for a. January 2006, 2007, 2008 and 2009, and b. July 2005, 2006, 2007 and 2008 with respect to the monthly average vertical profile of p(z) determined by Tomasi et al. (Reference Tomasi, Petkov, Benedetti, Valenziano and Vitale2011a) in the four-year period from late March 2005 to the end of March 2009 over the altitude range from surface level to 18.8 km a.g.l.

Annual cyclical variations in the temperature vertical profile
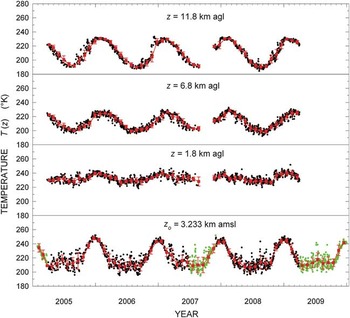
The vertical profiles of T(z) were corrected for the lag and heating errors in the ‘Evaluation of the Thermocap errors and their correction’ section. The values of T(z) were then linearly interpolated in altitude at all the fixed levels established in the ‘Annual variations in the vertical profiles of pressure, temperature and moisture parameters’ section, to define homogeneous vertical profiles of T(z) for all the radiosoundings. Figure 8 shows the time patterns of the daily values of surface level temperature To and T(z) at the 1.8, 6.8 and 11.8 km a.g.l. levels, throughout the four-year radiosounding period. The time series of To was completed with the daily 12h00 UT values of To recorded at the Concordia meteorological station from January–March 2005, July–November 2007, and April–December 2009, obtaining a continuous time series of daily values of To over the whole five-year period. The dataset consisting of the 1113 daily vertical profiles of T(z) was subdivided into monthly subsets for each of the four years, and the monthly mean values of To and T(z) at levels of 1.8, 6.8 and 11.8 km a.g.l. were calculated together with their relatively small SD values. The time series of these monthly mean values are also shown in Fig. 8, for comparison with the daily values, giving evidence of the regular annual cyclical variations of temperature at ground level and at 6.8 and 11.8 km a.g.l., and of the more stable temperature features found at 1.8 km a.g.l. throughout the year.
As in Fig. 5, for the daily values of surface temperature To and those of T(z) at altitudes z = 1.8, 6.8 and 11.8 km a.g.l. (small black circles). The 12h00 UT values of To recorded at the Concordia meteorological station are also shown (green circles) for the periods with few or no radiosoundings. Red squares represent the monthly mean values of temperature at the four chosen levels, together with their standard deviations (red vertical bars).

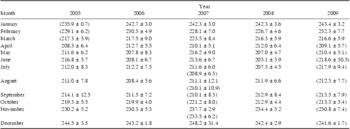
Despite the wide scatter of the data, Fig. 8 clearly shows that the daily values of To describe well-defined annual cycles in all the five years, with pronounced maxima of nearly 250 K in the summer (December–January) and large minima of less than 210 K during the long winter season from April–October. As shown in Table III for the 2005–09 period, the highest monthly mean value of To (248.2 ± 31.4 K) was recorded in December 2007 and the lowest (207.0 ± 4.7 K) in May 2008. Including also the Concordia meteorological station data, the results in Table III provide a detailed picture of the annual variations in the monthly mean values of To, ranging between: i) 208.3 K (April) and 244.5 K (December) in 2005, ii) 207.8 K (May) and 243.2 K (December) in 2006, iii) 208.9 K (July) and 248.2 K (December) in 2007, iv) 203.1 K (June) and 242.4 K (December) in 2008, and v) 209.1 K (April) and 243.4 K (January) in 2009. The results in Table III indicate that the highest monthly mean values of To were generally recorded in December (in four of the five years) and the lowest ones in different winter months from April–July, due to the larger variability of the surface level thermal conditions during this long seasonal period.
Monthly mean values of surface-level temperature To (K) determined with their standard deviations from the radiosonde data recorded at Dome C over the four-year radiosounding period from late March 2005 to the end of March 2009. Radiosounding measurements were not performed in January, February and the first 20 days of March 2005, and in September and October 2007, in the latter case due to the lack of helium for the balloons. Radiosounding measurements performed after March 2009 were not examined in the present study. To complete the dataset over the period from 2005–09, the values of To are also given in brackets, as recorded at 12h00 UT by the thermograph of the Concordia meteorological station in the months when radiosondes were not launched or only few radiosoundings were performed.

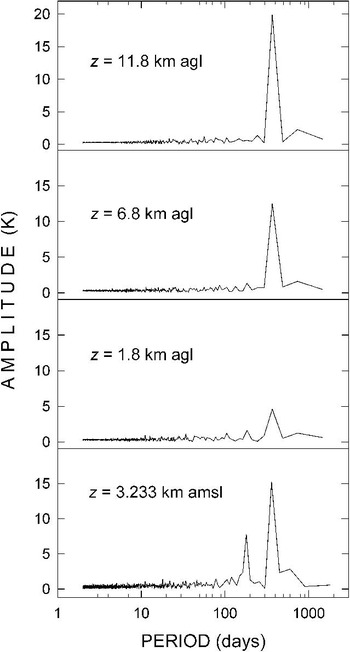
The time series of temperature shown in Fig. 8 were examined using the Scargle (Reference Scargle1982) analysis method. The results are presented in Fig. 9 for all four levels, giving evidence of a number of very weak “noise” periods ranging from a few days to one month at all levels. They were followed by: i) a moderate six-month amplitude peak and by an about twice higher one-year peak at surface level, ii) weak peaks relative to the three and six months and a rather moderate one-year peak at level z = 1.8 km a.g.l., and iii) very marked one-year peaks at the 6.8 km a.g.l. and 11.8 km a.g.l. levels, which dominate on all the other peaks with very low amplitudes. The results found at the surface level indicate that the thermal conditions characterizing the ground layer are subject to predominantly seasonal effects throughout the year, while the presence of a one-year peak only at level z = 1.8 km a.g.l. indicates that heat exchanges within the ground layer are less efficient in the considerably more stable tropospheric region above the boundary layer. The absence of important peaks for periods shorter than one year at levels z = 6.8 km a.g.l. and z = 11.8 km a.g.l. is clearly due to the fact that the thermal conditions of the UTLS region are regulated by the important warming processes taking place with seasonal features closely related to the stratospheric ozone cycle.

As shown in the periodogram of Fig. 9 relative to altitude z = 1.8 km a.g.l., the time series of T(z) at this level does not present evident annual cyclical features, although the lower values recorded in the winter ranged mainly between 220 and 230 K, while the higher ones exceeded 240 K in the summer months. Such stability is presumably due to the fact that this is an intermediate region of the troposphere, above the boundary layer of the atmosphere, and therefore not appreciably influenced by the thermal exchange effects occurring within the ground layer and the tropopause, where large thermal variations are observed throughout the year. Conversely, the values of T(z) at the 6.8 and 11.8 km a.g.l. levels exhibit regular annual cycles, the one at the 11.8 km a.g.l. level being more clearly defined and characterized by larger variations, due to the more intense cooling and warming processes occurring in the low stratosphere during the winter and summer, respectively. It is worth noting in Fig. 8 that temperature varied mainly: i) between 200 K and nearly 230 K at 6.8 km a.g.l. over the four-year radiosounding period, and ii) from values close to 190 K in winter to values of around 230 K in summer at 11.8 km a.g.l. throughout the four years.
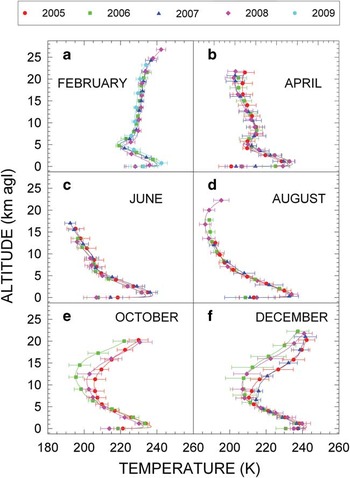
To give a measure of the seasonal variations characterizing the vertical profiles of T(z) during the various years in both troposphere and low stratosphere, the February, April, June, August, October and December monthly mean vertical profiles of T(z) calculated separately for each of the various years are presented in Fig. 10 for the altitude range from surface up to a radiosonde top level varying between 16 km (in June) and more than 26 km (in February). The calculations were made for each montly set of vertical profiles of T(z) recorded each year by: i) determining the daily values of T(z) at fixed levels in steps of 25 m through a linear interpolation procedure in height, and ii) calculating the monthly mean values of temperature at all levels with their standard deviations. It is worth remarking that the top levels reached by the radiosondes do not usually exceed the altitude 12–17 km a.g.l. in the winter months, due to the frequent balloon breaks in that season, but can be higher than 25 km a.g.l. in the summer months. Figure 10 shows that tropospheric temperature decreases considerably from February–August (by 12–18 K on average at surface level, and by 10–14 K on average in the upper troposphere at level z of c. 4 km a.g.l.), and subsequently increases from early September to December–January. At level z = 16.8 km a.g.l., which is representative of the mean thermal conditions of the lower stratosphere, the monthly average temperature was found to: i) decrease by about 35 K from February–August, reaching values close to c. 195 K, and ii) increase in the subsequent months, assuming values mostly higher than 240 K in December. The vertical profiles of T(z) shown in Fig. 10 were in general obtained for SD values no greater than ± 10 K at all the tropospheric levels and no greater than ± 15 K at stratospheric levels. The results indicate that appreciable year-to-year variations occur in some months only, which are: i) in general no higher than 5 K in the troposphere and 7 K in the low stratosphere, at all levels from the surface to more than 21.8 km a.g.l. in February, April, June and August, and ii) considerably more marked in the months from October to December, frequently exceeding 15 K at stratospheric altitudes of between 7 and more than 20 km, due to the well-known processes of stratospheric ozone formation occurring mainly in October and November. It is worth noting that these year-to-year changes are comparable with their SD values from 9–17 km a.g.l., and hence, give a measure of the year-to-year variability of the important photochemical processes leading to stratospheric warming. At such stratospheric altitudes, the 2006 and 2008 December vertical profiles exhibit clearly lower values than those measured in 2005 and 2007, by nearly 20 K, indicating that considerable year-to-year changes take place during the summer months, induced by the arrival of a more intense solar radiation density flux. Figure 10 also shows that the temperature minimum characterizing the tropopause region is particularly pronounced in February and April, and in practice disappears in August for all the years, while it is located at levels close to 12 km a.g.l. in December of 2006 and 2008, and at levels z>7 km a.g.l. in December of 2005 and 2007. These findings confirm the large year-to-year variability of warming and cooling processes occurring in the low stratosphere during the said period of the year, when important changes in the thermal structure of the tropopause region are generated by ozone formation.
Comparison among the monthly mean vertical profiles of temperature T(z) from the Dome C surface level to 27 km a.g.l. level, as obtained from the monthly datasets recorded in various years from 2005–09, separately for a. February, b. April, c. June, d. August, e. October, and f. December. Horizontal bars (labelled with different colours for the various years) represent the standard deviations calculated at some fixed levels.

Seasonal changes in the thermal structure of the temperature inversion ground layer
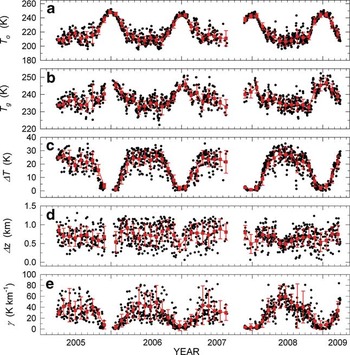
Figure 10 shows that marked temperature inversion features characterize the atmospheric ground layer at Dome C for most of the year. Extensive debates on the thermal structure of the surface inversion layer of the atmosphere at Antarctic Plateau sites have taken place in the past decades (Dalrymple Reference Dalrymple1966, Kuhn et al. Reference Kuhn, Kundla and Streschein1977), motivated by the fact that such large variations in the thermal conditions of the Antarctic atmosphere near the ground lead to marked changes in the long-wave radiation budget throughout the year (Walden et al. Reference Walden, Warren and Murcray1998). Therefore, a detailed analysis of the present daily profiles of T(z) within the first two kilometers of the atmosphere was carried out by examining the time series of daily values of the five parameters that best represent the characteristics of the thermal inversion near the ground: i) temperature To at the surface level, ii) temperature Tg at the top level of the inversion ground layer, iii) depth Δz of the temperature inversion ground layer, iv) difference ΔT = Tg - To, and v) average vertical gradient γ of temperature calculated over the depth Δz. The first three of the five parameters are independent of each other, while ΔT and γ depend on the previous ones. The time series of the daily values of the five parameters are shown in Fig. 11, together with their monthly mean values and the corresponding SD estimates. The results indicate that:
As in Fig. 5 for the daily values (small black circles) of the five temperature inversion parameters characterizing the thermal inversion ground layer: a. temperature To at surface level, b. top level temperature Tg, c. difference ΔT = Tg - To, d. depth Δz, and e. average vertical gradient γ. Red squares represent the monthly mean values of the five parameters, together with their standard deviations (red vertical bars).

1) As shown in Fig. 8, surface level temperature To was found to describe annual variations that present maxima of the daily and monthly mean values ranging mainly between 240 and 248 K in the two central months of summer, and wide minima in the winter months from April–September, with daily values scattered largely over the 200–230 K range and monthly mean values ranging mainly between 207 and 224 K, with most of the SD values within ± 10 K.
2) Temperature Tg varied in the different years, presenting: i) scattered daily values ranging mainly between 230 and 240 K from April–October, with most of the monthly mean values between 233 and 238 K, determined for SD no higher than ± 5 K in general, and ii) the highest daily values in December and January, ranging mainly between 240 and 250 K, from which monthly mean values of around 245 K were obtained in the two summer months.
3) Parameter ΔT was consequently found to describe well-defined annual cycles, with: i) daily values ranging between 0 K and 5 K in December and January, and monthly mean values close to 2 K on average, and ii) daily values mainly varying between 15 and 30 K in the other months, giving monthly mean values of 20–25 K in the May–September period of each year.
4) Depth Δz exhibited very different daily values throughout the year over the whole four-year period, ranging mainly between 400 m and more than 1200 m, and providing monthly mean values of 700–900 m throughout the year, with SD values mostly ranging between ± 200 m and ± 350 m.
5) The daily values of the mean vertical gradient γ of temperature were evaluated to assume nearly null values in the summer months (December–January) and positive ones in the rest of the year, ranging mainly between 20 and 70 K km-1 from March–October. Monthly mean values of γ were obtained from the daily data, describing regular annual cycles with well-defined minima of 1–2 K km-1 in summer and large maxima varying mainly between 30 and 60 K km-1 from March–October in all four years, associated with SD generally higher than ± 20 K km-1. The results in Fig. 9 indicate that the temperature inversion structure is actually always present above Dome C, presenting very marked characteristics for most of the year and more uniform thermal conditions within the ground layer during December and January only. Therefore, the monthly mean values of the five parameters shown in Fig. 11 give evidence of the pronounced annual cycles described by the thermal inversion structure of the atmospheric ground layer.
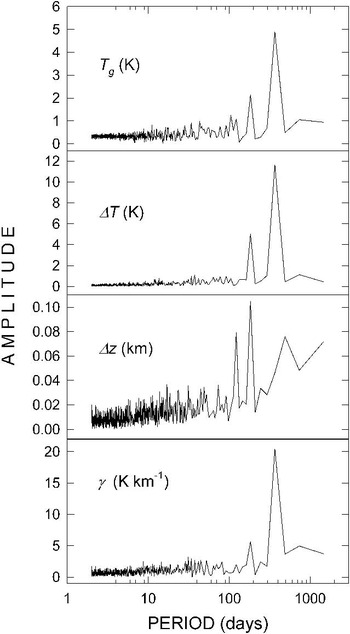
To provide evidence of the periodical features described above, the Scargle (Reference Scargle1982) analysis was undertaken for the time series of the daily values of parameters Tg, ΔT, Δz and γ, obtaining the periodograms presented in Fig. 12. They show that: a) the one-year peak is clearly predominant for parameters Tg, ΔT, and γ, while the six-month peak appears considerably less pronounced for all these three thermal inversion parameters, as was also found for the surface level temperature To in Fig. 9, and b) well-pronouced peaks of 4, 6 and 16 months are presented by the periodogram of Δz without the presence of a one-year peak. Such periodical features of Tg, ΔT, and γ are due to the occurrence of significant heat exchange processes between the surface and the ground-layer atmosphere, which are not so pronounced as to modify the stability of the atmospheric region situated above the thermal inversion layer throughout the entire year.

The time series of daily mean values of parameters To, Tg, ΔT, Δz and γ shown in Fig. 11 reveal appreciable variations from one year to another: the three parameters To, Tg, ΔT describe nearly regular patterns with more dispersed data characterizing the annual minima of the first two parameters and the annual maxima of ΔT, showing that: i) the highest daily values giving form to the annual maximum of To were measured in the summer periods of 2005/06 and of 2008/09, and the lowest daily values defining the annual minimum in the winter of 2006, ii) the highest daily values defining the annual maximum of Tg were recorded in the summer periods of 2006/07 and of 2008/09, and the lowest daily values defining the annual minimum in the winter of 2006, and iii) the highest daily values characterizing the annual maximum of ΔT were observed in the three winter periods of 2005, 2007 and 2008, while values close to 0 K were measured in all the summer periods. Fig. 11 also shows that the daily values of Δz and γ are greatly dispersed throughout the entire four-year period, with: a) no evident annual variations in the values of Δz (as also highlighted by the periodogram in Fig. 12), with higher values exceeding 1 km and lower values of around 0.1 km in the summer periods of 2006/07, 2007/08 and 2008/09, and b) highly variable values of γ, which exhibit nearly null minima during all the summer periods and are greatly scattered to form seasonal maxima that are higher than 80 K km-1 during the 2007 winter.
Seasonal changes in the thermal characteristics of the tropopause region
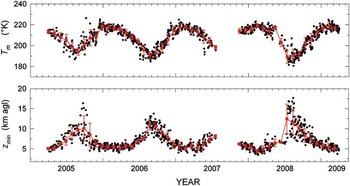
The monthly mean vertical profiles of T(z) shown in Fig. 10 clearly indicate that the thermal features of the tropopause and low stratosphere vary greatly from one season to another. Such seasonal changes occur not only in the lower part of the stratosphere, where annual variations of more than 40 K are observed in the 9–12 km a.g.l. altitude range, but also in the higher region from 17–27 km a.g.l., where annual variations of more than 50 K are usually recorded. It is interesting to note in Fig. 10 that the marked temperature minimum totally disappears in August, when stratospheric cooling is most intense, while the vertical profile of T(z) exhibits decreasing features with height up to c. 17 km a.g.l. in June and August, and c. 10 km a.g.l. in October. Correspondingly, the temperature minimum Tm assumes values lower than 195 K at c. 17 km a.g.l. in August, close to 200 K at c. 8 km a.g.l. in October, and 220 K at c. 5 km a.g.l. in December.
Considering the entity of these seasonal variations, parameters Tm and zmin were chosen to represent the seasonal variations of temperature in the altitude range in question. The two parameters were evaluated in each vertical profile of T(z) derived from the radiosonde data, according to the World Meteorological Organization (WMO 1957) criterion, which establishes that “the tropopause level is the lowest level at which the lapse rate decreases to 2 K km-1 or less, provided that the average lapse rate between this level and all the higher levels within 2 km does not exceed 2 K km-1”.
The time series of the daily and monthly mean values of Tm and zmin are reported in Fig. 13, where it is seen that:
As in Fig. 5 for the daily values (small black circles) of the two tropopause parameters. The upper part shows the time series of temperature minimum Tm, and the lower part those of the tropopause temperature minimum level zmin. Red squares represent the monthly mean values of the two parameters, together with their standard deviations (red vertical bars).

1) The daily values of temperature minimum Tm describe well-defined yearly cycles during the four-year radiosounding period, with monthly mean maxima of 215–220 K in the January–April period, and minima of c. 190 K in the July–September period (for SD values of ± 5 K on average), when a large extension of the tropopause region in height up to about 17 km a.g.l. is observed. Monthly mean values of Tm equal to 205–210 K were determined in the intermediate periods of May–June and October–November.
2) The daily values of level zmin showed clear annual cycles in spite of the large scatter of data, generally with wide minima at altitudes varying mainly between 5 km and no more than 6 km a.g.l. in December–April, and maxima varying on average between 9 and 11 km a.g.l. in July–October, although isolated values exceeding 12 km a.g.l., and in a few cases up to 17 km a.g.l. were obtained.
The overall set of monthly mean values of parameters Tm and zmin shown in Fig. 13 serve to integrate some recent results obtained on seasonal variations in the thermal structure of the tropopause in the Antarctic atmosphere (Tomikawa et al. Reference Tomikawa, Nishimura and Yamanouchi2009, Randel & Wu Reference Randel and Wu2010).
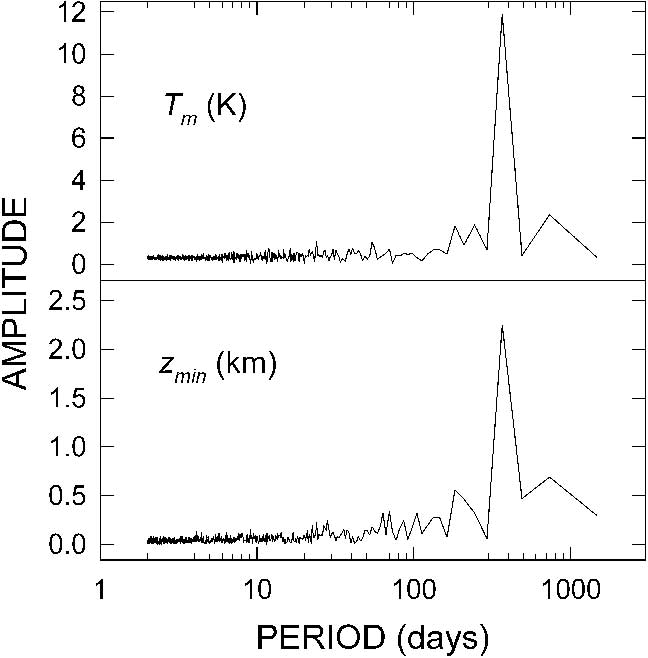
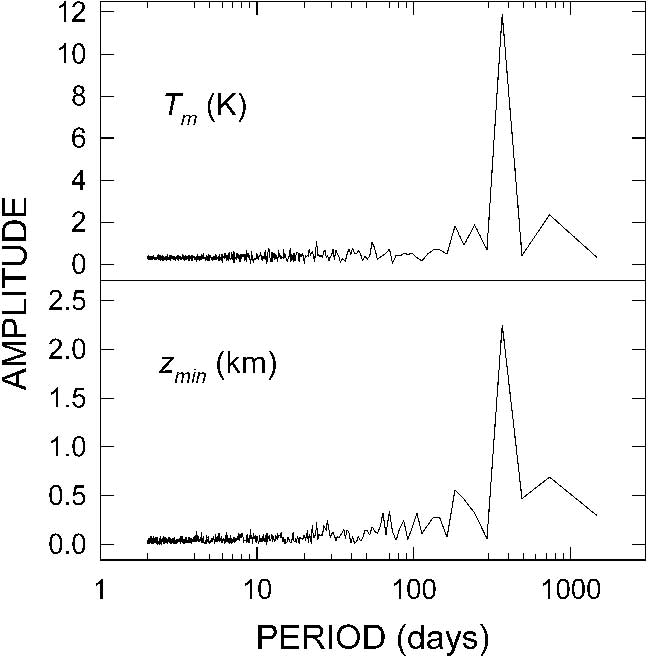
The series of daily values of the two tropopause parameters were analysed using the Scargle (Reference Scargle1982) method. The results are shown in the periodograms of Fig. 14, indicating that both parameters exhibit very low “noise” peaks from a few days to the six-month period and a very pronounced one-year peak. It is therefore clear that these parameters change with the evolutionary seasonal patterns of the stratospheric thermal structure, which are dominantly regulated by the esothermal reactions driving ozone formation. It can be seen in Fig. 13 that parameters Tm and zmin both present appreciable year-to-year variations: i) Tm exhibits the seasonally highest daily values in summer 2005/06 and the lowest ones in summer 2007/08, while the seasonally lowest daily values were measured in winter of 2008, and ii) level zmin presents its seasonally highest daily values (exceeding 17 km a.g.l.) in winter of 2008, and the lowest ones of < 5 km a.g.l. in the winter periods of 2007 and 2008.
Annual cyclical variations in the absolute humidity vertical profile
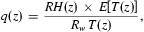
The raw RH daily data obtained from the 1113 radiosoundings in the altitude range from surface to c. 9 km a.g.l. were corrected for the numerous dry biases and lag errors affecting the RH radiosonde measurements, employing the procedure described in the ‘Evaluation of the Humicap errors and their correction’ section. The corrected values of RH were then examined to determine through linear interpolation in altitude the values of RH at the above-fixed levels of p(z) and T(z), in this way defining a “homogeneous” set of daily vertical profiles of RH. For the vertical profiles of RH and those of p(z) and T(z) correspondingly calculated in the ‘Annual cyclical variations in the pressure vertical profile’ and the ‘Annual cyclical variations in the temperature vertical profile’ sections, respectively, the vertical profiles of absolute humidity q(z) were determined (in g m-3) using the well-known equation of state for water vapour,
 $$q(z)\, = \,\frac{{RH(z)\,\times \,E\left[ {T(z)} \right]}}{{{{R}_w}\,T(z)}},\eqno\rm$$
where: i) the product of RH(z)×E[T(z)] yields the water vapour partial pressure e(z) measured in hPa at each level z, with E[T(z)] measured in hPa and determined using the Murphy & Koop (Reference Murphy and Koop2005) formula given in the Appendix, ii) Rw is the gas constant for water vapour, equal to 0.4615 J g-1 K-1, and iii) T(z) is air temperature measured in K.
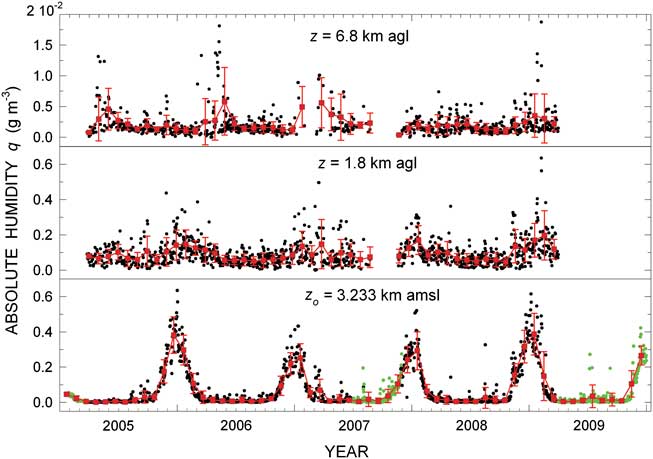
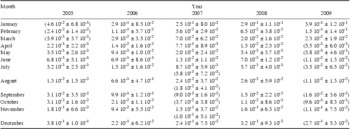
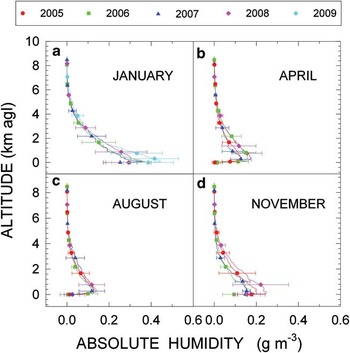
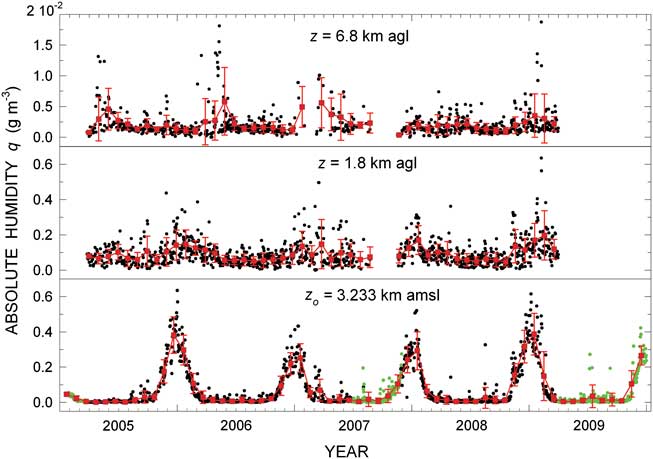
The time series of daily values of absolute humidity qo at the surface level are shown in Fig. 15 (black circles), together with the daily values of qo calculated for the Concordia meteorological station values of pressure, temperature and RH recorded at 12h00 UT of the days on which no radiosoundings were performed in January 2005–December 2009 (green circles). The data in Fig. 15 exhibit evident annual cycles, usually presenting very low values in the winter months from March–October, and considerably higher values in the remaining period of the year. Thus, the values of qo describe pronounced peaks varying on average between 0.2 and 0.4 g m-3, and present some isolated cases on summer days with values higher than 0.5 g m-3. The monthly mean values of qo are given in Table IV, together with their standard deviations, as obtained from the radiosonde measurements and/or from the Concordia meteorological station measurements taken in the months when only a few or no radiosoundings were performed, e.g. from January–March 2005, September–October 2007, and April–December 2009. They varied mainly between 0.002 and 0.010 g m-3 from April–July over the whole four-year period, and assumed higher values in the other months, with monthly maxima of 0.2–0.4 g m-3 in the summer. The time series of monthly mean values of qo derived from both radiosonde and ground-based measurements are shown in Fig. 15 with their SD vertical bars, to provide evidence of the annual cycles described by this parameter in 2005–09. In addition, Fig. 15 gives a measure of the year-to-year variations of: i) absolute humidity at surface level, with the most pronounced peaks in the summer periods of 2005/06 and 2008/09, and ii) absolute humidity at the 1.8 km and 6.8 km a.g.l. levels, with the seasonally highest daily values in the same summer periods for both altitudes.
As in Fig. 5 for the daily values of absolute humidity qo (small black circles) at surface level, and of q(z) at levels z = 1.8 km and z = 6.8 km a.g.l. The 12h00 UT values of qo recorded at the Concordia meteorological station are also given (green circles) during the periods with few or no radiosoundings. Red squares represent the monthly mean values of q(z) at the three chosen levels, together with their standard deviations (red vertical bars).
Monthly mean values of surface-level absolute humidity qo (g m-3) determined with their standard deviations from the radiosonde data recorded at Dome C over the four-year period from late March 2005 to the end of March 2009. Radiosounding measurements were not performed in January, February and the first 20 days of March 2005, and in September and October 2007, in the latter case due to the lack of helium for the balloons. Radiosounding measurements performed after March 2009 were not examined in the present study. To complete the dataset over the period from 2005–09, the values of qo are also given in brackets, as calculated from the 12h00 UT measurements performed by the barograph, thermograph and hygrograph of the Concordia meteorological station in the months when radiosondes were not launched or only few radiosoundings were performed.

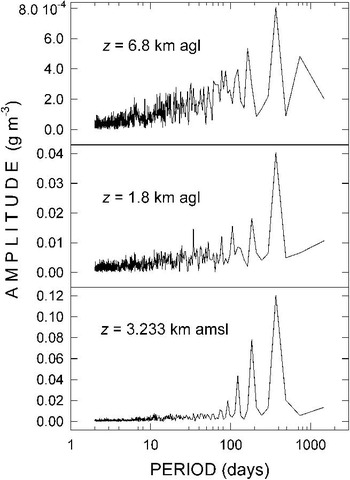
The periodical features evidenced in Fig. 15 agree very well with the indications obtained by applying the Scargle (Reference Scargle1982) method to the time series of daily values of qo and of q(z) for z = 1.8 km and 6.8 km a.g.l., also shown in Fig. 15. The corresponding periodograms are presented in Fig. 16, showing that: a) that of qo exhibits a one-year peak, which markedly predominates over the other minor “noise” peaks ranging from about one week to four months and over the six-month peak, which presents an amplitude value about half that of the one-year peak, and b) those of q(z) relative to the 1.8 km and 6.8 km a.g.l. levels also provide evidence of a marked one-year peak and numerous other secondary peaks of considerably lower amplitudes, evidencing the one-year periodical variability of the moisture conditions of the Antarctic atmosphere. According to the results provided by the Scargle (Reference Scargle1982) analysis, it can be seen in Fig. 15 that the time series of the daily values of q(z) for z = 1.8 km a.g.l. and z = 6.8 km a.g.l. describe less evident cyclic variations from one year to another compared to those recorded at the surface, where: i) numerous values of q(z) at the 1.8 km a.g.l. level are higher than 0.2 g m-3 during the warmer seasonal period, and ii) the values of q(z) at the 6.8 km a.g.l. level range mainly between 0.002 and 0.005 g m-3 throughout the year, and are in a few cases higher than 0.01 g m-3, presumably when the 6.8 km a.g.l. level falls below the tropopause and is reached by more humid upwelling air masses.

The four-year set of daily vertical profiles of q(z) was then subdivided into monthly sets for each year to determine the monthly mean vertical profiles of q(z) from the surface to c. 9 km a.g.l. Some of them are shown in Fig. 17 to give a measure of the year-to-year variations occurring during different seasons. It can be seen that the vertical profiles of q(z) are characterized by a marked maximum (more pronounced in April and August) at the top level of the thermal inversion forming near the ground, followed by a decreasing trend with height in the upper part of the troposphere. The monthly mean vertical profiles of q(z) determined in January assume ground values ranging mostly between 0.30 and 0.45 g m-3, which decrease gradually at upper altitudes, without showing evident peaks within the ground layer in the absence of strong temperature inversion conditions near the ground. The year-to-year variations are smaller than 0.1 g m-3 in this summer month, and are, hence, comparable with the SD values generally no higher than ± 0.12 g m-3. Lower values of q(z) were obtained in the other periods of the year at all levels, showing in all cases a marked peak in the lowest 600 m above the surface: i) in April, q(z) has a peak of about 0.2 g m-3, followed by gradually decreasing values at higher altitudes, with small year-to-year variations not exceeding the corresponding SD values of ± 0.07 g m-3, ii) in August, the vertical profiles of q(z) have similarly peaked curves within the ground layer, with year-to-year discrepancies considerably smaller than the SD values of about ± 0.05 g m-3, and decrease with altitude following similar trends in the various years, and iii) in November, considerably different values of q(z) are present from one year to another at all the levels lower than 3–4 km a.g.l., showing several peaks within the ground layer, with year-to-year differences of more than 0.02 g m-3, (i.e. 10%, comparable with the SD values mainly ranging between ± 0.05 and ± 0.10 g m-3 at levels z > 3 km a.g.l., before converging in a single profile above the 5 km a.g.l.). Figure 17 also shows that the most marked year-to-year variations in the vertical profiles of absolute humidity are generally observed within the lower part of the troposphere, mainly below the 2 km a.g.l. altitude, and during the warmest period of the year (such as in the examples of January and November shown in Fig. 17).
Comparison among the monthly mean vertical profiles of absolute humidity q(z) (g m-3) obtained at Dome C from surface level to 9 km a.g.l. altitude by separately examining the monthly subsets of corrected radiosonde data obtained in the four years from late March 2005 to the end of March 2009, separately for a. January, b. April, c. August, and d. November. Horizontal bars (labelled with different colours for the various years) represent the standard deviations calculated at some fixed levels.

Annual cycles of precipitable water
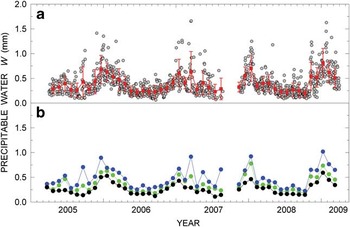
Reliable daily values of tropospheric water vapour content Wt were calculated by integrating the daily vertical profiles of q(z) obtained in the previous section over the altitude range from surface level to 12 km. As shown by Tomasi et al. (Reference Tomasi, Petkov, Benedetti, Valenziano and Vitale2011a), the stratospheric water vapour content Ws at Dome C assumes values of around 0.003 mm, and therefore varies between 0.4% and 1.5% of Wt throughout the year. Accurate monthly mean calculations of stratospheric water vapour content Ws in the polar atmosphere were recently undertaken by Tomasi et al. (Reference Tomasi, Petkov, Dinelli, Castelli, Arnone and Papandrea2011b) over the altitude range from 12–50 km a.m.s.l., analysing a numerous set of MIPAS/ENVISAT limb-scanning measurements of water vapour mixing ratio recorded from July 2002–April 2010 at latitudes from 65–90° in steps of 5°. At the 75°S latitude they found that the monthly mean values of Ws varied between 0.003 and 0.006 mm during the year. On the basis of these evaluations, calculations of the daily values of total precipitable water W were performed for all the vertical profiles of q(z) derived from the 1113 radiosoundings, integrating absolute humidity from the surface level to 9 km a.g.l. to obtain the daily values of Wt, and adding the monthly mean values of Ws evaluated by Tomasi et al. (Reference Tomasi, Petkov, Dinelli, Castelli, Arnone and Papandrea2011b) at the 75°S latitude. The time series of the daily values of W thus determined are reported in Fig. 18. As can be seen, W assumes: i) relatively low values ranging mainly between 0.1 and 0.4 mm during the winter months, and smaller than 0.1 mm in a few cases only, and ii) relatively high values in the summer months, varying mainly between 0.5 and 0.8 mm, with some isolated very high values of 1.0–1.6 mm, mostly observed from late November 2005 to late February 2006, in March 2007, in January 2008, and in January and February 2009.
a. Time series of the daily values of precipitable water W (small grey circles), as obtained by integrating the vertical profiles of absolute humidity q(z) derived from the 12h00 UT radiosonde measurements performed over the altitude range from surface level to 8.8 km a.g.l., and including the monthly mean estimates of stratospheric water vapour content of Tomasi et al. (Reference Tomasi, Petkov, Dinelli, Castelli, Arnone and Papandrea2011b). Red squares represent the monthly mean values of W, together with their standard deviations (red vertical bars). b. Time series of the monthly 25th percentiles (black circles), 50th percentiles (green circles) and 75th percentiles (blue circles) calculated for the various monthly subsets of daily values of W.

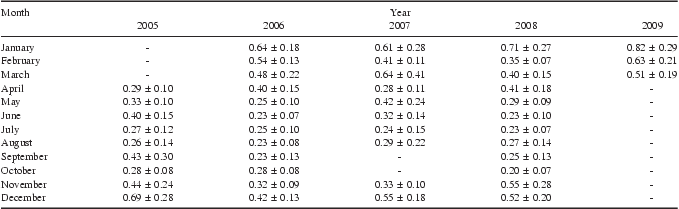
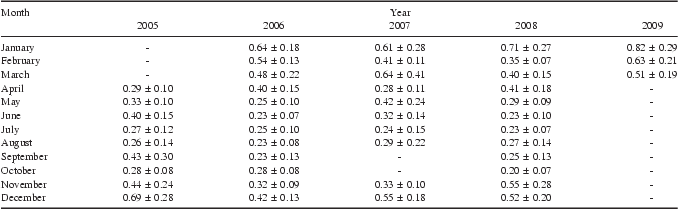
In view of these findings, it was decided to describe the annual cycles of W in a more statistically significant form by presenting in Fig. 18 also the sequence of the monthly mean values of W. Such monthly mean values describe quite regular cycles, varying mainly between 0.20 mm (October 2008) and 0.43 mm (September 2005) in April–October and between 0.32 mm (November 2006) and 0.82 mm (January 2009) in November–March, for SD values ranging between 0.07 and 0.25 mm in the winter months and between 0.07 and 0.49 mm in the rest of the year. The results are also given in Table V with their SD values, showing that significant year-to-year variations characterized the annual cycles of W: i) annual maxima found in the summer months were equal to 0.69 mm in December 2005, 0.64 mm in January 2006, 0.61 mm in January 2007, and 0.71 mm in January 2008, and ii) annual minima during the winter were equal to 0.27 mm in July and August 2005, 0.23 mm in June, August and September 2006, 0.24 mm in July 2007 (the year for which September and October data were not available), and 0.20 mm in October 2008. Additionally, the time series of the monthly values of the main percentiles of W are shown in Fig. 18b: the monthly medians of W describe similar annual cycles to those of the monthly mean values given in Table V, varying mainly between 0.25 mm and 0.40 mm during the winter periods, and between 0.50 mm and 0.75 mm in the summer months. Correspondingly, the monthly 25th percentiles are in general lower than 0.20 mm in May–October, and vary between 0.24 mm and 0.50 mm in November–April. The 75th percentiles range mainly between 0.28 and 0.42 mm in April–October, and between 0.52 and more than 0.75 mm in November–March, displaying quite similar features from one year to another.
Monthly mean values of precipitable water W (mm) determined with their standard deviations from the radiosonde dataset recorded at Dome C over the four-year period from April 2005–March 2009. Radiosounding measurements were not performed in September and October 2007, due to the lack of helium for the balloons.
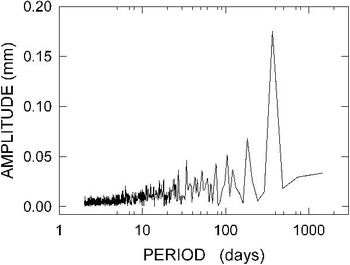
To highlight their periodical characteristics, the time series of daily mean values of W shown in Fig. 18a were analysed using the Scargle (Reference Scargle1982) method, obtaining the periodogram presented in Fig. 19, which exhibits a sequence of small peaks gradually increasing in amplitude from a few days to the six-month period and a very marked one-year peak, with amplitude more than double that of the six-month peak. It is evident that precipitable water varies periodically throughout the year due to the annual variations in the thermal and moisture conditions of the Antarctic Plateau atmosphere.

Conclusions
A complete picture of the large seasonal variations in the thermodynamic conditions of the troposphere and lower stratosphere was obtained by analysing the numerous sets of vertical profiles of p(z), T(z) and RH derived from the radiosounding measurements at Dome C during the four years from March 2005–March 2009. The present results cover the altitude range from surface level of 3.233 km a.m.s.l. to the top level reached by the radiosondes, usually around 12–17 km a.g.l. in the winter months and higher than 27 km a.g.l. in summer. These daily measurements can be conveniently used to evaluate the effects of pressure, temperature and moisture variations on thermal radiation exchanges between the surface and atmosphere, which efficiently regulate the downwelling flux of long-wave radiation and the emission of thermal radiation by the surface-atmosphere system toward space.
Well-defined annual cycles of pressure were found only at UTLS levels, with maxima in the summer (December and January) and minima in the late winter (July–October). The time series of daily pressure values at low and middle troposphere levels were more widely scattered and did not exhibit regular annual variations. However, the time patterns of the monthly mean values of pressure described some irregular variations, being generally higher in the summer months and lower in late winter. For instance, the monthly mean values of surface level pressure po showed annual maxima ranging between 643 and 659 hPa in December and January, and between 630 and 649 hPa in April–October. Year-to-year variations in the pressure vertical profiles were found to be rather small, with differences usually not exceeding 2% among the monthly mean values of pressure recorded in the winter and summer months of all the four years, and higher than 4% only in the summer months of 2007 at altitudes between 4 and 9 km a.g.l.
The daily measurements of temperature displayed regular annual cycles at the surface and within the whole ground layer as well as at the UTLS levels, with maxima in summer and wide minima during late winter. The surface-level minima were mainly widely scattered from late March to early October, with monthly mean values ranging between 203 and 217 K, while the surface-level maxima were well defined in December–January, ranging between 242 and 248 K over the four years. By contrast, very limited seasonal variations in temperature were observed at levels close to 2 km a.g.l., with daily values mainly ranging between 222 and 245 K throughout the year, which indicate that the atmospheric region above the thermal inversion layer is quite stable thoughout the year. Large year-to-year variations in the temperature conditions were observed at Dome C, in general no higher than 7 K at tropospheric and stratospheric levels for the winter months, but considerably more marked in the summer months, often exceeding 15 K at stratospheric levels.
The marked seasonal variations in surface temperature To are associated with considerable changes in the thermal inversion parameters that characterize the ground layer of the Dome C atmosphere. Temperature Tg at the top level of the inversion ground layer assumes daily values that were widely scattered between 220 and 250 K, and were mainly higher in summer and lower during the local winter season. Thus, the daily values of ΔT = Tg - To were nearly null in December and January (with monthly mean values of c. 2 K), and varying mostly between 15 and 30 K for the rest of the year. Depth Δz of the thermal inversion layer ranged mainly between 0.4 and 1.2 km, leading to nearly null values of the mean vertical gradient γ of temperature in the summer and widely dispersed values, varying mainly between 20 and 70 K km-1, throughout the long winter period from March–October. Appreciable year-to-year variations were observed for the thermal inversion parameters To, Tg, ΔT, Δz and γ, whose main anomalies are highlighted in Fig. 11.
Annual cyclical variations were also described by the tropopause temperature minimum Tm and its altitude zmin. Values of Tm varied between minima of < 190 K in the winter months (mainly in July and August) and maxima of 215–220 K in December–April, associated with values of zmin presenting maxima of 9–11 km a.g.l. in the winter period in July–October, and minima of 5–6 km a.g.l. from December–April. The most significant year-to-year variations in the two parameters can be appreciated in Fig. 13. The present results are a contribution to the knowledge of the time patterns of the tropopause thermal structure above the Antarctic Plateau sites (Tomikawa et al. Reference Tomikawa, Nishimura and Yamanouchi2009).
The series of daily vertical profiles of absolute humidity q(z) derived through the correction of radiosounding data were found to describe regular annual cycles at the surface. They ranged mainly between 0.002 and 0.1 g m-3 from April–October, and presented a marked peak from November–February of all the four years, with maxima varying mainly between 0.2 and 0.4 g m-3. At the tropospheric level of 1.8 km a.g.l., q(z) assumed rather scattered values, generally varying between 0.01 and 0.3 g m-3 throughout the year, and only rather limited variations passing from winter to summer. Almost stable values of q(z) were obtained at the 7 km a.g.l. altitude, ranging mainly between 0.002 and 0.005 g m-3. However, in numerous cases it was found that q(z) at z = 6.8 km a.g.l. assumed values higher than 0.01 g m-3 on days when upwelling tropospheric air masses reached this level during the summer and the subsequent months. As shown in Fig. 15, the highest annual values of absolute humidity were observed at surface level and the 1.8 km and 6.8 km a.g.l. levels in the summer periods of 2005/06 and 2008/09.
Precipitable water assumed relatively high values in the summer months, varying mainly between 0.5 and 0.8 mm (and greatly exceeding 1.0 mm in a few cases only), and relatively low values during the winter months, ranging mainly between 0.1 and 0.4 mm (and diminishing in rare cases to < 0.1 mm). Therefore, the monthly mean values of W presented annual maxima of 0.4–0.8 mm in December and January, and minima of 0.2–0.4 mm during the winter period from April–October. The most significant year-to-year variations in precipitable water were found in the summer periods of 2005/06 and 2007/08.
The present results provide a complete picture of the annual variations in the thermal and moisture conditions of the polar atmosphere above this high altitude Antarctic Plateau site, which furnishes useful information for the analysis of the BSRN measurements of the short- and long-wave radiation budget performed at Dome C and the calculations of Rayleigh-scattering optical depth at visible and near-infrared wavelengths.
Acknowledgements
The research activity was supported by the Programma Nazionale di Ricerche in Antartide (PNRA) and developed as a part of Subproject 2006/6.01: “POLAR-AOD: a network to characterize the means, variability and trends of the climate-forcing properties of aerosols in polar regions”. The authors gratefully acknowledge the International Centre for Theoretical Physics, Trieste, Italy, for its support of the participation of B. Petkov in the framework of the Programme for Training and Research in Italian Laboratories. The authors thank the Meteo-Climatological Observatory of PNRA for providing the radiosounding data recorded at Dome C during the four-year period from March 2005–March 2009 at its website http://www.climantartide.it. The meteorological tower measurements shown in Fig. 1 were provided by Laboratoire de Glaciologie, Grenoble (France), as part of the IPEV-sponsored CALVA (1013) programme. The constructive comments of the reviewers are also gratefully acknowledged.
Calculation of saturation water vapour pressure in the Antarctic atmosphere using the Murphy & Koop (Reference Murphy and Koop2005) formula
The values of saturated water vapour pressure in the pure phase over a plane surface of pure liquid water (labelled with symbol E(T)) were calculated at all levels ≤ 12 km using the Murphy & Koop (Reference Murphy and Koop2005) formula, which takes into account some recent results derived from molar heat capacity measurements and is assumed to be valid over the 123 ≤ T ≤ 332 K range. Its analytical form is:
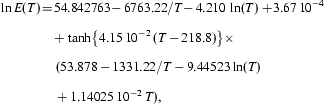 $$\openup 6ptno{ \ln E(T) \!= \!& 54.842763 \, \!{\rm{ - }}\,6763.22/T {\rm{ - }} \, 4.210 \, \ln (T) + \!3.67 \, {{10}^{{\rm{ - }}4}} \cr \! + \tanh \left\{ {4.15 \, {{{10}}^{{\rm{ - }}2}} \, (T \, {\rm{ - }} \, 218.8)} \right.\left. \big\right\} \times \cr\, (53.878 \, {\rm{ - }} \, 1331.22/T \, {\rm{ - }} \, 9.44523\ln (T) \cr+ 1.14025 \, {{10}^{{\rm{ - }}2}} \,T), \rm$$
where ln indicates the natural logarithm, and T is measured in K. The values of E(T) obtained from Eq. (A.1) were used in Eq. (1) to calculate the absolute humidity q(z) at each level z for a given value of RH(z).
The values of E(T) obtained in terms of Eq. (A.1) were compared with those of E(T) calculated using the following formulae:
1) the Goff & Gratch (Reference Goff and Gratch1946) formula over the 273 ≤ T ≤ 373 K range,
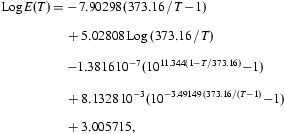 $$\hskip -8pt\openup 6pt{ {\rm Log}\,E(T)\, = \, & {\rm{ - }}\,7.90298\,(373.16\,/\,T\,{\rm{ - }}\,1)\cr+ \,5.02808\,{\rm Log}\, \, (373.16\,/\,T)\,\cr {\rm{ - }}1.3816\,{{10}^{{\rm{ - }}7}} ({{10}^{11.344(1{\rm{ - }}T/ \, 373.16)}} {\rm{ - }}1) \cr+ \,8.1328\,{{10}^{{\rm{ - }}3}} ({{10}^{{\rm{ - }}3.49149 \ (373.16/(T{\rm{ - }}1) \, }} {\rm{ - }}1)\cr+ \,3.005715, \eqno\rm$$
where Log stands for the logarithm in base 10, and T is measured in K, from which the values of E(T) given by the well-known Smithsonian Meteorological Tables (List Reference List1966) were obtained over the 223 ≤ T ≤ 375 K range,
2) the Bolton (Reference Bolton1980) formula,
 $$\openup 6pt{E(T) = 6.112\exp \ [{(17.67T\,{\rm{ - }}\,4.8267372\, {{{10}}^4} )} / \, \left( {T \,{\rm{ - }}\,29.66})} ], \eqno\rm$$
with T measured in K, which provides reliable evaluations of E(T) over the 238 ≤ T ≤ 308 K range, and
3) the Hyland & Wexler (Reference Hyland and Wexler1983) formula, used by Vaisala to calibrate the Humicap sensors,
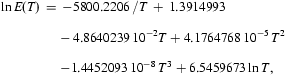 $$\openup 6ptno{ \ln E(T)\, = & \,{\rm{ - }}5800.2206 \, /T\, + \,1.3914993\cr{\rm{ - }}\,4.8640239\,{{10}^{{\rm{ - }}2}} T + 4.1764768\,{{10}^{{\rm{ - }}5}} \,{{T}^2} \cr {\rm{ - }}1.4452093\,{{10}^{{\rm{ - }}8}} \,{{T}^3} + 6.5459673\ln T, \rm$$
where E(T) is measured in Pa and T in K.
The comparison among the values of E(T) determined with the four formulas is shown in Fig. A.1 over the various validity intervals for temperature. It indicates that the formulas provide very similar values of E(T), with the most pronounced discrepancies in the T ≤ 220 K range, which is typical of the high troposphere and low stratosphere above Dome C throughout the period from March–November, as shown in Fig. 7.
Comparison among the curves of saturated water vapour pressure E(T) in the pure phase over a plane surface of pure liquid water as a function of absolute air temperature T, obtained using the Murphy & Koop (Reference Murphy and Koop2005) formula (red curve), the Goff & Gratch (Reference Goff and Gratch1946) formula (black curve), the Bolton (Reference Bolton1980) formula (green curve) and the Hyland & Wexler (Reference Hyland and Wexler1983) curve (blue curve) given in the Appendix, over the range of T from 190–290 K.

To give evidence of the discrepancies between the values of E(T) given by the four formulas, Fig. A.2 reports the values of ratio RE between the values of E(T) defined with the Murphy & Koop (Reference Murphy and Koop2005) formula and those correspondingly obtained from one of the above three formulas, Eqs (A.2)–(A.4). As can be seen, the Murphy & Koop (Reference Murphy and Koop2005) values of E(T) differ from:
Comparison among the values of ratio RE calculated over the 190–290 K temperature range between the estimates of E(T) determined with the Murphy& Koop (Reference Murphy and Koop2005) formula (labelled with capital letters MK in the graph), and the corresponding values of E(T) provided by one of the following formulas: Eq. (A.2) Goff & Gratch (Reference Goff and Gratch1946), obtaining the curve labelled with capital letters MK/GG, Eq. (A.3) Bolton (Reference Bolton1980), obtaining the curve labelled with capital letters MK/B, and Eq. (A.4) Hyland & Wexler (Reference Hyland and Wexler1983), obtaining the curve labelled with capital letters MK/HW.

i) those given by the Goff & Gratch (Reference Goff and Gratch1946) formula over the range 223 ≤ T ≤ 290 K by percentages equal to +0.15% from 290–260 K, and then decreasing to become nearly null at T ≈ 230 K, indicating that a close agreement exists between the two formulas for T ≥ 223 K,
ii) those given by the Bolton (Reference Bolton1980) formula over the range 238 ≤ T ≤ 290 K by percentages of about +0.1% over the 280 ≤ T ≤ 290 K range, which then become negative as T decreases to reach a value of -0.2% at T = 240 K, and
iii) those calculated with the Hyland & Wexler (Reference Hyland and Wexler1983) formula over the 190 ≤ T ≤ 290 K temperature range by percentages smaller than +0.04% over the 280 ≤ T ≤ 290 K range, in practice null over the 260 ≤ T ≤ 280 K range, and then varying from -0.1% at 250 K to -2.7% at 220 K. For lower temperatures, the percentage differences become gradually more pronounced, reaching values of -5.5% at 210 K, -9.3% at 200 K, and -12.6% at 190 K. Therefore, it can be concluded that the Murphy & Koop (Reference Murphy and Koop2005) formula can be confidently used to calculate E(T) over the whole 190–250 K temperature range usually observed at Dome C throughout the year, at all tropospheric and stratospheric levels reached by the radiosondes.