INTRODUCTION
Brassica rapa L. is an obligate out-crossing crucifer grown worldwide as a vegetable and for edible and industrial oil, providing a large proportion of the daily food intake in many regions of the world (Ofori et al. Reference Ofori, Becker and Kopisch-Obuch2008). There is a large variation in the plant organs that are consumed, which has resulted in the selection of different morphotypes depending on local preferences (Zhao et al. Reference Zhao, Wang, Deng, Lou, Wu, Sun, Xu, Vromans, Koornneef and Bonnema2005). These crops are grown for their leaves (turnip leaves, Chinese cabbage, pak-choi, Narinosa, Komatsuna, Mizuna and Mibuna), seeds (turnip rape, Chinese turnip rape and Sarson types), inflorescences (Broccoletto, Caixin, turnip inflorescences and Zicaitai) and enlarged roots (turnips).
B. rapa is classified into different subspecies. B. rapa subsp. rapa L. includes plants used as three different crop types: turnips, turnip leaves and turnip inflorescences. It is believed that B. rapa subsp. rapa was first used for its nutritious root in Europe, which occurred around 2500–2000 BCE (Gómez-Campo & Prakash Reference Gómez-Campo, Prakash and Gómez-Campo1999). The spread of vegetable crops within this subspecies, such as turnip inflorescences and turnip leaves, occurred later, independently from the origin of other leafy forms in Asia (Gómez-Campo & Prakash Reference Gómez-Campo, Prakash and Gómez-Campo1999). The long history and extensive use of cultivation of Brassica species in Galicia (north-western Spain) has given rise to a great number of landraces. They have been under cultivation for a very long time since they were among the first vegetables to be introduced into the Western Iberian Peninsula (Gómez-Campo & Prakash Reference Gómez-Campo, Prakash and Gómez-Campo1999).
B. rapa subsp. rapa L. is grown during the winter in the north-west of Spain, where turnip leaves and turnip inflorescences are used for human consumption in soups and stews, and turnips are mostly used for fodder. Agriculture in north-western Spain is traditional and even today growers continue to cultivate landraces in vegetable gardens for their own consumption. Commercial varieties of turnips, turnip leaves and turnip inflorescences have been selected by their use. Varieties employed as turnips have thickened roots, and they do not produce much leaf or secondary stems, and so they are not suitable for obtaining turnip leaves or turnip inflorescences. Commercial varieties grown to obtain turnip inflorescences and turnip leaves have been selected for high production of floral shoots or leaves. However, in the case of many local landraces grown in Galicia, the same landrace can be grown for more than one purpose, allowing the existence of local populations with high levels of variability (Padilla et al. Reference Padilla, Cartea, Rodríquez and Ordás2005). For example, within some landraces there are plants that have thickened roots and others that produce high numbers of leaves.
These landraces are a valuable resource since they are highly variable, are adapted to the climatic conditions of the area and can be resistant to different pests and diseases. A collection of B. rapa subsp. rapa from north-western Spain is currently kept at ‘Misión Biológica de Galicia’ (CSIC, Spain). This collection has been characterized based on morphological and agronomical traits (Padilla et al. Reference Padilla, Cartea, Rodríquez and Ordás2005); some landraces have been found suitable for inclusion in breeding programmes due to their good performance. A better understanding of the genetic diversity present in the collection is necessary in order to optimize its use and maintenance. Previous studies on the genetic diversity present in different B. rapa collections have used molecular markers, proving that they are useful tools for the characterization of agricultural crop diversity (Persson et al. Reference Persson, Fält and Von Bothmer2001; Zhao et al. Reference Zhao, Wang, Deng, Lou, Wu, Sun, Xu, Vromans, Koornneef and Bonnema2005; Ofori et al. Reference Ofori, Becker and Kopisch-Obuch2008). The objectives of the present work were to assess the genetic diversity present in the B. rapa subsp. rapa collection maintained at Misión Biológica de Galicia, to establish genetic relationships among populations and to study the genetic structure of the collection using simple sequence repeats (SSRs).
MATERIALS AND METHODS
Plant material and DNA analysis
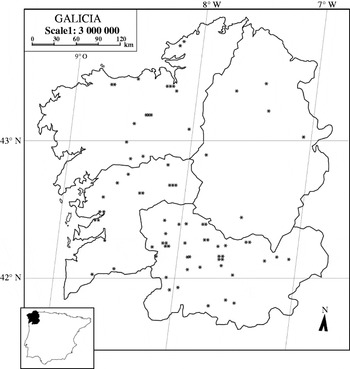
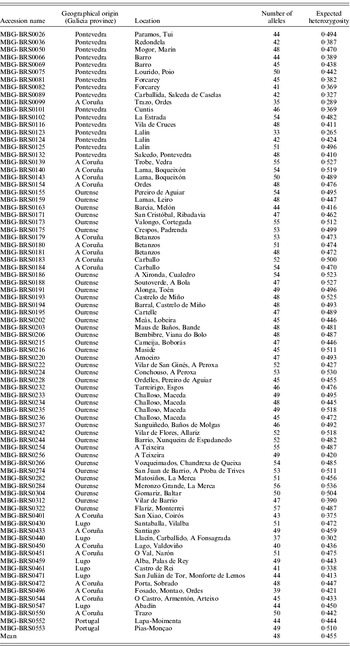
Eighty populations of B. rapa subsp. rapa collected in north-western Spain and the north of Portugal and kept at the Misión Biológica de Galicia (CSIC, Spain) Gene Bank were chosen for evaluation in the present study (Table 1). Populations from north-western Spain were collected throughout the region, in coastal and inland locations (Fig. 1). A previous study (Padilla et al. Reference Padilla, Cartea, Rodríquez and Ordás2005) classified the 80 populations into different clusters, based on morphological and agronomical traits. Because populations are heterogeneous and highly variable, 20 individuals from each population were analysed. Plants were sown in seedbeds and, 40 days later, the fourth or fifth leaf of each individual were used for DNA extraction following the method of Liu & Whittier (Reference Liu and Whittier1994) but without using microbeads. After an initial screening using 40 different SSRs, 18 SSRs that were polymorphic and independent were finally chosen to carry out the analysis (Table 2). Amplification of SSRs was performed using a PTC-100™ Thermal Cycler (MJ Research, Watertown, MA, USA). The amplification consisted of a denaturing step at 95°C for 5 min followed by 35 denaturing cycles at 95°C for 30 s, annealing at 56°C for 30 s and elongation at 72°C for 30 s. The programme ended with an extra elongation period of 10 min followed by a continuous cycle at 4 °C. Reactions were carried out with 50 ng of each primer, 0·6 unit of Taq polymerase (BioTaq, Kapa Biosystems), 200 μM each dNTP, 1×reaction buffer, 2·0 mm MgCl2, 50 ng DNA template, in a final volume of 25 μl made up with distilled and autoclaved water. After amplification, SSR products were separated by electrophoresis on 0·6 g/ml non-denaturing acrylamide gels run in 1×TBE buffer. Gels were stained with Ethidium bromide, run for c. 2 h at 250 V and then visualized under UV light. Bands amplified by each SSR were sized by comparison with hyperladder IV (Bioline). Alleles were scored as present (1) or absent (0) for each SSR across populations. A band was considered as present in a population if it was amplified in one individual of the 20 studied from the population.
Distribution of the populations analysed in north-western Spain.

List of Brassica rapa populations used in this study, including geographical origin, number of alleles and expected heterozygosity

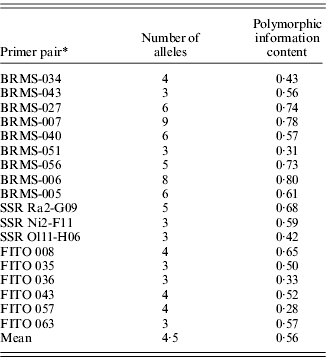
List of SSRs employed in this study, number of alleles and polymorphic information content
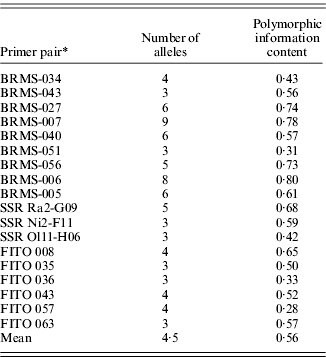
* Primer sequences and annealing temperatures of primer pair starting with ‘BRMS’, ‘SSR’ and ‘FITO’ were obtained from Lowe et al. (Reference Lowe, Moule, Trick and Edwards2004), Suwabe et al. (Reference Suwabe, Iketani, Nunome, Kage and Hirai2002) and Iniguez-Luy et al. (Reference Iniguez-Luy, Voort and Osborn2008), respectively.
Genetic diversity and genetic relationships
The number of alleles was computed for each SSR and each population. Average polymorphic information content was computed for each locus and expected heterozygosity average was computed for each population. A similarity matrix with presence–absence data was constructed using the NTSYS-PC version 2.1 (Rohlf Reference Rohlf1998) based on the Dice coefficient, also known as the similarity coefficient of Nei & Li (Reference Nei and Li1979). The Dice coefficient is computed as 2a/(2a+b+c), where a is the number of SSR bands shared by genotypes in each pairwise comparison and b and c are the number of SSR bands present in one genotype and not present in the other. Cluster analysis was performed using the unweighted pair group method with arithmetic averages (UPGMA) with the program NTSYS (Rohlf Reference Rohlf1998). A cophenetic correlation was calculated to test for the goodness-of-fit between the similarity matrix obtained from the cluster and the original similarity matrix. Bootstrap values to ascertain the internal support of clusters were calculated with the software Win Boot (Yap & Nelson Reference Yap and Nelson1996).
Genetic structure
An analysis of molecular variance (AMOVA; Excoffier et al. Reference Excoffier, Smouse and Quattro1992) based on the dissimilarity matrix of pairwise individuals was performed using Arlequin version 3.2 (Excoffier et al. Reference Excoffier, Laval and Schneider2005) to assess the genetic structure of the B. rapa germplasm. This analysis partitioned the total SSR variation into within- and among-population variation components. The significance level for variance components was tested probabilistically by a permutation test. The overall Fst was computed with Arlequin version 3.2 and gene flow was estimated from Fst according to Nei (Reference Nei1973) as follows:

Based on the genotype of the marker loci, individuals were assigned probabilistically into a given number of clusters inferred by the Bayesian approach of STRUCTURE (Pritchard et al. Reference Pritchard, Stephens and Donnelly2000). The number of clusters (k) chosen for modelling the data varied from 1 to 80. The likelihood of each k value L(k) was computed based on an initial burn-in period of 10 000 interactions, followed by 10 000 Monte Carlo interactions. The range of k values that showed the highest likelihoods (from k=1 to k=43) were run five different times. All runs used an admixture model with correlated allele frequencies and the parameter of individual admixture (alpha) was set to be the same for all the clusters. The accepted number of clusters (k) was identified using the procedure described by Evanno et al. (Reference Evanno, Regnaut and Goudet2005). Evanno et al. (Reference Evanno, Regnaut and Goudet2005), using simulated data, found that the distribution of L(k) did not show a clear mode for the true k value. They proposed an ad hoc quantity based on the second-order change of the likelihood with respect to k (Δk). The parameter Δk=m(│L″│)/s[L(k)] is calculated as the mean of absolute values of the second-order change of the likelihood distribution divided by the standard deviation of likelihood. The modal value of this distribution is interpreted as the true number of clusters k (Evanno et al. Reference Evanno, Regnaut and Goudet2005).
RESULTS
Genetic diversity and genetic relationships
The 18 SSRs detected a total of 83 different alleles across populations (Table 2). The number of alleles per locus ranged from 3 (several SSRs) to 9 (with BRMS 007), with a mean value of 4·5. The polymorphic information content ranged from 0·28 (using FITO 057) to 0·80 (using BRMS-006) (Table 2).
The genetic variation of each population was quantified by the number of alleles per locus and average heterozygosity (Table 1). The number of alleles per population ranged from 33 (MBG-BRS0123) to 57 (MBG-BRS0057), with a mean value of 48, and the expected heterozygosity ranged between 0·265 (MBG-BRS0123) and 0·536 (MBG-BRS0284) with a mean value of 0·455. The higher number of alleles and expected heterozygosity indicates the presence of a larger genetic variation; four populations: MBG-BRS0123, MBG-BRS0099, MBG-BRS0440 and MBG-BRS0461, showed the lowest level of genetic diversity and two populations, MBG-BRS0284 and MBG-BRS0139, showed the highest level of genetic diversity.
To clarify the relationships among populations a dendrogram based on the Dice coefficient, using the UPGMA method, was constructed (data not shown). Most of the populations were classified together for a distance of 0·82. Bootstrap analysis was used to evaluate the degree of support for clusters within the dendrogram (data not shown). Major clusters and subgroups within clusters are supported by low bootstrap values. The highest bootstrap values (>0·30) corresponded to clusters between pairs of populations; the remaining clusters showed support ⩽0·30. The cophenetic correlation between the similarity matrix based on Dice coefficient and the similarity matrix obtained by the cluster was 0·80.
Genetic structure
Most of the variation was located at the within-population level (0·90). The source of variation among populations accounted for 0·10 of the variability (Table 3). The fixation index (Fst) for the populations analysed was 0·100 and the level of gene flow based on Fst was 2·25 migrants per generation.
AMOVA for 80 populations of B. rapa

* Probability to obtain a random value greater than and equal to an observed value tested by 1023 permutations.
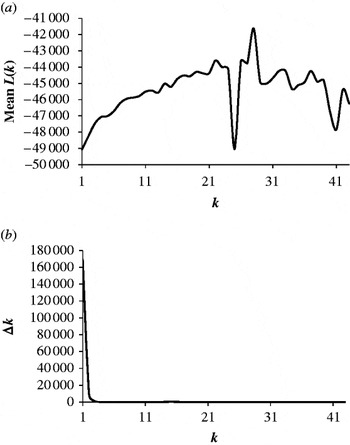
To detect the population structure of the total sample, the Bayesian approach implemented in STRUCTURE (http://pritch.bsd.uchicago.edu/structure.html, verified 13 Jan 2010) was used. This program allows assignment of individuals to k clusters and determines the proportion of genome of each individual in each assigned cluster. The most probable k value, taking into account L(k) was 28 (Fig. 2). However, when Δk was computed, the most probable number of clusters supported by the 1600 individuals analysed was 1 (Fig. 2).
(a) Distribution of L(k) for k=1 to k=43 based on an initial burn-in period of 10 000 interactions, followed by 10 000 Monte Carlo interactions and (b) distribution of Δk for k=1 to k=43 computed using the procedure described by Evanno et al. (Reference Evanno, Regnaut and Goudet2005).

DISCUSSION
Genetic diversity and genetic relationships
The diversity found within B. rapa populations analysed in the present study was higher than in the work reported by Fu & Gugel (Reference Fu and Gugel2009), who detected levels of heterozygosity from 0·120 to 0·197 in 10 cultivars of B. rapa subsp. oleifera analysed by SSR markers. The lower level of diversity found by Fu & Gugel (Reference Fu and Gugel2009) can be explained because the populations analysed were related by origin. The heterozygosity found by Ofori et al. (Reference Ofori, Becker and Kopisch-Obuch2008) in three open-pollinated cultivars of B. rapa subsp. oleifera (ranging from 0·480 to 0·530) was similar to those found in some of the populations analysed in the present work.
There was a broad range of genetic diversity in the populations analysed. Populations also showed a high level of genetic diversity for morphological and agronomical traits in previous work (Padilla et al. Reference Padilla, Cartea, Rodríquez and Ordás2005). Therefore, populations kept at the Gene Bank at Misión Biológica de Galicia offer good potential for further genetic improvement due to their high variability. Traditional varieties grown for years in north-western Spain have been selected both naturally and artificially for yield, resistance to pest and diseases and adaptation to the area where they are grown. They could be an important source of useful diversity for agronomic characteristics and resistance to diseases and pests for Brassica breeding programmes.
To study relationships among populations, a cluster analysis was carried out. Populations did not differ significantly since the majority of the populations were classified together. Clusters of populations were supported by low bootstrap values and the cophenetic correlation was moderate. An analysis of the genetic structure of the collection was carried out to study in detail the causes of this low level of differentiation.
Genetic structure
Most of the variability found in the populations analysed was due to the source of variation within populations. Previous studies on diversity within- and among-cultivar groups have been reported in B. rapa. Persson et al. (Reference Persson, Fält and Von Bothmer2001), using allozymes, reported 0·81 within-cultivar genetic diversity in turnip B. rapa from Northern Europe. High levels of within-population variation (0·90 and 0·83) were found in cultivars of B. rapa subsp. oleifera (Ofori et al. Reference Ofori, Becker and Kopisch-Obuch2008; Fu & Gugel Reference Fu and Gugel2009). Zhao et al. (Reference Zhao, Wang, Deng, Lou, Wu, Sun, Xu, Vromans, Koornneef and Bonnema2005), applying AFLP markers, reported comparable genetic diversity among and within different cultivars belonging to different B. rapa crops, including leafy vegetables, oilseed, root vegetables and fodder collected world-wide.
The results presented here confirm the low differentiation among populations, which is not surprising for an open-pollinated species as B. rapa. The high genetic diversity within populations is required to avoid inbreeding and to enable a high yield since, as an obligate outcrossing crop, B. rapa shows a severe inbreeding depression. Examples of similar patterns can also be found in other open-pollinated crops such as maize (Reif et al. Reference Reif, Melchinger, Xia, Warburton, Hoisington, Vasal, Srinivasan, Bohn and Frisch2003) and sugar beet (Novakova et al. Reference Novakova, Hamouz, Holec and Soukup2008).
Fst is a measure of the extent of genetic differentiation among subpopulations and can range from 0 (no differentiation) to 1 (complete differentiation). As expected for an outcrossing crop, a low overall differentiation among populations was observed. Gene flow is the movement of genes within and between populations. Generally, a single migrant per generation among idealized populations would be sufficient to prevent complete differentiation (Wright Reference Wright1969). In the present study, the level of gene flow based on Fst was 2·25 migrants per generation, which confirms the supposition of little genetic differentiation among populations. Gene flow in the collection of B. rapa subsp. rapa would occur naturally by means of migration (movement of pollen or seed carriers) or artificially by means of interchange or mixture of seed by growers.
The most probable k value computed with the method proposed by Evanno et al. (Reference Evanno, Regnaut and Goudet2005) does not agree with the one obtained by taking into account the distribution of L(k). Evanno et al. (Reference Evanno, Regnaut and Goudet2005) have demonstrated that L(k) does not show a clear mode for the true k value; however, the parameter Δk, taking into account changes of the likelihood distribution and the standard deviation of likelihood, is more reliable. In this case, although L(k) of k=1 was low, its standard error was very small, then its Δk was by far the highest value of the distribution, and therefore it can be concluded that all populations belong to the same cluster.
Using these data on SSRs, the 80 populations were clustered together independently of their geographical origin or morphological resemblance. This last result contrasts with Padilla et al. (Reference Padilla, Cartea, Rodríquez and Ordás2005), who classified all the accessions of the same B. rapa subsp. rapa collection into five clusters, based on morphological and agronomical traits, related to the potential use of the crop: vigorous plants for turnip leaf production, plants with a high number of secondary stems for turnip inflorescences and plants with the root thickened for turnip production. The lack of agreement between the classifications could be partly due to the fact that differences in the use of the plant are determined by few genes and that the number of SSR markers used in the present work is not enough to detect their effect.
After studying the B. rapa subsp. rapa kept at Misión Biológica de Galicia collection it can be concluded that it has a broad range of genetic diversity. Most of the variability was found within populations, due to: high rates of allogamy in the species, migration, interchange of seed or mixing of seed by growers. This means that populations are not differentiated, and therefore they can be considered as samples from a highly variable metapopulation that can be used for B. rapa breeding programmes.
As a result of the present work, the new knowledge on the genetic diversity and genetic structure of this collection will be useful for its utilization and management.
The authors thank the invaluable work carried out by Rosaura Abilleira, Eva Fernández, Susana Calvo and Elena Zubiaurre. Marta Francisco and Margarita Lema acknowledge their grants from the I3P program (CSIC, Spain). This research was supported by project RF-2006-00028-00-00 and the Excma. Diputación Provincial de Pontevedra, Spain.