

Endoscopic procedures are increasingly used in modern medicine for both exploratory and therapeutic purposes. Endoscopes are often contaminated with organic material, particularly inside the channels, and it is generally not possible to sterilize them because of their heat sensitivity. A high-level disinfection is performed after each use. In France, the monitoring of the quality of reprocessing of heat-sensitive endoscopes by microbiologic analysis is mandatory but the frequency of inspections is at the discretion of the hospital. 1 The workload linked with monitoring endoscopes is heavy in terms of both staff and equipment. Two difficulties must also be taken into account. On the one hand, there is a delay of several days between taking samples for microbiologic analysis and reporting of results, causing a delay in the hygienic measures that need to be taken. When a sample from an endoscope is noncompliant, the endoscope has already been reused for multiple patients, whereas as soon as the results are known it is withdrawn from use. Furthermore, the cumbersome process and cost of taking and analyzing endoscope samples lead to a restriction in their number, although they are essential to reveal contaminated devices and mobilize professionals on the need for optimal compliance with reprocessing procedures.Reference Saviuc, Picot-Guéraud and Shum 2 As suggested by Rutala and Weber,Reference Rutala and Weber 3 a real-time monitoring method could be useful to assess endoscope reprocessing and therefore the risk of infection.
Adenosine triphosphate (ATP) is a molecule present in all living cells. In the presence of oxygen, magnesium, and luciferin, a chemical reaction converts ATP to adenosine monophosphate with an emission of light detectable with a luminometer. This allows the amount of ATP present in a sample and therefore its organic content to be measured. This method gives instant results and is widely used in the food industryReference Murphy, Kozlowski, Bandler and Boor 4 , Reference Worsfold and Griffith 5 and increasingly in hospitals to assess the cleanliness of surfaces and equipment.Reference Lewis, Griffith, Gallo and Weinbren 6 – Reference Sherlock, O’Connell, Creamer and Humphreys 8 A correlation between the amount of light emitted (in relative light units [RLU]) and the bacterial load has been demonstrated in a laboratory setting.Reference Wadhawan, McEvoy, Prüβ and Khan 9 – Reference Shama and Malik 11 In contrast, there are few studies on the use of an adenosinetriphosphate bioluminescence assay (ATPmetry) for monitoring the reprocessing of endoscopes. Alfa et alReference Alfa, Fatima and Olson 12 – Reference Alfa, Olson and Murray 14 concluded that ATPmetry was of interest and defined a threshold of 200 RLU to validate adequate manual cleaning of endoscopes.
The objective of this study was to evaluate the diagnostic ability of ATPmetry to monitor the effectiveness of reprocessing of endoscopes in real hospital practice compared with microbiologic assays using microbiologic contamination thresholds defined in the French recommendations. 1
METHODS
Inclusion Criteria
We included in this study all consecutive samples from bronchial or gastrointestinal endoscopes made over 10 months in our 2,200-bed teaching hospital, whether scheduled or not scheduled.
Cleaning Procedure for Endoscopes
After initial manual cleaning, non-autoclavable bronchial and digestive endoscopes are disinfected with an automated endoscope reprocessor (Adaptascope) using peracetic acid and filtered water (0.20 µm) according to the NF EN ISO 15883 standard. After passing through the automated endoscope reprocessor, the endoscope is dried and stored in a sterile field inside a cupboard. Endoscopes stored more than 12 hours undergo new automatic reprocessing before use. This cleaning procedure was performed for all endoscopes having scheduled sampling. Endoscopes that received not-scheduled sampling (after repairs, on new or loaned devices, or for inspection after noncompliant standard sampling [control sample]) underwent reinforced manual reprocessing (double cleaning followed by sporicide disinfection).
Sampling for Microbiologic Analysis and Interpretation of Results
The endoscope sampling method is standardized and described in a protocol that conforms with national recommendations. 1 For each sample, 300 mL of rinsing solution is used to flush the channels of the endoscope. This volume is divided equally between the channels. The sample is then split into 2 150-mL portions for bacteriologic and mycologic analysis and transferred to the laboratory. The rinsing solution used was Neutralizing Pharmacopeia Diluent (NPD)–thiosulfate (bioMérieux). NPD-thiosulfate contains polysorbate 80, lecithin, histidine, and sodium thiosulfate for neutralizing the main disinfectants and particularly peracetic acid and thus permitting microbiologic analysis. Secondarily, in order to evaluate the effect of NPD-thiosulfate on the ATP measurements, this rinsing solution was replaced by sterile water for approximately 30 endoscope samples.
In the laboratory, 100 mL of rinsing solution is filtered through a sterile membrane placed on trypticase soy agar, incubated aerobically at 30°C, and read at 48 hours, 72 hours, and 5 days. The same filtration operation is performed with the remaining 50 mL and the membrane placed on Drigalski agar for specific detection of enterobacteria and Pseudomonas. The result is both quantitative (total colony counts) and qualitative with a search for indicator microorganisms (enterobacteria, Pseudomonas aeruginosa and other Pseudomonas, Stenotrophomonas maltophilia, Acinetobacter sp., and Staphylococcus aureus). The same procedure is used for the mycologic analysis. The cultures are grown on Sabouraud-chloramphenicol medium and incubated at 27°C and 35°C for 7 days to detect yeasts and filamentous fungi, respectively.
The results are interpreted according to the current recommendations. 1 They are classified as “target,” “alert,” or “action.” An endoscope classified as action is considered unacceptable to use. The thresholds are shown in Table 1.
Threshold Values of CFU for Microbiologic Samples From Endoscopes

NOTE. CFU, colony-forming units; IMO, indicator microorganisms: enterobacteria, Pseudomonas aeruginosa and other Pseudomonas, Stenotrophomonas maltophilia, Staphylococcus aureus, Acinetobacter sp., Candida sp., Aspergillus sp.
ATPmetry
We used a luminometer (Clean Trace ATP; 3M) and nonsterile swabs (Clean Trace Water ATP; 3M) to collect approximately 150 μL of solution to be analyzed. The technicians were trained in the use of the device by a manufacturer’s representative. Two sets of 3 ATPmetry measurements were performed at the site of endoscope controls by the person responsible for the microbiologic sampling. In order to obtain less diluted samples of the microorganisms collected and maximize ATPmetry values, we used the first jet of rinse from each channel to perform the first set of measurements, assuming that the first few milliliters would contain the most germs. The technician combined the first milliliter of rinsing solution emerging from each channel in the same vial, constituting the “first jet,” and 3 ATPmetry measurements were made on this first jet. The remaining first jet was then added to the rest of the sample. A second set of 3 ATPmetry measurements were made on the whole 300 mL sample, giving a total of 6 measurements per endoscope.
Statistical Analyses
A quality control of the data was performed. The intermeasure variability of ATPmetry was evaluated by nonparametric trend test. Continuous variables are presented as medians with interquartile range (IQR) and extreme values and were compared using the nonparametric Wilcoxon test. The nonparametric Kruskal-Wallis test was used when more than 2 categories were compared. Categorical variables were compared using χ2 or Fisher tests. Raw receiver operating characteristic (ROC) curves were calculated in order to seek an interpretation threshold. Then adjusted ROC curves were calculated to take into account potential confounding factors (batch of NPD solution, type of endoscope, sampling context). All tests were 2-tailed and the alpha risk error was set at.05. Statistical analyses were performed with Stata software, version 13.1 (StataCorp).
RESULTS
The study included samples from 165 endoscopes from February 1, 2014, through November 11, 2014, of which the microbiologic analyses classified 132 (80.0%) as target level, 17 (10.3%) as alert level, and 16 (9.7%) as action level. Of the last, 5 samples showed qualitative threshold criteria (presence of indicator microorganisms) only, 4 exceeded the quantitative threshold (>25 colony-forming units [CFU]) only, and 7 did both. The indicator microorganisms found were Enterobacter cloacae, Citrobacter freundii, Acinetobacter lwoffii, Klebsiella pneumoniae, Escherichia coli, S. maltophilia, and P. aeruginosa.
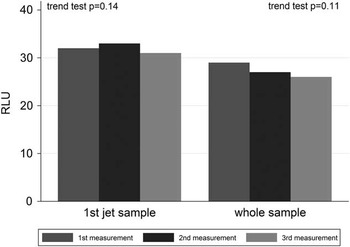
Sixty-two samples (37.6%) were taken on bronchial endoscopes and 103 (62.4%) on gastrointestinal endoscopes. Most samples were scheduled (73 [44.2%]). Studying intermeasurement variability, we did not observe significant decrease of the ATPmetry value during the 3 successive measurements either for the series of measurements on the first jet of samples or series on the whole of the sample (trend test: P=.14 and P=.11, respectively) (Figure 1). For each endoscope sample, the ATPmetry values used in the following results were the average of 3 measurements.
Intermeasure variability of adenosinetriphosphate bioluminescence assay values in the first jet sample and in the whole sample (n=165). RLU, relative light units.

The median (IQR) ATPmetry value was 32.3 (15.7–37.7) RLU for the first jet and 26.7 (15.0–36.7) RLU for the whole sample. There was no significant difference between the ATPmetry value in the first jet and in the whole sample (P=.36).
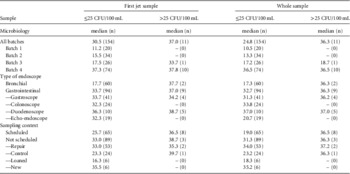
On the first jet of samples, the median (IQR) ATPmetry value was 32.3 (15.7–37.7) RLU for endoscopes in the target level and 16.3 (11.7–28.7) RLU and 36.5 (32.8–39.3) RLU for endoscopes in the alert and action levels, respectively (P=.02). For measurements on the whole sample, the median (IQR) ATPmetry value was 27.7 (15.0–36.3) RLU, 18.0 (12.3–26.3) RLU, and 36.3 (26.3–38.3) RLU for endoscopes classed as target, alert, and action, respectively (P=.01). We performed an analysis that did not take into account the qualitative criterion for safety (presence of indicator microorganisms). A significant difference in the ATPmetry value was found between samples with 25 or fewer CFU (n=154) and those with more than 25 CFU (n=11) whether for ATPmetry measurements on the first jet or on the whole sample (Table 2). The median (IQR) areas under the ROC curves for ATPmetry values corresponding to a microbiology threshold of 25 CFU, without adjustment, were 0.74 (0.64–0.83) for the first jet of samples and 0.74 (0.64–0.84) for measurements on the whole sample.
ATPmetry Values in RLU According to CFU Thresholds Obtained by Microbiologic Analysis of Samples From Endoscopes

NOTE. ATPmetry, adenosinetriphosphate bioluminescence assay; CFU, colony-forming units; IQR, interquartile range; RLU, relative light units.
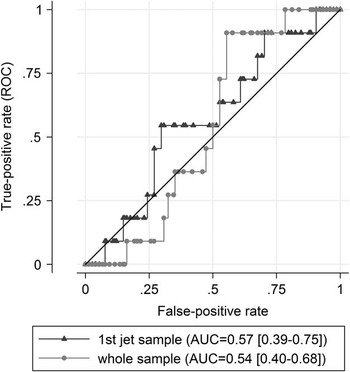
The ATPmetry value was then calculated for samples with 25 or fewer CFU and those with more than 25 CFU depending on the batch of NPD-thiosulfate solution used, the type of endoscope, and the sampling context (Table 3). We found a variation in ATPmetry values that was dependent on the batch of NPD-thiosulfate rinsing solution used, whatever microbiologic contamination (Table 3). To take into account this confounding factor, ROC curves adjusted on the batch of NPD-thiosulfate solution were calculated with areas under the curve of 0.57 (0.39–0.74) for ATPmetry measurements on the first jet and 0.54 (0.40–0.68) for measurements on the whole sample (Figure 2). We found no other confounding factors. ROC curves adjusted on the batch of NPD-thiosulfate solution were calculated for the gastrointestinal endoscopes subgroup, with areas under the curve of 0.49 (0.30–0.69) for ATPmetry measurements on the first jet and 0.43 (0.26–0.59) for measurements on the whole sample. It was not possible to calculate adjusted ROC curves for the bronchial endoscopes subgroup owing to the small sample.
Receiver operating characteristic (ROC) curve for adenosinetriphosphate bioluminescence assay according to microbiology after adjustment on the batch of Neutralizing Pharmacopeia Diluent solution. AUC, area under the curve.

ATPmetry Value in RLU According to Batch of NPD-Thiosulfate, Endoscope Type, and Sample Type

NOTE. ATPmetry, adenosinetriphosphate bioluminescence assay; CFU, colony-forming units; NPD, Neutralizing Pharmacopeia Diluent; RLU, relative light units.
Additional analyses were performed on 31 samples using sterile water instead of NPD. The median (IQR) ATPmetry value was 9.1 (1.3–38.7) RLU in the first jet and 2.9 (1.3–14.7) RLU on the whole sample. Two samples exceeded the threshold of 25 CFU (300 CFU and 58 CFU) with 27.7 RLU and 4.3 RLU, respectively, for the first jet sample and 4.7 RLU and 1.3 RLU, respectively, on the whole sample. Several sterile samples had high ATPmetry readings (38.7 RLU and 28.3 RLU in the first jet and 14.7 RLU and 5.3 RLU on the whole sample).
DISCUSSION
In France, in order to monitor the effectiveness of the reprocessing of endoscopes, samples are collected for microbiologic analysis. However, the microbiologic analysis has several disadvantages, in particular the delay in obtaining results and the cost, which restrict systematic controls after reprocessing. ATPmetry is a method giving low cost and instant results. The use of this technique for monitoring the reprocessing of endoscopes, according to French recommendations, deserved to be evaluated in real hospital practice.
After taking account of the batch of rinsing solution, we found no difference in ATPmetry values between microbiologically acceptable and unacceptable endoscopes using a threshold of 25 CFU per endoscope as defined in the French recommendations. In France, NPD-thiosulfate solution (bioMérieux) is currently recommended for rinsing endoscopes for contamination checks. However, color variations between different batches are regularly found, leading to a suspicion of variation in chemical composition that could interfere with ATPmetry measurements. In our study the batches of NPD-thiosulfate solution used in winter and spring (batches 1 and 2) were lighter in color than those used in summer (batches 3 and 4). In view of a lower rate of contamination in winter/spring than in summer,Reference Saviuc, Picot-Guéraud and Shum 2 the batch of NPD-thiosulfate solution used is an important confounding factor.
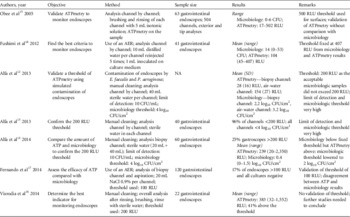
We performed a review of the literatureReference Alfa, Fatima and Olson 12 – Reference Fushimi, Takashina and Yoshikawa 18 on the use of ATPmetry for monitoring the reprocessing of endoscopes (Table 4). In several studies, thresholds of 500 RLU,Reference Obee, Griffith, Cooper, Cooke, Bennion and Lewis 15 200 RLU,Reference Alfa, Fatima and Olson 12 – Reference Alfa, Olson and Murray 14 , Reference Visrodia, Ofstead, Yellin, Wetzler, Tosh and Baron 16 or 100 RLUReference Fernando, Collignon and Beckingham 17 were proposed, whereas in our study ATPmetry values never exceeded 84 RLU. In the literature, the thresholds vary depending on the cleaning and disinfection procedures for endoscopes, the method of microbiologic sampling, and the requirements of samples for compliance with recommendations for acceptable reprocessing. They have not been consistently validated against a reference method such as microbiologic assays.
Literature Review of ATPmetry for Monitoring Endoscope Reprocessing

NOTE. AER, automated endoscope reprocessor; ATP, adenosine triphosphate; ATPmetry, ATP bioluminescence assay; CFU, colony-forming units; E. faecalis, Enterococcus faecalis; NA, not available; P. aeruginosa, Pseudomonas aeruginosa; RLU, relative light units.
Study Limitations
Several limitations should be considered and might explain our results. First, the solution used for endoscope rinsing (NPD-thiosulfate; bioMérieux) is transparent but yellowish with a variable color depending on the batch. Because it is a soapy scrub solution, it is possible that it directly interacts in the enzymatic reaction or changes the amount of light detected by the ATPmeter. Several studies taking samples from endoscopes with sterile water found higher ATP levels without any other change in the method.Reference Visrodia, Ofstead, Yellin, Wetzler, Tosh and Baron 16 , Reference Fushimi, Takashina and Yoshikawa 18 In our study, when using sterile water as rinsing solution, there was an important variability of ATPmetry level without microbiologic variation (from 1.7 to 38.7 RLU on first jet sample with sterile microbiologic analysis). Moreover, the 2 samples exceeding the threshold of 25 CFU (300 CFU and 58 CFU) had highly variable ATPmetry values especially for the first jet sample (27.7 RLU and 4.3 RLU, respectively). These data using sterile water are in line with the results presented using NPD-thiosulfate and confirmed that results of this study did not seem to be due to the rinsing solution.
Second, the low level of contamination of the endoscopes may explain the ineffectiveness of ATPmetry in monitoring their reprocessing. Indeed, the threshold set in France is 25 CFU per endoscope and it is possible that ATPmetry is not sufficiently sensitive to detect such concentrations. The ATPmetry measurements were performed on test portions of approximately 150 µL and even considering the organic load associated with bacteria (organic waste), the dilution may be too high. Among our microbiologically noncompliant samples, there were 4 endoscopes with levels of contamination greater than 1,000 CFU, whereas the ATPmetry values for samples from these endoscopes did not exceed 40 RLU. The range in ATPmetry values as a function of the microbiology of our endoscopes also seemed very low compared with the literature data. Using a procedure comparable with ours (except for the use of sterile water instead of NPD), Fushimi et alReference Fushimi, Takashina and Yoshikawa 18 found ATPmetry values from 45 to 407 RLU for microbiologic results from 0 to 53 CFU.
We performed measurements on the first jet in order to obtain less diluted samples of the microorganisms collected and maximize ATPmetry values; however, there was no significant difference between the ATPmetry values from the first jet and the whole sample. ATPmetry kits to concentrate samples for ATPmetry by filtration are available, but their use seems relatively complex and unsuitable for routine use at the sampling site. It would be interesting to study ATPmetry kits using filtration of the sample but these methods drift away from daily sampling conditions in real practice.
Notwithstanding these results, it is necessary to take into account another limitation to this method. It is not possible to detect by ATPmetry the presence of small quantities of indicator microorganisms; 5 of 16 noncompliant samples (action class) were due to the presence of indicator microorganisms, without exceeding 25 CFU.
ATPmetry, as currently proposed, is not suitable for use as an alternative or complementary approach to microbiology for monitoring the reprocessing of endoscopes.
ACKNOWLEDGMENTS
We thank Alison Foote, MD, of Grenoble Clinical Research Center for translating the manuscript.
Financial support. Grenoble University Hospital Clinical Research and Innovation Administration.
Potential conflicts of interest. All authors report no conflicts of interest relevant to this article.