Introduction
Civil society organizations (CSOs) Footnote 1 can play a large role in helping individuals overcome the collective action problem, by helping people use information they have, lowering the costs of claim-making, or involving them in the organizations’ actions themselves (Gugerty and Kremer Reference Gugerty and Kremer2008; Grossman Reference Grossman2014). Nevertheless, there is substantial variation in how effective CSOs are in this regard. Some CSOs seem well suited to spurring collective action, whereas others struggle to engage their communities. In this paper, I test a theory of how organizational attributes that cue congruence between an individual and organization affect civic engagement with it.
A CSO that wants to mobilize individuals – for outward-directed collective action or to help support actions within the organization – needs to engage them in some way. Yet, individuals do not have to engage with an organization. While research has looked at how individual costs and benefits impact engagement, the role of organizational attributes has been understudied. Unifying strands of the CSO and development literatures, I argue that individuals are more likely to want to engage with organizations that share their values, which I term congruence. I argue that, absent other information, individuals will use organizational attributes as cues about congruence. Organizations that are more local with regard to an individual and more descriptively representative of them will be more successful in soliciting engagement because individuals will assume such organizations’ values will match their own.
I use a forced-choice conjoint survey experiment conducted in Malawi to test how different organizational attributes impact individuals’ willingness to engage with a hypothetical election-oriented CSO. The strength of the conjoint is that it allows me to test several cues for congruence. I vary where an organization was founded, where it gets its funding, the former profession of its leader, and its political connections. Footnote 2 The experimental results support the theory, with more geographically local organizations and more descriptively representative organizations selected over less local and descriptively representative ones, although the funding source did not seem to matter. These findings are encouraging for aid groups that fund home-grown organizations instead of starting their own programs. Nevertheless, they imply that aid to organizations in less developed countries, like Malawi, may backfire. Donor pressures can lead organizations to be perceived as less congruent by bringing in leaders, employees, and members disconnected from the local population (Ishkanian Reference Ishkanian2008; Gugerty and Kremer Reference Gugerty and Kremer2008; Smith Reference Smith2010; Spires Reference Spires2012). Such organizations may then struggle to engage locals, causing them to be less effective avenues for “bypass aid” and impacting perceptions of government legitimacy (Dietrich Reference Dietrich2013; Baldwin and Winters Reference Baldwin and Winters2020). Footnote 3 Most importantly, these findings help us understand the role congruence and organizational attributes can play in the collective action process.
Congruence and organizations
When offered the possibility of engaging with an organization – attending a meeting, donating money, or becoming a member, for example – individuals initially face a simple choice: to engage or to abstain. The level of engagement can vary, but this comes after an individual has decided not to ignore the organization. To make this choice, individuals rely on a cost-benefit analysis (Olson Reference Olson1971). While classic work on organizational involvement has found that benefits can be intangible in nature, little research has looked at how organizational characteristics impact the engagement process (Wilson Reference Wilson1973; Klandermans Reference Klandermans1984). I use insights from the development and CSO literatures to develop a theory of how organizational characteristics that cue shared values can impact individuals’ engagement decisions.
Prior research shows that individuals will be more likely to engage with organizations that match their identity (Simon et al. Reference Simon, Loewy, Stürmer, Weber, Kampmeier, Freytag, Habig and Spahlinger1998; Foreman and Whetten Reference Foreman and Whetten2002; Klandermans Reference Klandermans, Snow, Soule and Kriesi2007). The mainly qualitative literature on development CSOs has similarly argued that organizations not reflecting the values of the local population struggle to connect to people, although little work has looked at individual-organization interactions and engagement (Mendelson and Glenn Reference Mendelson and Glenn2002; Porter Reference Porter2003). Combining these insights, individuals should prefer to engage with organizations that reflect their values more closely. I term this values match congruence. Footnote 4 In effect, individuals and organizations exist in a latent values space, and congruence signifies little distance between individuals and an organization. If individuals believe that an organization reflects their values, they will think that they are closer to it in this latent space and will therefore be more open to its advances. If individuals’ values are farther from an organization’s, they will be less willing to engage with it.
Although the literature stresses the importance of shared values, little quantitative work has investigated how individuals evaluate this. Murdie (Reference Murdie2014) theorizes that international NGOs (INGOs) are more effective when they signal shared values to local populations, including by “hir[ing] locals and put[ting] them in positions of power” (13). Nevertheless, Murdie (Reference Murdie2014) does not look empirically at citizen-organization interactions. As congruence is perceived, I argue that individuals take cues about how congruent an organization may be from organizational characteristics, which may be common knowledge or shared by the organization. Such information helps individuals place organizations in the latent space. Attributes can suggest congruence in different ways; in this paper, I focus on cues of localness and descriptive similarity. Due to the lack of attention paid to this process in the CSO literature, I draw on the voting literature, as both voting and engaging with CSOs are forms of civic participation.
Localness cues congruence due to in-group/out-group dynamics. If individuals believe that an organization represents “strangers,” they may be uncertain about whether it will reflect their values. If individuals believe that an organization represents the “locals,” they can assume it shares their values and may be more open to its advances. Research shows that voters favor localness – “evidence of a candidate’s presence and roots … within an electoral territory” (Evans et al. Reference Evans, Arzheimer, Campbell and Cowley2017) because “[a]ttributes like local origins … provide voters with substantive cues to a politician’s knowledge of the needs of the locality” (Shugart, Valdini and Suominen Reference Shugart, Valdini and Suominen2005, 438). In the development literature, organizations without local roots often struggle for legitimacy (Edwards and Hulme Reference Edwards and Hulme1996; Lang Reference Lang2013; Brechenmacher and Carothers Reference Brechenmacher and Carothers2018). Various attributes can cue congruence by signaling localness. For example, an individual may assume that an organization founded near them may reflect their values more than a less local one. An organization could also be local in terms of resources, drawing support for its work from the local community, instead of relying on outside support. Resources provided to an organization can give a sense of ownership over it – individuals may believe that a locally funded organization will therefore be more likely to share their values.
Another cue for congruence is descriptive similarity. Individuals may see the values of an organization whose membership or leadership reflects them descriptively as being similarly more akin to their own. The literature on descriptive representation and voting shows that individuals favor their own or similar race and ethnicity (Carlson Reference Carlson2015; Keele et al. Reference Keele, Shah, White and Kay2017), social class (Carnes and Sadin Reference Carnes and Sadin2015), religion (Calfano and Djupe Reference Calfano and Djupe2009; McDermott Reference McDermott2009), and occupation (McDermott Reference McDermott2005). Voters believe that more descriptively similar individuals will better represent their interests. In addition, after elections, individuals evaluate better, and connect more with, politicians who reflect them (Bowen and Clark Reference Bowen and Clark2014; Arnesen and Peters Reference Arnesen and Peters2018). Farmers vote for a self-identifying farmer because they believe that they share values that will influence the politician’s voting behavior, even on non-farming issues. Similarly, farmers may be more likely to join a local music club whose leadership and membership are also farmers because they believe the organization’s ethos will match their own, even though the organization is not explicitly agricultural. Research on CSOs in the former Soviet Union also shows that, due to differences in education and background, organizational leadership used language and presented ideas that local communities struggled to understand and perceived as unimportant to them (Sperling Reference Sperling1999; Hrycak Reference Hrycak2006). Therefore, an organization’s descriptive similarity can cue congruence, influencing how likely an individual will be to interact with it. Descriptive similarity can be cued by information about the leadership or membership of an organization. If an individual knows that the leader of an organization comes from the same profession as they do, for example, they may think that the organization’s values could likely match their own.
Building on studies of why individuals join organizations (Olson Reference Olson1971; Wilson Reference Wilson1973), I expect that congruence factors into an individual’s decision-making process. Individuals will prefer more local and descriptively representative organizations, as these attributes suggest that an organization will be congruent with them. An individual’s congruence with an organization can be a benefit in and of itself; it may be rewarding for individuals to be involved with an organization in which they feel comfortable. It may also impact the person’s cost-benefit analysis by decreasing costs and magnifying potential benefits. Spending scant free time on an organization may seem like a less burdensome cost for an individual if the organization appears likely to reflect them or if they will be among like-minded individuals.
Experimental design
I use a forced-choice conjoint survey experiment to test how selected congruence-cuing characteristics of an organization influence individuals’ desire to engage with that organization. Footnote 5 In this approach, individuals are shown two pairs of randomly created profiles and are asked to pick one or the other in response to one or more questions. Because congruence can be cued in many ways, a conjoint is the ideal way of examining it. The conjoint design allows me to test how different cues for congruence matter to individuals.
The experiment was embedded in a survey carried out on 2,531 market vendors in 128 non-random markets in eight districts in Malawi in 2018. Footnote 6 Vendors are an important social group in Malawi; they are well-organized, often have a contentious relationship with the state, and are active community members (Tonda and Kepe Reference Tonda and Kepe2016), helping to dispel the possibility that their responses on organizational involvement are just cheap talk. Malawi is also a suitable context for this study; there are many CSOs active in the country, both local and foreign, donor-organized and donor-led ones. Malawi has a competitive electoral system, and there is a concrete citizen demand for accountability.
Each respondent saw two fully randomized pairs of hypothetical organizations, leading to four observations per person. Before each profile pair, respondents were told to imagine that there were two nongovernmental organizations with equal budgets working in their area to promote free and fair elections in the 2019 presidential election. Footnote 7 Campaigning for the election was ramping up during the time this study was fielded. The two profiles were presented to respondents as quasi-vignettes, with enumerators describing each organization in turn, making sure that the attributes of each organization were clear to the respondent. After each pair, respondents were asked which organization’s meeting they were most likely to attend, if each organization held a meeting in their village (see App. A for full question text). This question gets at the idea of engagement with an organization. While this is not a direct behavioral outcome, willingness to engage with an organization is the first step in the collective action chain (Klandermans and Oegema Reference Klandermans and Oegema1987).
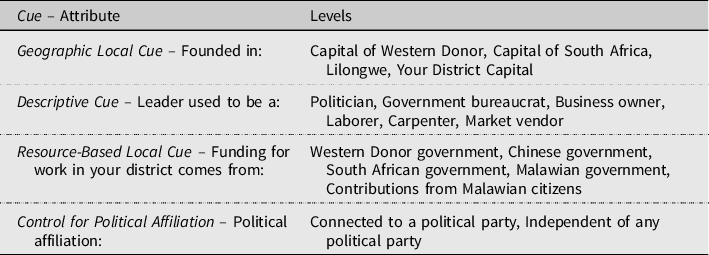
The conjoint attributes were presented in the order as shown in Table 1. The first three attributes cue congruence in different ways. The first examines how important the origin of an organization may be, a local cue for congruence. The second tests a descriptive cue for congruence by seeing whether the organization’s leader’s background matters to individuals. It exploits the nature of the sample, made up of all market vendors, allowing for the clearest test of descriptive representation with this sample without diluting the power via subgroup analyses. The third investigates how information about funding impacts willingness to engage with an organization; this reflects a different cue for localness. Within each attribute, the theorized strongest cue for congruence is listed last. In all cases, I expected that the other levels, which imply less congruence, would have lower support than the baseline.
Attributes and Levels for Conjoint Survey Experiment

The final attribute varies the political affiliation of the organization. Originally intended as another cue for congruence, changes to the survey made it impossible to interpret in this way. It nevertheless served so that respondents would not assume that certain attributes signaled political affiliation. Footnote 8 Although not a main focus of the analysis, the expectation was that individuals would choose non-partisan organizations, due to the substantive focus of the hypothetical organization.
Results
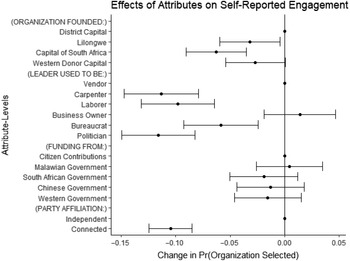
For the main analyses, I look at the average marginal component effect (Hainmueller, Hopkins and Yamamoto Reference Hainmueller, Hopkins and Yamamoto2014). Figure 1 shows the AMCEs for the meeting question, depicting the effect of attributes on self-reported engagement. We can interpret the AMCEs for each attribute level as how much more or less likely an individual was to pick an organization with that level relative to the baseline category. For each attribute, the strongest cue for congruence was chosen as the baseline category. My expectations translate into negative coefficients for other levels within each attribute.
AMCE Plot. Each AMCE represents the change in the probability of deciding to attend an organization’s meeting when going from a certain level in each attribute to the baseline for that attribute, when faced by a random profile. Model 1 from Table 2 in Appendix C was used for this plot. Dots without error bars represent the baseline level for that attribute. Error bars show 95% confidence intervals.

Overall results support the hypothesis that individuals’ congruence with an organization matters for engagement. This was true for both congruence signaled by geographic localness and descriptive representation. When it comes to the geographic cue for congruence, an organization founded in the respondent’s district capital elicited stronger responses from respondents than organizations founded in Lilongwe (the capital of Malawi) and the capital of South Africa, although it could only be distinguished from an organization founded in a Western donor capital at the 0.1 level. The AMCEs for this attribute indicate that respondents considered where an organization was founded relevant when they considered how likely they are to engage with it, underscoring the importance of locally cued congruence.
Descriptive similarity also mattered to respondents. Organizations led by a former vendor or a former business owner were more likely to be selected by respondents. It was not possible to distinguish statistically between the probability of being picked for these two categories. However, given that vendors, who sell goods or services in a market, could view themselves as business owners, or at least as business people, this still supports the theory that vendors favor organizations that are led by individuals with whom they can identify. The lack of a statistically significant difference between these two professions has a hopeful implication, as it suggests that descriptive similarity can be more expansive. Organizations looking to engage a certain population may not have to reflect it exactly as long as they reflect it in broader way. At the same time, this finding emphasizes that individuals are more willing to engage with an organization that reflects them in some way – even, crucially, when that organization’s goals have little to do with that identity itself.
There was no distinguishable difference between the baseline and other levels when it came to the source of an organization’s funding, suggesting that where an organization’s money comes from does not matter. In the development context, this fits with previous findings that funding sources may not matter as much to individuals, with local connections being more important (Cammett and MacLean Reference Cammett, MacLean, Cammett and MacLean2014). There are several additional possible explanations. First, respondents could have known that most CSOs in Malawi rely on foreign funding (USAID 2018) and thus did not punish organizations for doing so. It is also possible that resource-based localness could have had a positive effect, but some respondents assumed that foreign-funded organizations could have steadier funding going forward, despite the level of funding being held constant. Such contrasting effects would result in a null effect overall. Footnote 9
The null result is noteworthy, however, because it shows that Malawian vendors do not seem to show preference for organizations that receive funding from the West. This could present a problem for aid organizations that try to leverage ties with the West to elevate their status. Nevertheless, funding may be more important in the West or in countries where a government is disparaging of donor aid.
As expected, respondents were much more likely to choose an organization that was independent of all parties. This makes sense given the divided nature of Malawian politics and the organizations’ substantive focus – free and fair elections.
Discussion and conclusion
The results of this analysis underscore that people consider organizational attributes when thinking about engaging with an organization. Footnote 10 Individuals consistently chose organizations with attributes that imply congruence. The results therefore support the theory laid out above: individuals factor their perceived congruence with an organization into their engagement decision calculus.
The support for geographically local organizations could be seen as puzzling, as other studies have found that Western organizations are popular in developing countries (Guarrieri Reference Guarrieri2018). This may help explain the effect of the Western donor capital level. A possible cause could be that individuals are more likely to engage with more local organizations, but think that local organizations will be of lower quality versus Western organizations or that Western organizations may have more resources. The latter concern is mitigated by the design; all hypothetical organizations had the same budget. As a test of the former, I use a second outcome question, which asked which organization respondents thought would be more likely to have a scandal in Malawi (this question was asked second; see App. A for full question text). This gets at quality in the sense of how well an organization is run. The results (see App. C) are largely the same as for the meeting question, however. Respondents were statistically indifferent between Western-donor-capital-founded organizations and organizations founded in their district capital, suggesting that individuals think that local organizations are similar in quality. In general, more work needs to be done separating out preferences for local organizations from expectations for Western organizations.
The nature of the sample invites questions of external validity. Yet, the sample’s homogeneity facilitates the experimental design. The effect of the descriptive cue for congruence was clearly estimable because all respondents were market vendors. While the sample was drawn from a small, but important, sub-population, it is unlikely that congruence would not matter for the population at large. While vendors are more politically active than the average Malawian citizen, congruence should matter for these individuals as well. Subgroup analysis by community organization involvement and beliefs about the role of NGOs showed no heterogeneous effects among vendors (see App. D). The results are not driven by individuals who have experience with CSOs or think that CSOs can serve as important intermediaries. Less active individuals may have fewer previous interactions with CSOs, yet this subgroup analysis suggests that prior experience may not mediate congruence. In addition, descriptive similarity had a strong effect even for a non-vendor-focused organization, increasing confidence in the applicability of theory to non-vendors as well. The lack of heterogeneity suggests that the results here generalize and that the outcome question captures broader attitudes.
The experimental design and study context also merit discussion. Respondents were only asked about attending a meeting, not other types of engagement. It is possible that effects would be somewhat different or perhaps subject to desirability bias if the engagement were more costly. In a forced choice context, I expect the results to be similar; in a real-world case, a higher degree of congruence may be required to make costly actions palatable. However, if the cost is held constant, then I expect congruence to have a similar effect: individuals would favor organizations that they perceive as more congruent. In addition, the substantive focus was fixed. Nevertheless, congruence should matter for voluntary, non-election-oriented organizations. The core attributes here were not political, after all. The type of organization may signal congruence as well – a farmer may be more likely to donate to a 4-H club because it is associated with agriculture.
The study was carried out in Malawi, one of the most aid-dependent countries in the world (World Bank 2018). Yet, congruence should be important in more developed countries as well. On a theoretical level, the fact that individuals prefer the familiar is not a phenomenon exclusive to the developing world; Alinsky (Reference Alinsky1989[1971]) suggested that political organizers in the United States needed to look and act like the communities they sought to organize. How attributes serve to cue congruence might be somewhat different. For example, individuals in the United States of America might react differently to an organization with funding from China. At the same time, localness and descriptive similarity would still be important – college students might prefer organizations that come from close to campus and feature students in leadership roles.
There may be some variation among developing countries; while aid is generally viewed positively in Malawi, it is viewed much more negatively in some countries in the former Soviet Union, such as Armenia (Ishkanian Reference Ishkanian2008). There, I expect perceived congruence to matter even more strongly. In this way, Malawi may even be a hard test for the theory proposed here. Overall, vendors’ greater openness to descriptively similar and geographically local organizations suggests that donors need to reevaluate their intervention strategies. If they pressure organizations in a way that makes them seem less congruent, by imposing leaders, staff, and language that may not be familiar to locals – as some evidence suggests is the case (Chaplowe and Engo-Tjéga Reference Chaplowe and Engo-Tjéga2007; Gugerty and Kremer Reference Gugerty and Kremer2008) – their efforts can backfire. Such organizations may struggle for legitimacy.
In this paper, I conceptualize the idea of a values match between individuals and organizations as congruence. I then fill a gap in the CSO literature by examining how organizational characteristics can factor into individuals’ decision to engage with an organization or not. The results demonstrate that organizational attributes that signal congruence can make it easier for an organization to mobilize individuals for collective action – organizations should pay attention to how they present themselves, as it may make their jobs easier.
Supplementary Material
To view supplementary material for this article, please visit https://doi.org/10.1017/XPS.2021.27
Data Availability
The data, code, and any additional materials required to replicate all analyses in this article are available at the Journal of Experimental Political Science Dataverse within the Harvard Dataverse Network, at: doi: 10.7910/DVN/O6NMGE.
Acknowledgements
I would like to thank Lucy Martin and Brigitte Seim for their support and for making this project possible. I would also like to thank Graeme Robertson, Jacob Smith, Stephanie Shady, Christian Caron, Sean Norton, Brian Overington, Cole Harvey, and Silviya Nitsova for feedback at various stages of this project. I would also like to thank the editor and the three anonymous reviewers for their comments and assistance in making this paper the strongest it can be.
Conflicts of Interest
The author declares no conflicts of interest.