Ferroelectric glass-ceramics—An overview
The formation of glass-ceramics has advantages when compared to ceramics and single crystals, through the possibility of controlling physical properties, namely, electrical and optical properties, by controlling the volume fraction of the active phase dispersed in the glass matrix (please see the Introductory article in this issue). For example, to maintain optical transparency, the process of nucleation and crystal growth requires great control when the size of crystals dispersed in the glass matrix are not large enough to cause light scattering. However, for most electrical applications, it is necessary that the crystals have a size sufficient to present, for example, a ferroelectric response. These two attributes represent a difficult tradeoff. One solution to ensure optical transparency exploits the small difference between the refractive indices of crystals and glass matrix. If this difference is negligible, it allows, regardless of the crystal size, maintenance of the optical transparency of the glass-ceramic.
Ferroelectricity—General principles
Interest in ferroelectric materials results from its broad spectrum of technological applications. Ferroelectricity was discovered in the 17th century by E. Seignette, in La Rochelle, France, during the study of NaKC4H4O6.4H2O, known as Rochelle salt. In 1824, D. Brewster found that this material responded electrically to thermal stimuli, a phenomenon known as pyroelectricity. Later, in 1880, Pierre and Paul Curie characterized the response of this salt, and other crystals such as quartz, sphalerite (ZnS), and tourmaline ((Ca, K, Na, [])(Al, Fe, Li, Mg, Mn)3(Al, Cr, Fe, V)6(BO3)3(Si, Al, B)6O18(OH, F)4), to the effect of pressure (mechanical stimulation) to generate electrical polarization, resulting in the discovery of piezoelectricity. Reference Curie and Curie1
In 1918, W. Anderson and J. Cady Reference Cady2,Reference Anderson3 observed an anomaly in the piezoelectric characteristics of Rochelle salt, indicating that the linearity between polarization and external field becomes invalid for high electric fields. In 1921, J. Valasek noticed that the spontaneous polarization presented by Rochelle salt could be reversed by the action of an external electric field. Reference Valasek4 It was described, for the first time, as the phenomenon of ferroelectricity, a term adopted from ferromagnetism in reference to the hysteresis behavior they share. With the discovery of ferroelectricity in barium titanate (BaTiO3) single crystals in 1940, scientific research grew exponentially in this field due to promising applications in the electronics industry, particularly in the production of computer components. This discovery led to a better understanding of the phenomenon because of the simplicity of the barium titanate structure, a perovskite. In the 1950s, a new class of ferroelectric materials was discovered: Ba(Ti, Sn)O3 compounds, called relaxors. This anomalous behavior was measured. Reference Smolenskii5
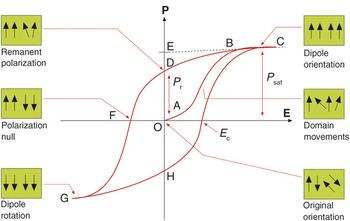
From a physical point of view, ferroelectricity is a characteristic of certain polar materials that, in a given temperature range, presents a spontaneous polarization (i.e., the dipolar momenta per volume unit tend to align themselves in the absence of an external electric field and their polarization can be reversed by the application of an external electric field). In traditional dielectric materials, the polarization is a linear function of the applied electric field. In ferroelectric materials, the nonlinear dependence between polarization and applied field results in a hysteresis curve, as shown in Figure 1 . Reference Xu6 Three major parameters are shown: (1) P sat is the saturation polarization or spontaneous polarization, which is the maximum polarization achieved by the material; (2) E c is the coercive electric field in which polarization is zero (P = 0) when it is applied; and (3) P r is the remanent polarization, when the external applied electric field is zero (E = 0).
Typical ferroelectric hysteresis loop. Note: E c, coercive electric field; P r, remanent polarization; P sat, saturation polarization; E, electric field; P, polarization.

Another intrinsic characteristic of ferroelectric materials is the transition temperature, known as the Curie temperature (T C). Above T C, the ferroelectric behavior ceases, and the material becomes paraelectric (i.e., no spontaneous polarization).
It has been assumed that the ferroelectric behavior of a material originates in the small distortion of the paraelectric phase crystal structure. The degree of symmetry of the ferroelectric phase is always less than that of the paraelectric phase. For example, in perovskites, the material has a cubic structure at temperatures higher than T C. With decreasing temperature, the atoms of the unit cell move from the center-symmetric position, giving rise to electrical dipoles Reference Xu6 and thus spontaneous polarization. Below T C and in the absence of an applied electric field, the electric dipoles are not oriented in the same direction throughout the material, but are oriented only within a region called the ferroelectric domain. Reference Jona and Shirane7 These domains are randomly arranged, canceling each other and producing a null total macroscopic polarization. Application of an external electric field tends to orient the domains in the same direction, polarizing the entire material up to a maximum value (saturation polarization). Upon removal of the external electric field, most of the domains tend to remain oriented, producing a memory effect (remanent polarization).
As previously mentioned, among the ferroelectric materials, the ferroelectric–paraelectric transition for relaxors does not occur at a characteristic temperature, but rather, over a temperature range. Because the frequency dependence of the maximum temperature of the dielectric constant (T m) cannot be described by the Curie-Weiss Law, Reference Samara8 the scientific community proposed the following model to explain the “relaxor” behavior. Nanopolar regions of lower structural symmetry are immersed in a nonpolar matrix with structure symmetry. Reference Samara8 These regions are detected at temperatures above T m, but as the temperature decreases, an increase in these nanopolar regions may result without achieving sufficient dimensions to form ferroelectric domains. Reference Samara8–Reference Blinc12
LiNbO3 ferroelectric crystals embedded on a glass matrix
The LiNbO3 crystal—Background
The most widely studied ferroelectric materials have the perovskite structure—their technological applications are based not only on their ferroelectric properties, but also on their ferromagnetic properties and superconductivity, all of which can present simultaneously. Among perovskite ferroelectric materials, lithium niobate (LiNbO3), first synthesized in 1949 by Matthias and Remeika, Reference Aboulleil and Leonberger13 has many important applications. In the late 1960s, due to the development of various applications of LiNbO3 in optical fibers, Bell Laboratories Reference Weis and Gaylord14 initiated a detailed study on the structure and properties of the LiNbO3 crystal, particularly its electro-optical properties. Reference Haertling15 This crystal is characterized by a high Curie temperature (T C = 1210°C), a high dielectric constant (80 at 100 kHz), low dielectric losses (∼0), and high resistivity (>1021 Ω cm) at room temperature. Reference Aboulleil and Leonberger13–Reference Haertling15 It also shows high efficiency in nonlinear optics, especially in the generation of second harmonic light, Reference Hecht16 and is widely used as a waveguide modulator and optical switcher. Reference Aboulleil and Leonberger13,Reference Vogel17,Reference Lin, Tanaka, Aono and Suzuki18
The properties of this crystal have been improved with the incorporation of dopants Reference Paiva, Barbosa, Filho, Hernandes, Andreeta and Sombra19–Reference Muñoz, Di Paolo, Duchowicz, Tocho and Cussó30 and the use of different preparation methods. However, due to difficulties and costs in the preparation of ferroelectric crystals, the preparation of glasses and glass-ceramics containing these crystals did not begin until the 1970s. Reference Halliyal, Bhalla and Newnham31–Reference Mukherjee and Varma33 The advantages of glasses containing ferroelectric crystals as compared to crystals prepared by traditional methods (e.g., the Czochralski technique Reference Mehran and Scott34,Reference Gerson and Kirchoff35 or sintering) stems from the simplicity of preparation and the possibility of modifying the properties of these glasses by changing the morphology of the precipitated crystals, namely their size, shape, and volume fraction. Reference Aegerter36 However, it is important to recognize that in general, the properties of glass-ceramics with embedded crystals are not as good as their single crystal counterparts, because the glass-ceramics present at least two phases, the crystalline (considered the active phase) and the amorphous phase.
For example, electric polarization of crystals embedded in a glassy matrix is difficult and requires higher external fields, due to the low dielectric constant of the amorphous phase. On the other hand, because of the high costs associated with single-crystal growth processes, their substitution by lower cost glass-ceramics is a current topic. When compared to ceramic materials, glass-ceramics have the advantage of being high-density materials without porosity.
The best-known glass preparation method is melt quenching, which involves mixing of the raw materials and mixtures, placing them into a nonreactive crucible under melting conditions. Subsequently, by rapidly cooling the melt, a glass forms. Reference Navarro37 This relatively simple process yields glasses with a low degree of porosity and allows the opportunity to fabricate glass-ceramics.
For glass-ceramics, the growth and crystal orientation can generally be achieved through different processes, such as mechanical deformation, thermodynamic control, and kinetic control (electrochemically induced nucleation, which promotes the formation of nuclei in the vicinity of an electrode (cathode), due to a specific current flow, consequently inducing subsequent crystalline growth in the direction of this electrical current). Reference Keding and Rüssel38 Thermodynamic control is the most common technique used for glasses. However, control of crystallization with the desired crystalline phase is often difficult because crystallization is a complex process affected by factors such as composition, surface conditions, and heat-treatment parameters.
Glass matrices
Different glass matrices have been used for crystallizing ferroelectric crystals, such as TeO2, Reference Komatsu, Tawarayama, Mohri and Matusita39 SiO2, Reference Prasad, Sayer and Vyas40–Reference Graça, Silva, Sombra and Valente42 B2O3, Reference Graça, Silva, Sombra and Valente43 and P2O5. Reference Graça, Valente and Silva44,Reference Araujo, Paiva, Araujo and Sombra45 Komatsu et al. Reference Komatsu, Tawarayama, Mohri and Matusita39 were pioneers in the synthesis of the TeO2-Li2O-Nb2O5 glass system. Using heat treatment, LiNbO3 crystals were precipitated within the glass network. TeO2 as a glass-network former is a good choice due to its low melting temperature, between 900 and 1200°C and its refractive index (∼2.0), which is close to the refractive index of LiNbO3 crystal (∼2.213), facilitating the formation of transparent glass-ceramics. Reference Kim, Komatsu, Sato and Matusita46 These researchers found that glasses with a high concentration of Li+ (>30 mol% Li2O), when thermally treated, resulted in a transparent glass-ceramic with LiNbO3 crystals with dimensions of nearly 10 µm. Reference Todorovíc and Radonjic47 The main properties observed in these glass-ceramics were high values of the dielectric constant (∼150), efficient generation of the second harmonic, and high nonlinear third-order coefficients. Reference Todorovíc and Radonjic47,Reference Komatsu, Kim and Mohri48
Shankar et al. showed that a composition containing 50% molar TeO2 and equal amounts each of Li2O and Nb2O5, heat-treated at 200°C for 12 h, formed LiNbO3 crystals, which precipitated mainly on the glass surface. Reference Shankar and Varma49 Ding et al. studied the crystallization of 55TeO2-25Li2O-20Nb2O5 (mol%) glass that underwent an ultrasonic treatment (28 kHz, 150 W), which promoted the nucleation and growth of LiNbO3 crystals on the glass surface. Reference Ding, Osaka and Miura50 Kim et al. attempted the preparation of transparent glass-ceramics for the glass composition 80TeO2-(20-x)Li2O-xNb2O5 (mol%), where LiNbO3 crystals were incorporated. By adding 15 wt% LiNbO3 to the glass and then melting it at 950°C, they obtained a transparent glass-ceramic containing lithium niobate crystalline phase.
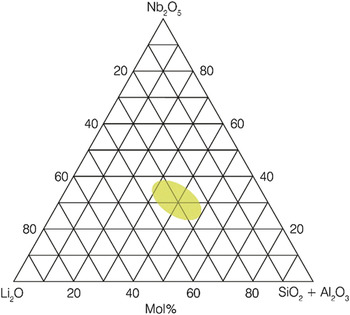
Prasad and colleagues published a study on the preparation of glass-ceramics from the SiO2-Li2O-Nb2O5 system. SiO2 was chosen as a network former because it does not contain cations that can change the crystal structure of LiNbO3, a desirable trait for a glass former. SiO2 satisfies this condition due to the reduced value of atomic radius and coordination number. Reference Prasad, Sayer and Vyas40–Reference Todorovíc and Radonjic47 Todorovic et al. Reference Todorovíc and Radonjic47 subsequently showed the glass-forming region of the pseudo-ternary system (SiO2-Al2O3)-Li2O-Nb2O5, using the melt-quenching method ( Figure 2 ). When [Nb2O5]/[SiO2] > 1 and the molar amount of [Li2O] > 25%, the glasses obtained are transparent and homogeneous. Subsequent thermal treatments to these glasses promoted the crystallization of LiNbO3 particles with sizes ranging between 150 and 350 nm while maintaining transparency. These glass-ceramics have a refractive index of 1.84–1.93 and a dielectric constant of 155–185 (@ 1 kHz; 300 K). Increasing the temperature and thermal treatment time led to an increase in particle size and consequent opacity of the samples. Reference Todorovíc and Radonjic47 Prasad et al., Reference Prasad, Sayer and Vyas40 Hasdemir et al., Reference Hasdemir, Brückner and Deubener51 and Todorovic et al. Reference Todorovíc and Radonjic47 studied silicate networks containing crystals of LiNbO3 and concluded that homogeneous and transparent glasses occur in the region of 32–39 mol% of SiO2.
Glass-forming region (in green) of the Li2O-Nb2O5-SiO2-Al2O3 system. Reference Todorovíc and Radonjic47

Nonsilicate glass families have also been explored, including those based on phosphorus. Pure phosphate glasses are extremely hygroscopic and colorless, and present a refractive index close to 1.55. Reference Galeener and Mikkelsen52 Araujo et al. Reference Araujo, Paiva, Araujo and Sombra45 prepared a series of glasses by melting compositions in the ((xNb2O5-(0.5-x)P2O5)-0.5Li2O)-yFe2O3) family to study the influence of the niobium oxide to lithium oxide ratio in a phosphate glass; iron oxide was used as an impurity. Based on x-ray diffraction (XRD) and infrared spectroscopy analyses, samples with x < 0.2 showed no crystalline phases, and for x > 0.2, LiNbO3 crystals were precipitated. Chowdari et al. fabricated a series of glasses from the P2O5-Li2O-Nb2O5 system by melt quenching, identifying the glass-formation region. Reference Chowdari and Radhakrishnan53 Araujo et al. described the doping of niobiophosphate glasses with iron. Reference Araujo, Paiva, Araujo and Sombra45 The nucleation and crystal growth of ferroelectric LiNbO3 in this glass matrix occurred preferentially in samples with high concentrations of niobium. In samples with lower amounts of niobium, formation of lithium phosphate phases were observed.
Singh et al. Reference Singh, Gandhi and Chaudhari54 showed that the preparation of lithium borate glasses (42.5Li2O-57.5B2O3 in mol%) with niobium (more than 15% of Nb2O5) yielded crystalline phases. The Nb5+ ions occupy Li sites and thus the number of empty sites will increase to maintain charge neutrality. According to Tuller, Reference Tuller and Button55 this type of structural rearrangement, where there are more empty sites than ions available to fill them, favors the increase of ionic conductivity. In glasses with more than 5% LiNbO3, the conductivity increases, attributed to the high mobility of Li+ ions, which is related to the increased number of empty sites. However, if the random network model proposed in 1932 by Warren and Zachariasen for silicate glasses Reference Navarro37,Reference Paul56 is suitable for lithium borate glasses, it is expected that the lithium ions will occupy empty spaces in a random manner and result in a distribution of activation energies for the conduction process. This concept was one of several that do not entirely explain the experimental observations. To explain the experimental observations, Porai-Koshits proposed in 1959 the existence of a polymer–crystalline structure, suggesting that the glassy network does not present absolute disorder. Reference Navarro37,Reference Paul56
Huang et al. showed that the use of melt quenching, with 45Li2O+50B2O3+5Nb2O5 (mol%) and Li2CO3 and H3BO3 as starting materials, forms transparent and homogeneous glasses without crystalline phases. Reference Huang and Huang57 Prasad Reference Prasad, Sayer and Vyas40 also described the application of thermal treatments to lithium borate glasses with niobium, where the LiNbO3 phase was detected for treatments at temperatures above 500°C. In glasses with higher niobium content, the heat-treatment process favors the formation of the Li3NbO8 phase, and the value of the dielectric constant appears to increase with increasing volume fraction of LiNbO3. For glasses treated at temperatures above 500°C, the presence of spherical particles, with an average size of 25 nm that increases with increasing thermal treatment temperature, were observed. Reference Prasad, Sayer and Vyas40
Glass-ceramics—Impact of crystalline phases and crystal orientation
Many of these studies have found that the crystalline phases in glass-ceramics fabricated by heat treatment are not orientated along a preferred direction. Typically, if the starting material is an isotropic glass, nucleation and crystal growth will also be isotropic. Because certain physical properties, such as piezoelectricity, depend upon the crystal or domain orientation, the crystal Reference Gerth, Rüssel, Keding, Schleevoigt and Dunken58 and domain orientations should align along their preferred directions, where alignment for both can be induced though electrical poling. Reference Davis, Vullo, Mitra, Blaum, Gudgel, Donnelly and Randall59,Reference Davis60
The crystallization process of a particular crystalline phase oriented in a predefined direction is usually difficult to implement because these materials systems require a high electric field value such that the resultant force can overcome the viscous medium, which is characteristic for each glass matrix.
To prepare the crystalline phase oriented in a preferential direction, special techniques must be implemented, such as electrochemically induced nucleation. This consists of applying a constant electric potential difference between two electrodes, which are in contact with the melt, promoting the movement of constituents in the melt in a nonrandom manner. Gerth et al. Reference Gerth, Rüssel, Keding, Schleevoigt and Dunken58 used this technique in silicate glasses containing lithium and niobium oxides, concluding that LiNbO3 crystallized with a preferred orientation perpendicular to the electrodes. Davis et al. Reference Davis, Vullo, Mitra, Blaum, Gudgel, Donnelly and Randall59 described the preparation of three lithium silicate glass-ceramics—with boron and SiO2, with NaNbO3, and with KNbO3. The first glass composition is nonferroelectric, but due to its composition, tends to form Li2Si2O5 crystals in a preferred direction through a heat-treatment activating process. The second and third examples exhibited ferroelectric characteristics through crystallization of niobate phases. All three glass-ceramics were electrically poled using a potential of approximately 8 kV (1-mm thickness). The piezoelectric properties evaluated in the Li2Si2O5 glasses remained undiminished at least up to 600°C, which was the limit of measurement, thus this glass is an example of a piezoelectric material able to function at high temperatures. Reznitchenko et al. Reference Reznitchenk, Turik, Kuznetsova and Sakhnenk61 mentioned that glass-ceramics with ferroelectric NaNbO3-poled crystals presented a d 33 coefficient of 15 pC/N, considerably lower than the value of 50 pC/N in dense NaNbO3 ceramics. The d 33 piezoelectric coefficient, or piezoelectric modulus, quantifies the volume change in the same direction of the applied electric field.
Another technique to control the crystal orientation is to apply an electric field during devitrification of the glass. Zeng et al. Reference Zeng, Tanaka, Hiaro and Soga62 showed that the composition 50SiO2-25Li2O-25Nb2O5 (mol%) prepared by melt quenching gives a transparent glass; they observed the crystallization of the LiNbO3 phase with a heat treatment at 800°C for 30 minutes. Upon applying an electric field during the thermal process and cooling the melt to room temperature, dark brown zones appeared in the glass indicating the occurrence of chemical and structural transformations. This suggests the occurrence of an oxidation–reduction reaction activated by the external electric field.
Gerth et al. conducted a similar study in a glass composition 35SiO2-45Li2O-20Nb2O5 (mol%) at 50 mA DC through the melt. Their results suggest that the presence of an external electric field favors nucleation and subsequent crystallization in areas close to the cathode. The LiNbO3 crystallites were isotropically distributed with the c-axis perpendicular to the electrode.
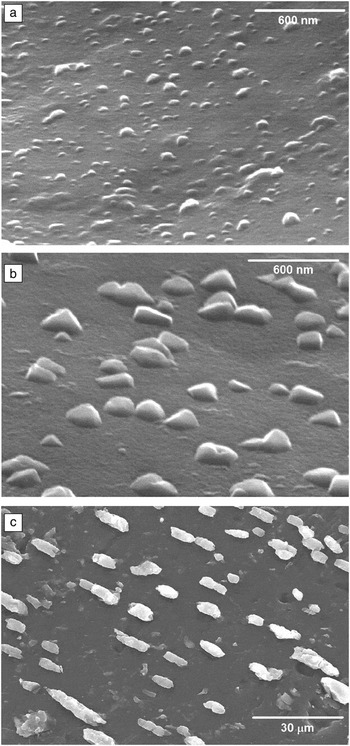
Graça et al. presented Reference Graça, Valente and Ferreira da Silva41–Reference Graça, Valente and Silva44,Reference Graça, Silva and Valente63–Reference Graça, Silva, Sombra and Valente69 the structural, morphological, and electrical analyses of silicate, phosphate, and borate base glasses, prepared by melt quenching and sol-gel, where LiNbO3 crystallites were grown by heat treatment with and without the presence of an external electric field. Figure 3a–b shows micrographs of silicate glasses heat-treated without the presence of an external electric field, revealing LiNbO3 particles with sizes of 60–300 nm embedded in the matrix. Figure 3c shows the micrograph of a silicate glass thermoelectric heat-treated with an external electric field of 5 kV/cm, revealing the growth of crystallites with a preferential orientation.
Scanning electron microscope micrographs of samples (a) 34SiO2-33Li2O-33Nb2O5 treated at 500°C; (b) 34SiO2-33Li2O-33Nb2O5 treated at 550°C; and (c) 92SiO2-4Li2O-4Nb2O5 treated at 700°C with a field of 5 kV/cm. Reference Graça, Valente and Ferreira da Silva41,Reference Graça, Silva and Valente63

The preparation of transparent glasses and growth of LiNbO3 crystals in glass networks was thus achieved by heat treatments. Graça et al. showed Reference Graça, Valente and Ferreira da Silva41–Reference Graça, Valente and Silva44,Reference Graça, Silva and Valente63–Reference Graça, Silva, Sombra and Valente69 that the infrared spectra of this type of glass revealed the existence of vibrations associated with NbO6 octahedral (centered at 595 cm–1) and Si-O- (NBO) bonds (900 cm–1), but they did not provide information on structural modifications of the glass when subjected to heat treatment. However, Raman spectroscopy revealed band narrowing with increasing heat-treatment temperature, indicating devitrification, as also corroborated by XRD data. Reference Graça, Valente and Ferreira da Silva41–Reference Graça, Valente and Silva44,Reference Graça, Silva and Valente63–Reference Graça, Silva, Sombra and Valente69
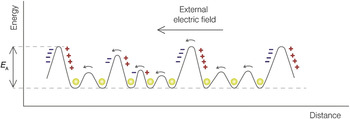
From morphological analysis, the modification of the number and size of the particles as a function of the heat-treatment temperature is justified by the diffusion of the network modifier ions (Li+ and Nb5+), which are structurally inserted in the glass network. Increasing the heat-treatment temperature enables the diffusion of free ions in the glass matrix and causes an increase in the volume of the particles. The electrical analysis assumes the existence of two major contributions, the first associated with the ions structurally inserted in the glass matrix and the second with the particles embedded in the glass matrix. Reference Prasad, Sayer and Vyas40 Thus, a decrease in the conductivity is expected, with the increase in crystal volume fraction. The other possible contribution includes the glass matrix and the embedded particles, which can be neglected for the conduction mechanisms due to their high resistivity characteristics. In these glass matrices, the electrical conduction mechanism can be interpreted using the Taylor and Stevels model. Reference Agarwal and Day70–Reference Jonscher72 This model assumes that the ions structurally inserted in a vitreous matrix and responsible for the conductivity are within potential wells ( Figure 4 ), and the activation energy represents the energy required by the ion to overcome the potential barriers.
Schematic representation of the model proposed by Stevels and Taylor for the ionic conductivity and polarization. + and – symbolize zones of positive and negative charge accumulation, respectively. The spheres represent charge carriers. Note: E A, activation energy. Reference Jonscher72

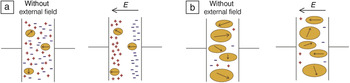
The dielectric measurements of these glasses gives an indication of the quality of the ferroelectric response. In the case of silicate glasses prepared by Graça et al., Reference Graça, Valente and Ferreira da Silva41–Reference Graça, Valente and Silva44,Reference Graça, Silva and Valente63–Reference Graça, Silva, Sombra and Valente69 a decrease in the dielectric constant (ε′) with an increase in the heat-treatment temperature was observed, which raises two questions. The first is related to the type of dipoles present in these glasses, which can be divided into two groups, one arising from network modifier ions and the other from the particles embedded in the glass matrix. The second question is related to the value of the applied electric field (1 kV/m). These issues suggest that the decrease of ε′ can be attributed to a decrease in the amount of network modifier ions, causing a decrease in the dipole moment. However, given the presence of LiNbO3 ferroelectric crystallites embedded in the glass matrix, it can be assumed that the decrease of ε′ is also influenced by the orientation of the particle dipoles. If the orientation is not completely guided by the applied electrical field, the overall dipole moment will decrease. Knowing that the conventional heat-treatment process promotes crystallite growth in random directions, the possibility of different directions of dipoles is possible, and thus, the dipole moment should decrease.
This hypothesis was confirmed in thermoelectrically treated glasses. Reference Graça, Silva, Sombra and Valente42,Reference Graça, Silva and Valente66 Figure 5 illustrates this hypothesis, with the signals (+, –) representing the ions structurally inserted in the glass matrix, decreasing in amount with an increase in the heat-treatment temperature and the “circles” representing particles; the dipole orientation is indicated by the arrow.
Dielectric model for the glass-ceramics. (a) Glass-ceramic where the free ions are the predominant dielectric units; and (b) glass-ceramic where the embedded crystals are the predominant dielectric units. The signals represent the ions (+, –) structurally inserted in the matrix network, and the arrows represent the dipole orientation from embedded crystals (orange ovals). Note: E, electric field.

Summary
This article described the preparation of glass-ceramics with ferroelectric crystals dispersed in a glass matrix. An overview of highlights of various studies conducted thus far are presented, focusing on the type of oxide used as the network former and the methods of formation of the glass-ceramic. The importance of factors such as crystallinity, size, and amount of the particles dispersed in the matrix and the crystallites growth orientation toward the electrical properties were discussed.
Acknowledgments
This work was funded by FEDER funds through the COMPETE 2020 Programme and National Funds through FCT—Portuguese Foundation for Science and Technology under the Project UID/CTM/50025/2013.

Manuel Pedro Fernandes Graça is principal researcher at the Institute of Nanostructures, Nanofabrication, and Nanomodeling in the Physics Department and professor of micro- and nanoprocessing techniques at the Universidade de Aveiro, Portugal, since 2008. He obtained his undergraduate degree in physics engineering, master’s degree in materials science and engineering, and PhD degree in solid-state physics. His research includes experimental physics and materials electrical properties. He is the author of one book, co-author of seven book chapters, and more than 150 journal articles, with 1400+ citations. Graça can be reached by phone at +351964236731 or by email at mpfg@ua.pt.

Manuel Almeida Valente is the coordinator of the research group Novel Materials and BioSystems at the Institute of Nanostructures, Nanofabrication, and Nanomodeling in the Physics Department at the Universidade de Aveiro, Portugal, where he served as director from 1994 to 1996. He has published one book, five book chapters, 185 articles, and 13 proceedings, with more than 1400 citations. His research interests include magnetic and electric properties, ferroelectric materials, multiferroics, and noncrystalline materials. Valente can be reached by phone at +351234370281 or by email at mav@ua.pt.